

Bonnie’s Market Update 2/13/26
02/15/2026
The market sold off after rallying at the start of the week. Five of the eleven S&P SPDR sectors were higher. Energy (XLE) and Healthcare (XLV) were the strongest sectors, while Industrials (XLI) and Financials (XLF) were the weakest sectors. The SPDR S&P 500 ETF Trust (SPY) fell by -0.36%.
S&P SPDR Sector ETFs Performance Summary 6/6/25 – 6/13/25

061325 weekly SPDR Sectors
Source: Stockcharts.com
Figure 2: Bonnie’s ETFs Watch List Performance Summary 6/6/25 – 6/13/25

061325 Bonnie’s ETF Watch List
Source: Stockcharts.com
Gold, Semiconductors, Biotechnology, and Silver were in favor, while Small-Cap Growth was under selling pressure.
CHARTS CHARTS AND MORE CHARTS FOR YOU TO REVIEW. GO HERE.
Investor Sentiment
Figure 3: Fear & Greed Index

061325 CNN Fear and Greed Index
Source. CNN.com
Investor sentiment, as measured by the Fear and Greed Index (a contrarian indicator), closed at 60, indicating a state of greed. There is likely more room for upside since the index is not yet showing Extreme Greed, where many rallies peak.
NYSE New Lows Remain in a Low-Risk Zone
Figure 4: NYSE New Lows

061325 NYSE New Lows
Source: Stockcharts.com
New Lows peaked at 1167 on 4/7, then contracted sharply.
New Lows closed at 60 last week, remaining in a low-risk zone. It would remain positive in the short term if New Lows fall below 50 and do not rise above 150. Learn more about the significance of New Lows in my book, Journey to Wealth, published on Amazon. For a preview, you can download a free chapter here.
Figure 5: CBOE Volatility Index (VIX)

061325 VIX Daily
Source: Stockcharts.com
The CBOE Volatility Index (VIX), a measure of fear, rose last week with a notable increase on Friday, up 15.54%, and should be watched. A close above 25.00 would imply that daily intraday volatility is likely to increase and a risk of a short-term correction week.
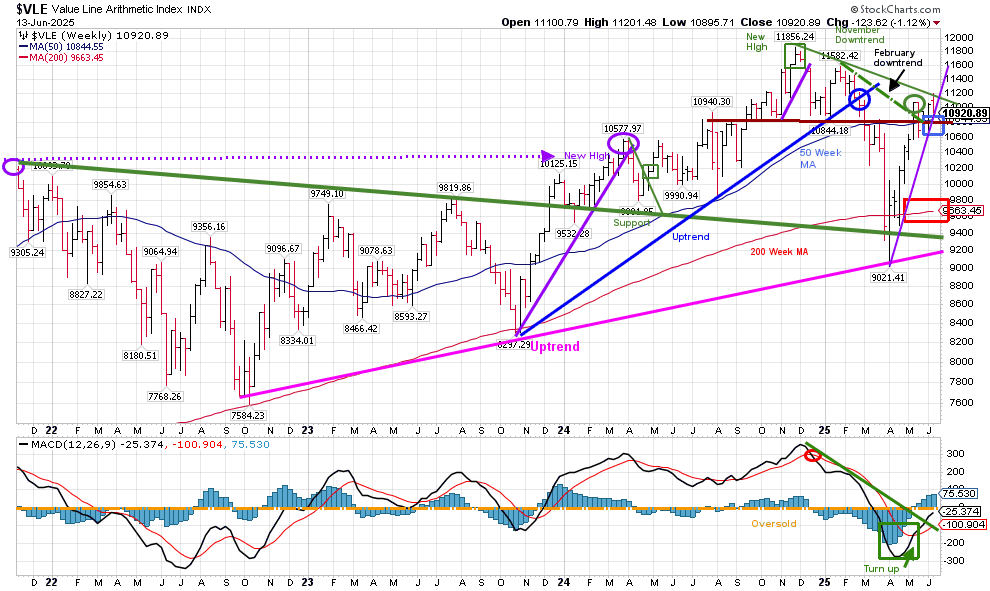
Figure 6: Value Line Arithmetic Average Weekly (Top) and 12-26-9 MACD (Bottom)
061325 Weekly VLE
Source: Stockcharts.com
The Value Line Arithmetic Index ($VLE) is a mix of approximately 1700 stocks. The VLE intermediate trend remains up. If VLE moves higher, it’s positive for the broad market.
The VLE uptrend from October 2023 (blue line) broke in late February and then fell to the October 2022 uptrend line (pink line), slightly penetrated before rising sharply. It remains positive that VLE closed above its 50-week moving average (blue rectangle) and 200-week moving average (red rectangle). A weekly close above 11201.48 (the high from last week) would imply VLE testing the old high at 11856.24.
Support is at 10600, followed by 10200. Resistance is 11300, followed by 11600.
I invite you to join my Facebook Group. Learn more about it here: Wealth Through Market Charts.
Figure 7: S&P 500 Weekly (SPY) and 12-26-9 MACD (Bottom)

061325 SPY Weekly
Source: Stockcharts.com
The S&P 500 (SPY) remains in an intermediate uptrend after closing down -0.36%, near its low after Friday’s news weakness.
SPY is quietly consolidating its gains from the April low, and the odds favor a new high being made in the SPY.
MACD (bottom chart) remains on a buy, rising above 0, which is positive.
An upside projection of 700.00 remains as long as the SPY closes above 575.00.
Discover how to cultivate a powerful wealth-building mindset and effective charting strategies to grow your wealth from the comfort of your own home in my eCourse, Wealth Through Investing Made Simple. Learn more here.
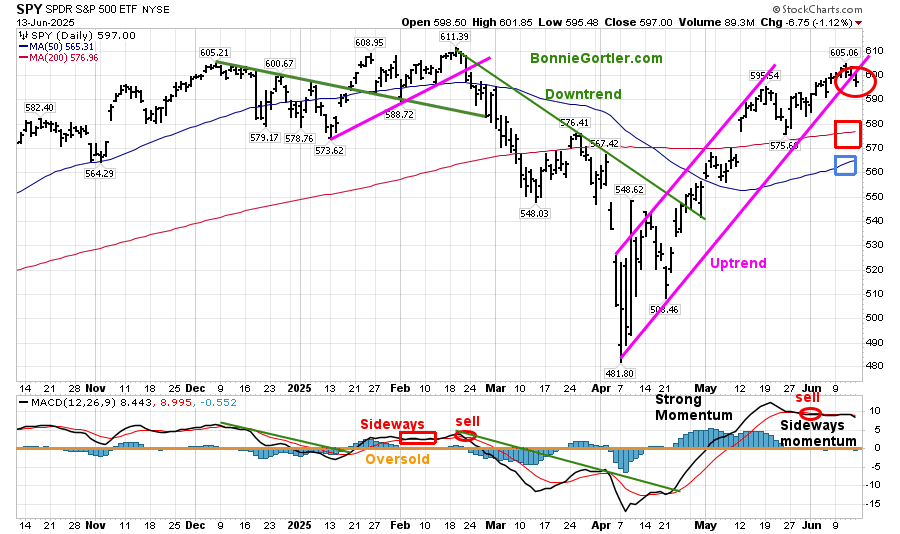
Figure 8: S&P 500 Daily (SPY) Price (Top), 12-26-9 MACD (Bottom)
061325 SPY Daily
Source: Stockcharts.com
The S&P 500 (SPY) closed near its low on Friday, slightly penetrating the April uptrend, but remains above the 50- and 200-day moving averages.
Resistance is 600.00 and 610.00. Support is at 595.00, 575.00, and 565.00.
The MACD (middle chart) is in a sell position, above 0, on sideways momentum within a consolidating pattern.
In Sum:
With MACD for the intermediate term on a buy with rising momentum above 0, any pullback in the SPY is likely to remain contained.
You can explore Bonnie’s market charts from last week and more HERE.
Figure 9: Daily iShares Russell 2000 (IWM) Price (Top),12-26-9 MACD (Middle), and Money Flow (Bottom)

061325 IWM Daily
Source: Stockcharts.com
The iShares Russell 2000 Index ETF (IWM) finished down 1.42% last week, with a decline of 1.83% on Friday, which was weaker than the S&P 500 for the week.
IWM had broken the downtrend since November 2024 (green line) and is now in the process of testing the breakout.
IWM closed above the 50-day moving average (blue rectangle) but has not yet had sufficient strength to close above the 200-day moving average (red rectangle). Two closes above 215.11 would be positive. On the other hand, two closes below 199.03 would be negative in the short term.
MACD (middle chart) remains on a sell, above 0, after strong momentum with a bearish double top formation.
The Money Flow (lower chart) reached 80, indicating an overbought condition, and subsequently turned down. Since June, the Money Flow Index has turned up, but no real strength has been evident so far, which is concerning.
Unless IWM starts to outperform the S&P 500 consistently, this will be another false breakout.
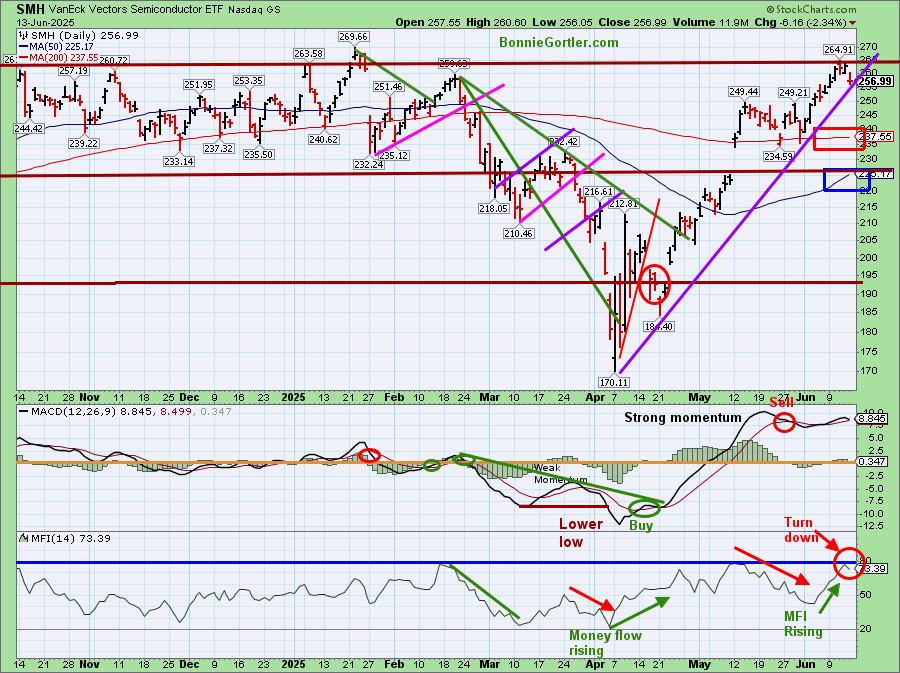
Figure 10: Daily Semiconductors (SMH) (Top), 12-26-9 MACD (Middle), and Money Flow (Bottom)
061325 SMH Daily
Source: Stockcharts.com
The top chart shows the Daily Semiconductor (SMH) ETF, which is concentrated mainly in US-based Mega-Cap Semiconductor companies. SMH tends to be a leading indicator for the market when investors are willing to take on increased risk, and the opposite is true when the market is falling.
SMH led, up +1.69% last week, closing above both the 50-day MA (blue rectangle) and the 200-day MA (red rectangle), implying underlying strength continuing its April uptrend.
Support is at 249.00, 237.00, and 225.00. Resistance is at 259.00 and 269.00. Two closes above 269.00 would imply a potential for the start of a new leg higher.
The MACD (middle chart) remains on a sell signal, above 0, and is turning down in a bearish double top formation after experiencing strong upside momentum.
Money Flow (lower chart) reached 80 (blue line), overbought, and turned down, implying a pause in the rally.
Continued leadership by semiconductors would be positive. On the other hand, if SMH begins to lag and underperform, it would be a negative in the short term.
Summing Up:
The major averages were all higher early in the week but closed lower after Friday’s outbreak in the Middle East. It’s a mixed picture, with daily momentum patterns that initially showed strong momentum in April now forming potential double tops, while intermediate-term patterns are rising, implying more room to the upside. Friday’s selling pressure could continue in the short term if the Israel-Iran conflict escalates. Technically, market breadth and favorable intermediate trends imply higher prices ahead if support levels hold early in the week. Any pullback is likely to present a buying opportunity as quarterly window dressing will begin. Manage your risk, and your wealth will grow.
If you’d like to explore the charts further and get to know each other better, please email me at Bonnie@BonnieGortler.com or visit my calendar to schedule a time Here.
If you like this market update, you will love my free Charting Master Class. Learn more HERE.


Create more wealth in your life
with these simple strategies.
As an added bonus you will also
receive BG’s Updates and Ezine

Discover how to quickly create more well-being in your life with these simple strategies.
As an added bonus you will also
receive BG’s Updates and Ezine

As an added bonus you will receive BG’s Updates and Ezine

All work listed on BonnieGortler.com is licensed under a Creative Commons Attribution - Noncommercial - No Derivative Works 3.0 Unported License.
