

Bonnie’s Market Update 2/13/26
02/15/2026
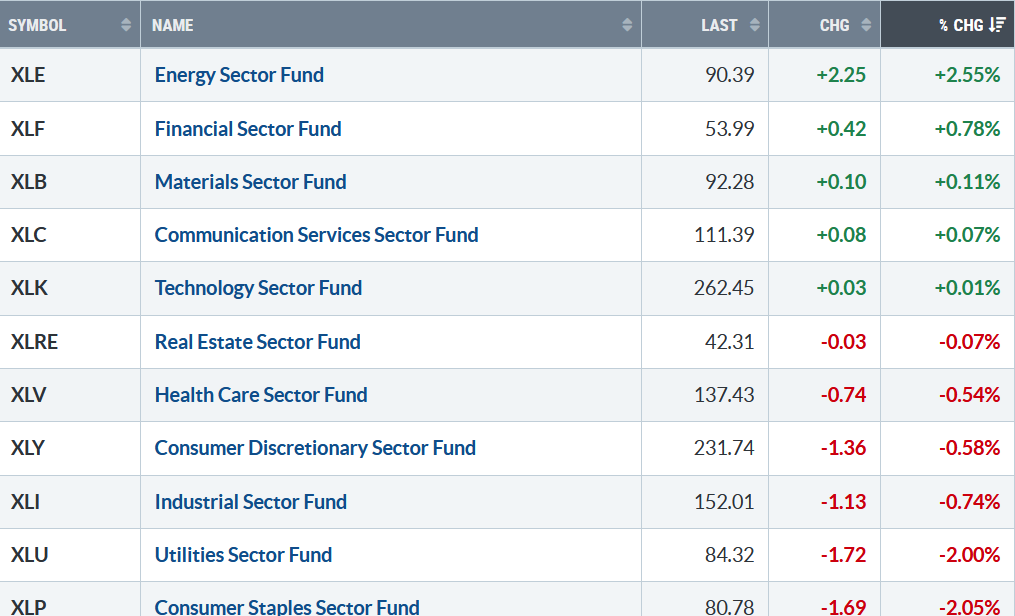
A solid week of gains. For the week, Nine of the eleven S&P SPDR sectors were higher. Technology (XLK) and Utilities (XLU) were the strongest sectors, while Materials (XLB) and Consumer Staples (XLP) were the weakest. The SPDR S&P 500 ETF Trust (SPY) rose +0.29%.
S&P SPDR Sector ETFs Performance Summary 9/05/25 – 09/12/25
91225 weekly SPDR Sectors
Source: Stockcharts.com
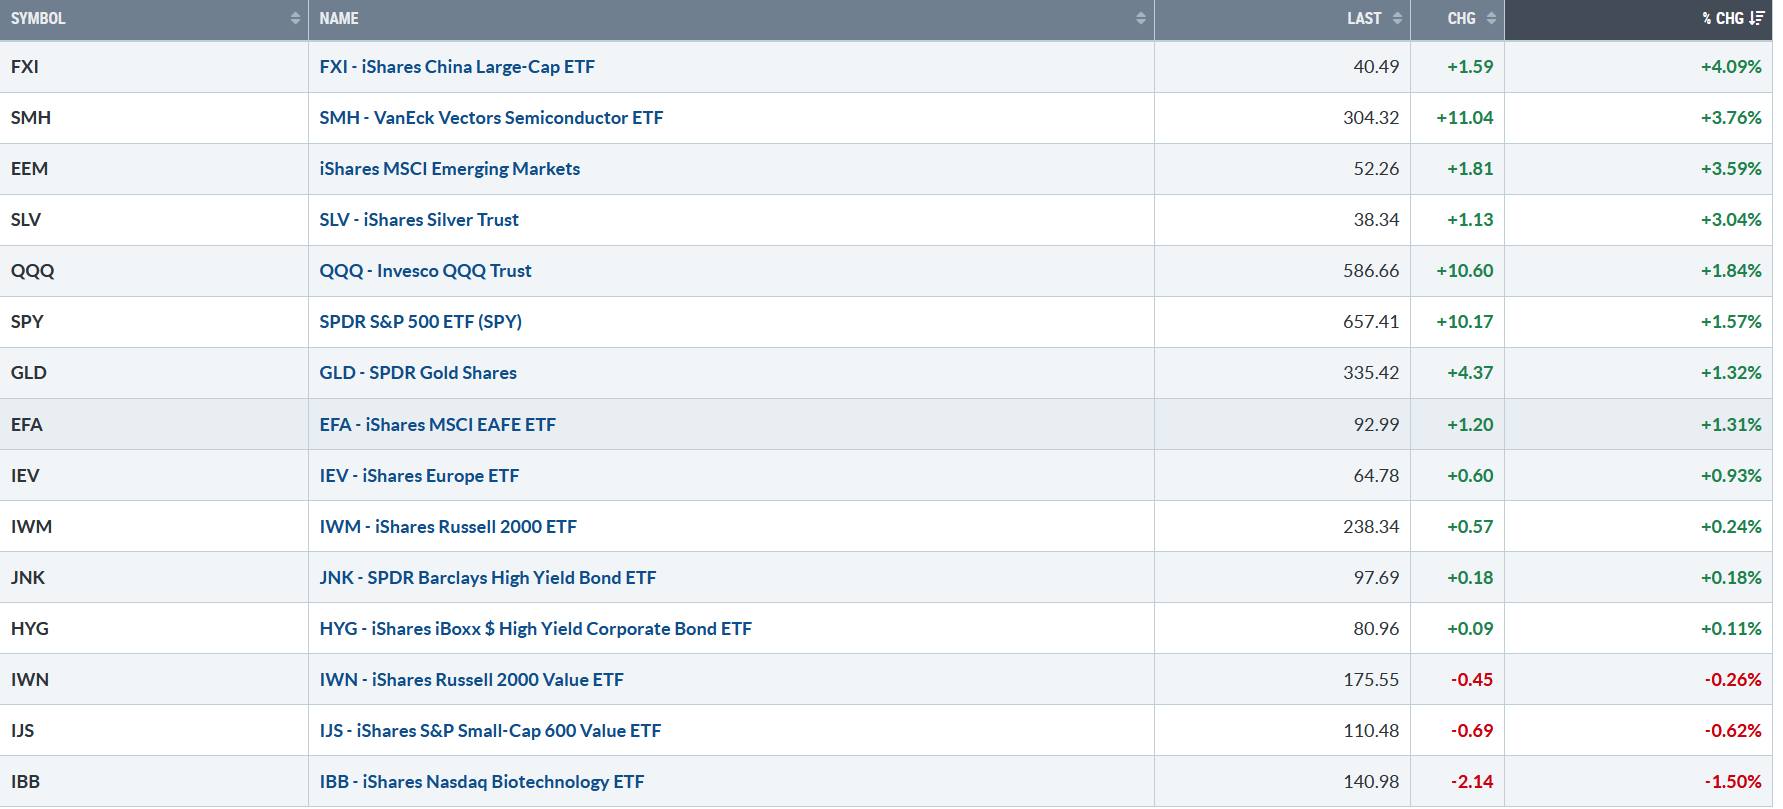
Figure 2: Bonnie’s ETFs Watch List Performance Summary 9/05/25 – 09/12/25
091225 Bonnie’s ETF Watch List
Source: Stockcharts.com
Semiconductors led, while Small Caps and Biotechnology lagged. International markets were firm, and Technology stocks rebounded.
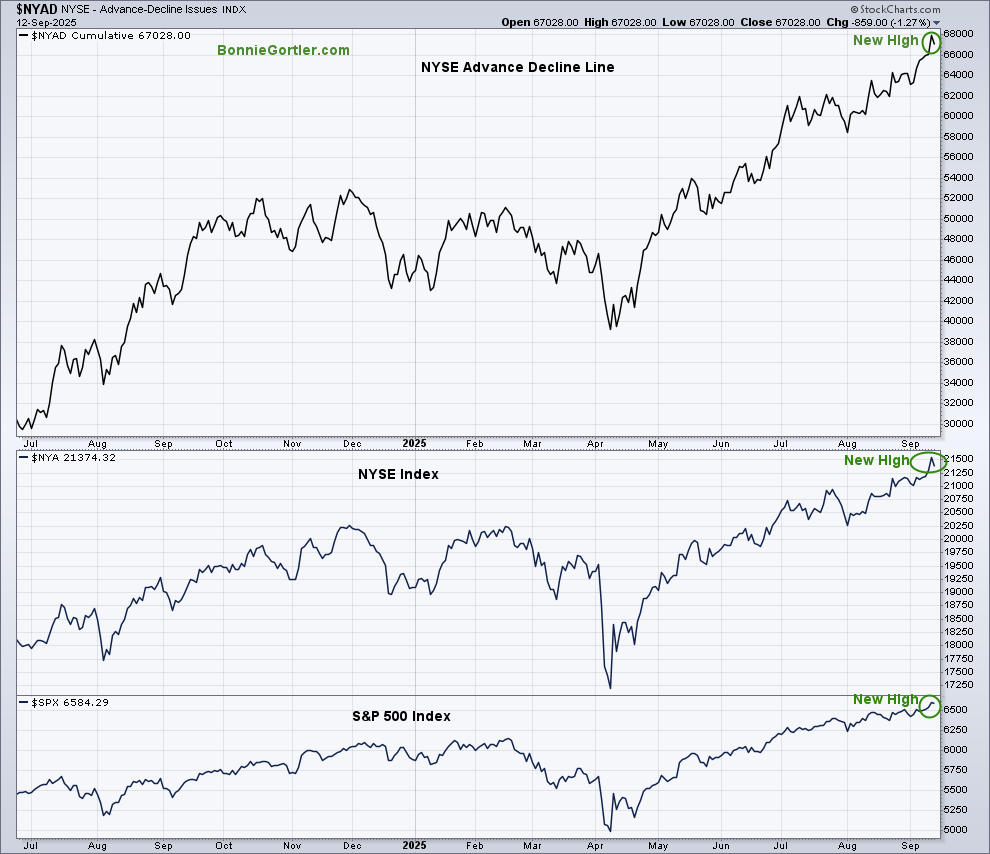
Figure 3: NYSE Advance Decline Line (Top), New York Index (NYSE) (Middle), and S&P 500 Index (Bottom)
$NYSE Advance Decline Line
Source: Stockcharts.com
The NYSE and S&P 500 made new highs. The NYSE Advance Decline line has confirmed the high. Historically, a final top rarely occurs when market breadth confirms.
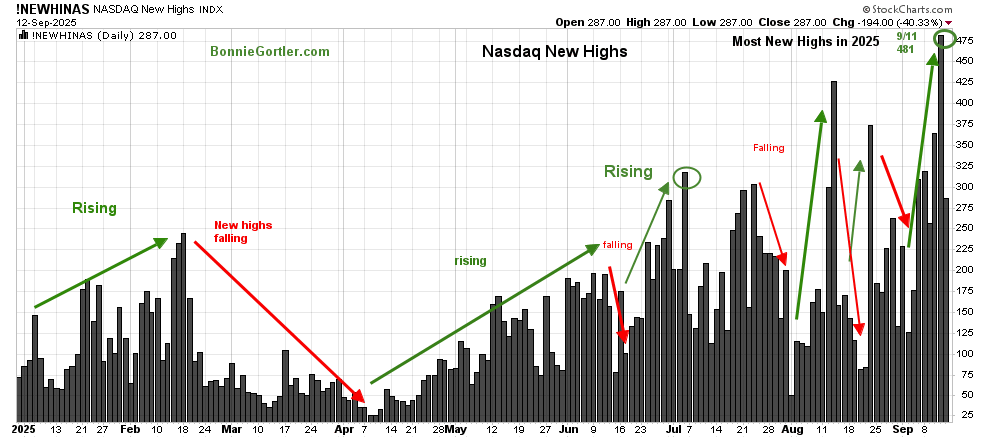
Figure 4: Nasdaq New Highs
091225 Nasdaq New Highs
Source: Stockcharts.com
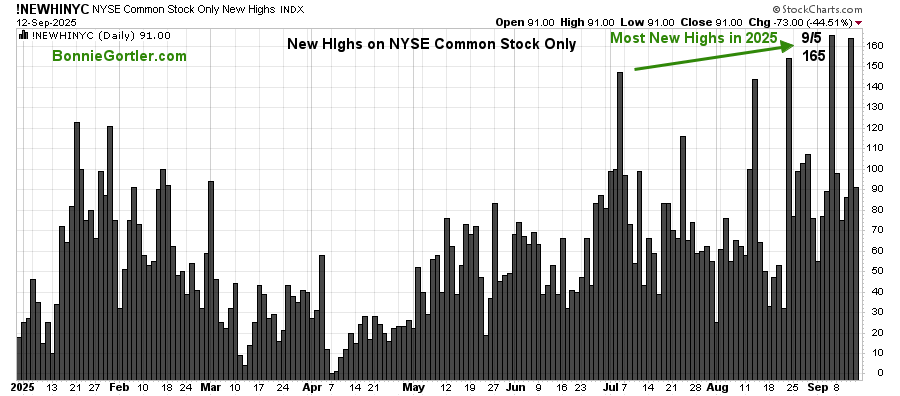
Figure 5: NYSE Common Stock Only New Highs
091225 NYSE New Highs
Source: Stockcharts.com
New York Stock Exchange Common Stock New Highs hit its best level of 2025 in September.
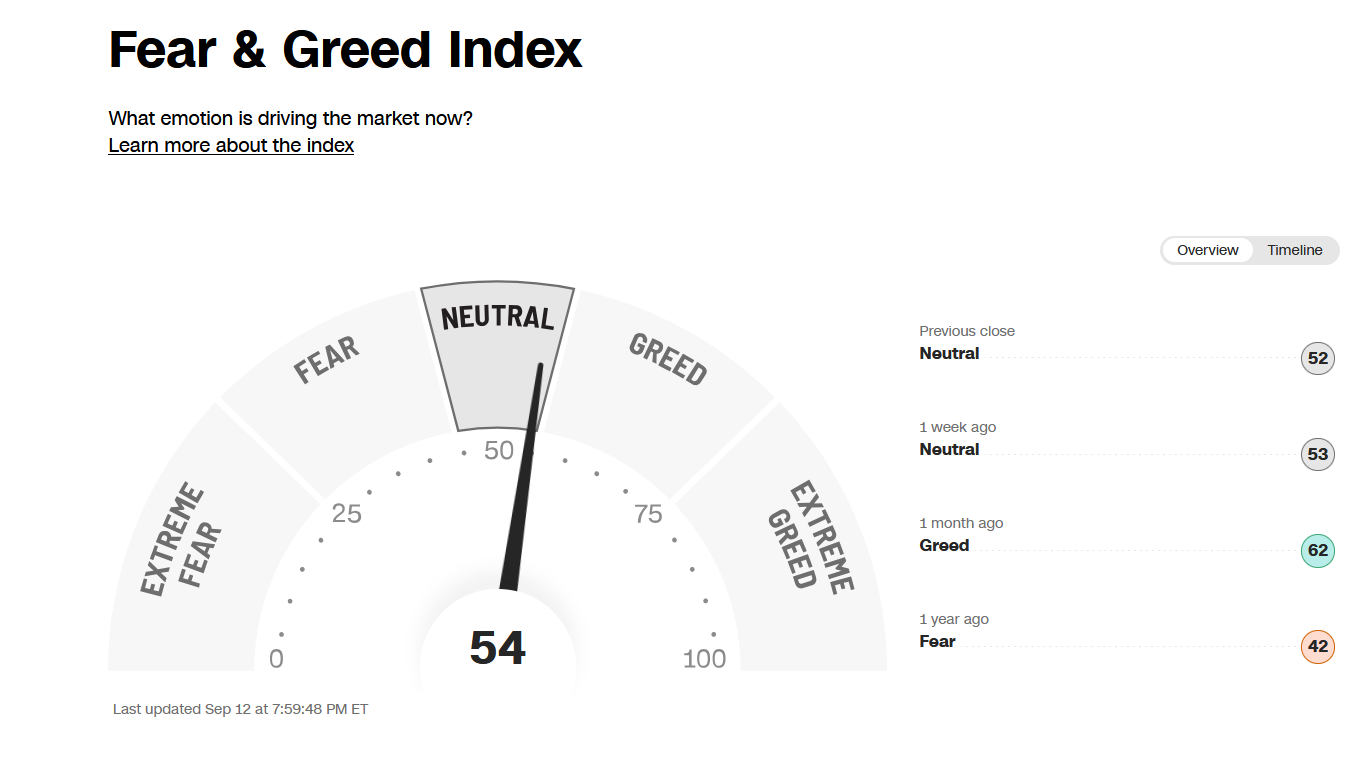
Figure 6: Fear & Greed Index
CNN Fear and Greed Index
Source. CNN.com
Investor sentiment, as measured by the Fear and Greed Index (a contrarian indicator), has fallen to 54, from a state of Greed two weeks ago to neutral, which I view as positive. If it rises to Extreme Greed, it would imply too much optimism and be considered negative.
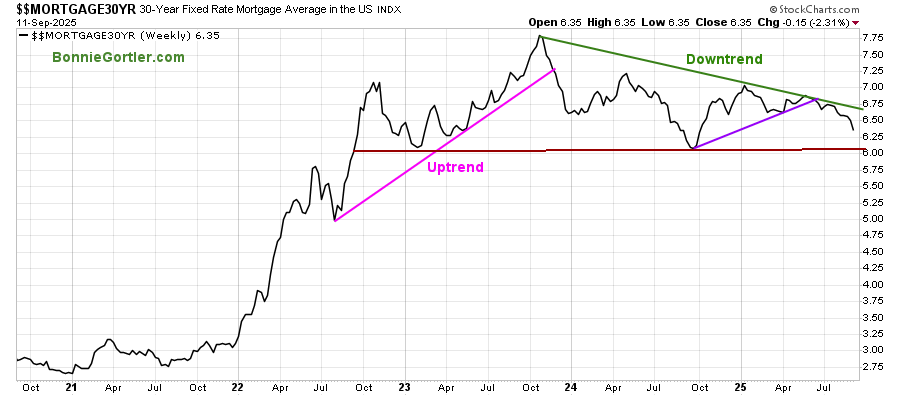
Figure 7:30-Year Fixed Rate Mortgage Average in the US
091225 $MORTGAGE 30YR
Source: Stockcharts.com
Mortgage rates are falling, their lowest since October 2024.
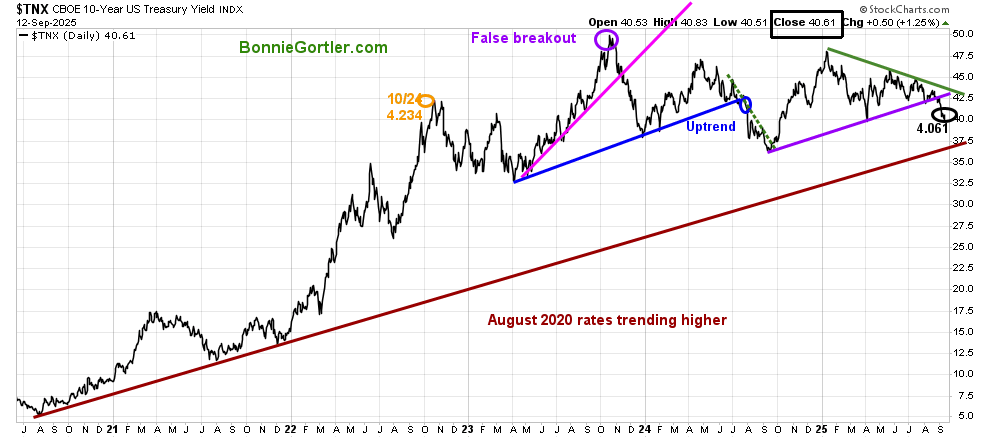
Figure 8: CBOE 10YR U.S. Treasury Yield Daily
091325 $TNX CBOE 10YR U.S. Treasury Yield Daily
Source: Stockcharts.com
The 10-year U.S. Treasury Yield continues to fall, closing at 4.061, breaking the August 2024 uptrend (purple line), supporting gains in U.S. equities.
Learn how to implement a powerful wealth-building mindset and charting strategies to help you grow your wealth in the comfort of your home in my eCourse Wealth Through Investing Made Simple. Learn more here.
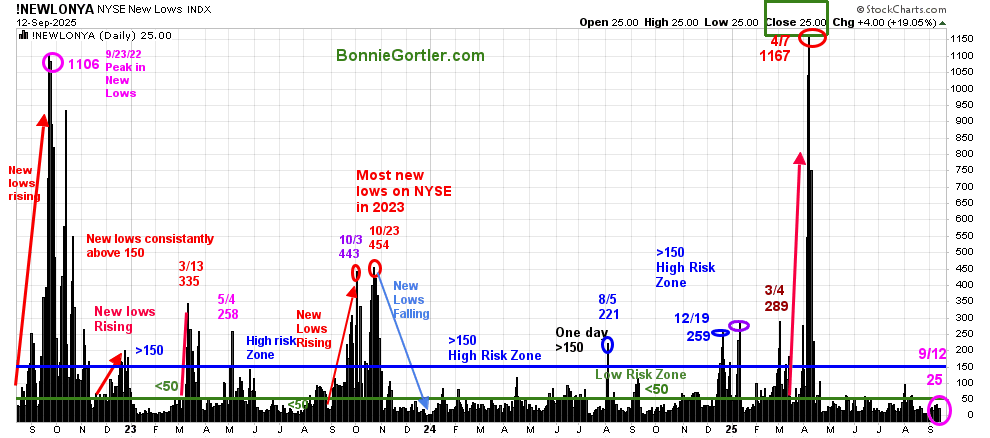
Figure 9: NYSE New Lows
091225 NYSE New Lows
Source: Stockcharts.com
New Lows On The NYSE peaked at 1167 on 4/7/25, then contracted sharply as the market bottomed in April.
New Lows closed Friday, 9/12, at 25, remaining in the very low-risk zone where prices tend to rise. It will remain positive in the short term if New Lows stay between 25 and 50. On the other hand, if new lows begin to increase and exceed 150, it would be a negative sign.
Learn more about the significance of New Lows in my book, Journey to Wealth, published on Amazon. For a chapter preview of Journey To Wealth, visit here.
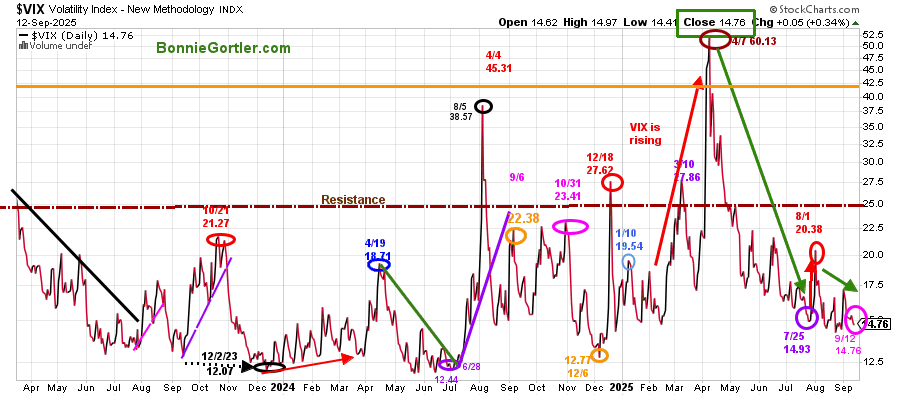
Figure 10: CBOE Volatility Index (VIX)
091225 VIX Daily
Source: Stockcharts.com
The CBOE Volatility Index (VIX), a measure of fear, peaked on April 7.
The VIX fell last week, closing at 14.76. A reading above 20.38 (8/1 VIX reading) would be the first sign that intraday volatility is more likely to increase. Above 25.00 would likely imply that the VIX will continue to rise and could jump between 32 and 40 quickly if there is any unexpected news.
Learn how to implement a powerful wealth-building mindset and charting strategies to help you grow your wealth in the comfort of your home in my eCourse Wealth Through Investing Made Simple. Learn more here.
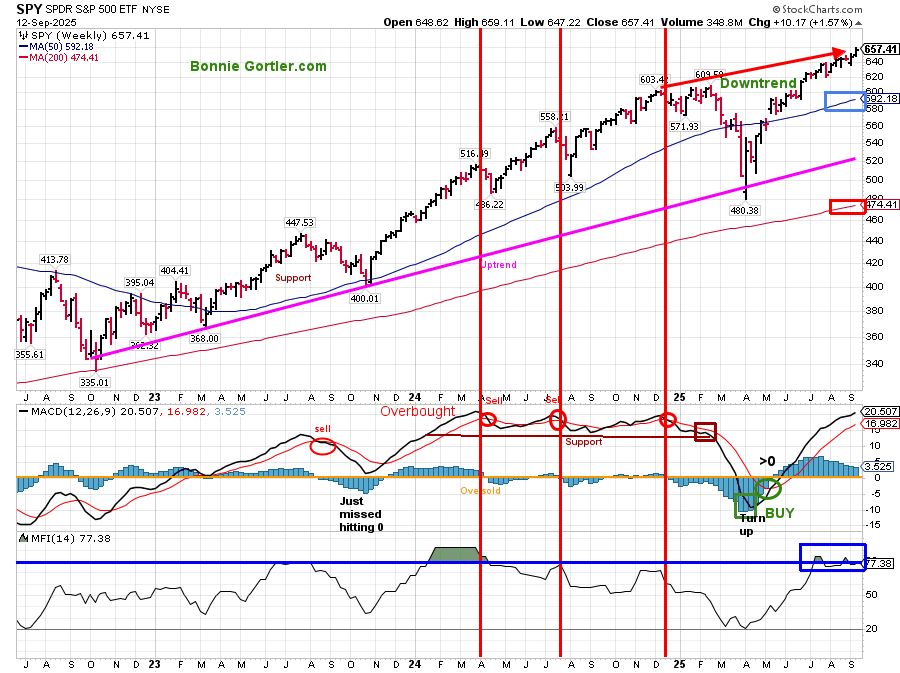
Figure 11: S&P 500 Weekly (SPY) and 12-26-9 MACD (Middle), and Money Flow (Bottom)
091225 SPY weekly
Source: Stockcharts.com
The S&P 500 (SPY) remains in an intermediate uptrend from October 2022. After hitting a low in April 2025, SPY consolidated its gains and then broke out of its channel, followed by SPY making new all-time highs.
The S&P 500 hit a new all-time high and is up over 35% from the April 2025 low. The largest Technology stocks account for more than 30% of the S&P 500. Nvidia, Apple, Alphabet, Microsoft, Amazon, and Meta. Because of the significant weighting, as these stocks perform over the next few weeks, the odds are that the S&P 500 will follow.
The MACD (middle chart) remains on a buy, above 0, and rising.
The MFI Index hit 80 and has not given up much ground as SPY continues to rise.
Summing Up:
After hitting the daily projection of 635.00, the SPY remains resilient, with only a minor retracement. The intermediate upside projection remains at 700.00. A weekly close below 647.00 would imply a pullback toward 633.00 and 622.00 and potentially more. For now, the bulls continue to get the benefit of the doubt until proven otherwise.
I invite you to join my Charting Facebook Group. Learn more about it here: Wealth Through Market Charts.
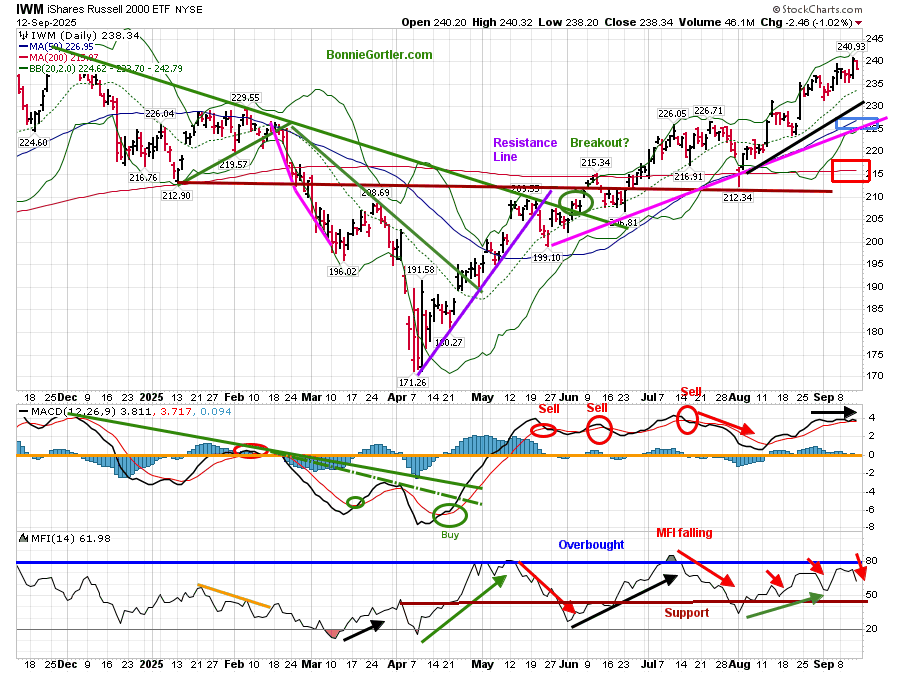
Figure 12: Daily iShares Russell 2000 (IWM) Price (Top),12-26-9 MACD (Middle), and Money Flow (Bottom)
091225 IWM Daily
Source: Stockcharts.com
The iShares Russell 2000 Index ETF (IWM) was up +0.24% for the week, trading in a tight range the last two weeks. IWM has demonstrated strength, with a clear uptrend in August (black line), and closed above both the 50-day moving average (blue rectangle) and the 200-day moving average (red rectangle).
Support is at 232.00, 220.00, 214.00, and 210.00. Resistance remains at 243.00.
The MACD (middle chart) remains on a sell signal, having just missed falling below 0 to generate a fresh buy signal. Momentum is moving sideways.
The Money Flow (lower chart) reached 80 earlier in May and July, indicating an overbought condition; however, it did not reach 80 in August, and has turned down. If interest rates continue to fall, IWM is likely to continue rising.
In case you missed my interview with Ryan Redfern, brought to you by the National Association of Active Investment Managers (NAAIM), you can view it here.
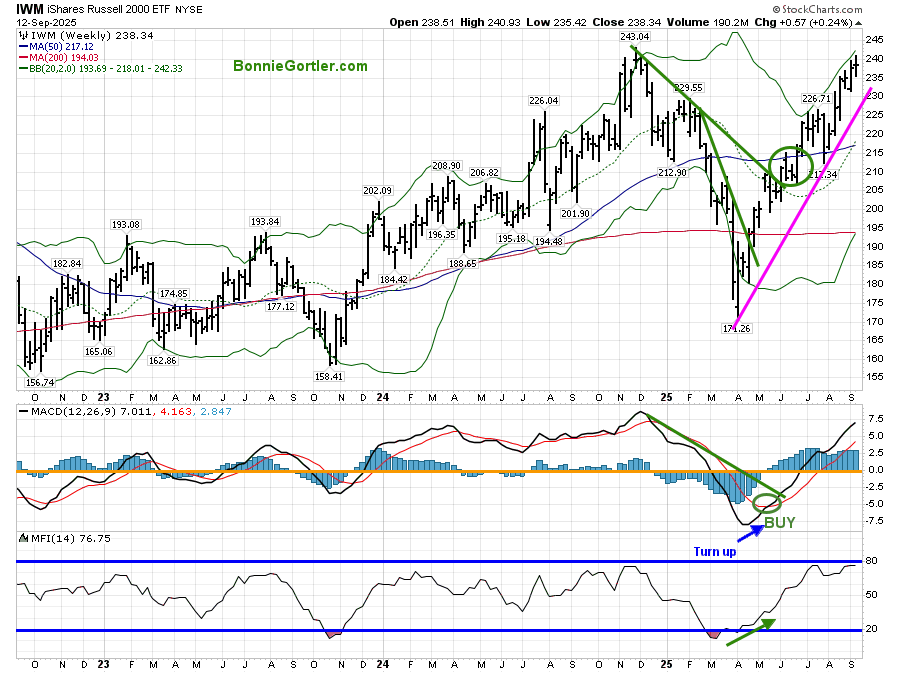
Figure 13: Weekly iShares Russell 2000 (IWM) Price (Top),12-26-9 MACD (Middle), and Money Flow (Bottom)
091225 IWM Weekly
Source: Stockcharts.com
The Russell 2000 (IWM) remains in an intermediate uptrend, now close to the high made in December 2024.
Support is at 232.00 and 220.00. If IWM closes for the week above 232.00, the bulls continue to get the benefit of the doubt.
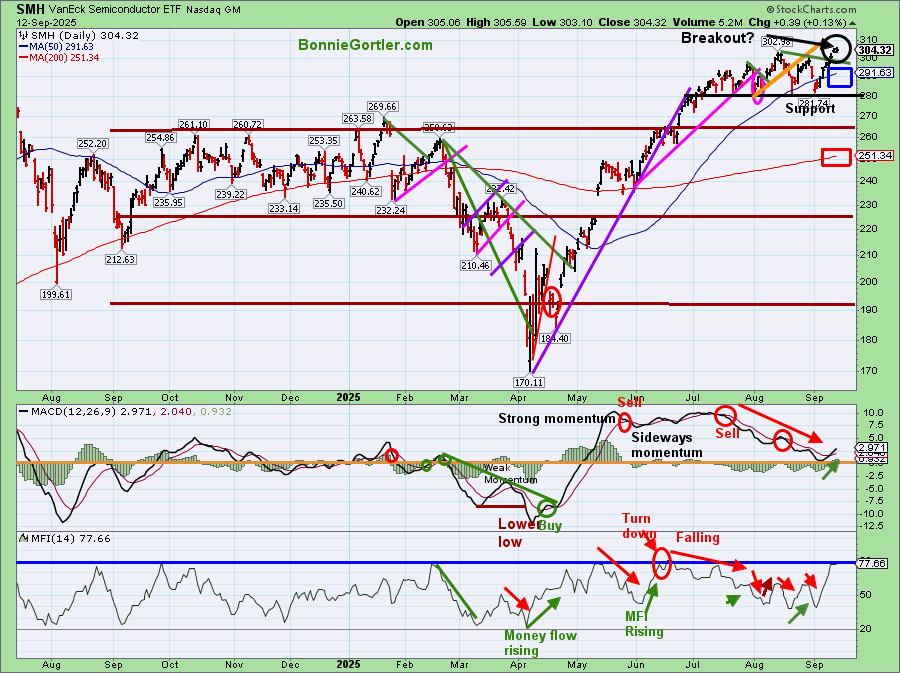
Figure 14: Daily Semiconductors (SMH) (Top), 12-26-9 MACD (Middle), and Money Flow (Bottom)
091225 SMH Daily
Source: Stockcharts.com
The top chart shows the Daily Semiconductor (SMH) ETF, which is concentrated mainly in US-based Mega-Cap Semiconductor companies. SMH can be highly volatile. SMH tends to be a leading indicator for the market when investors are willing to take on increased risk, and the opposite is true when the market is falling.
After a tight consolidation for several weeks, SMH rose by +3.76% last week, made a new high, after breaking the August downtrend (green line), indicating a potential breakout. SMH remains above both the rising 50-day MA (blue rectangle) and the 200-day MA (red rectangle).
Support is at 292.00, 282.00, 265.00, and 251.00. Resistance is at 305.00, and its upside objective of 315.00 remains. Two closes below 292.00 would negate the upside objective.
The MACD (middle chart) remains on a sell signal, barely missing a fresh buy signal resetting at 0. During strong moves, MACD sometimes will not fall below 0, and turn up.
The Money Flow (lower chart) had trended lower since June, closed at 77.66, and has turned up sharply.
If Semiconductors (SMH) continue to hold onto their recent gains and accelerate higher, it would have a short-term positive impact on the broad market. On the other hand, if SMH is weak and turns down and closes two days below 292.00, a pullback to 265.00 is possible. As long as 292.00 support holds, SMH is likely to move higher.
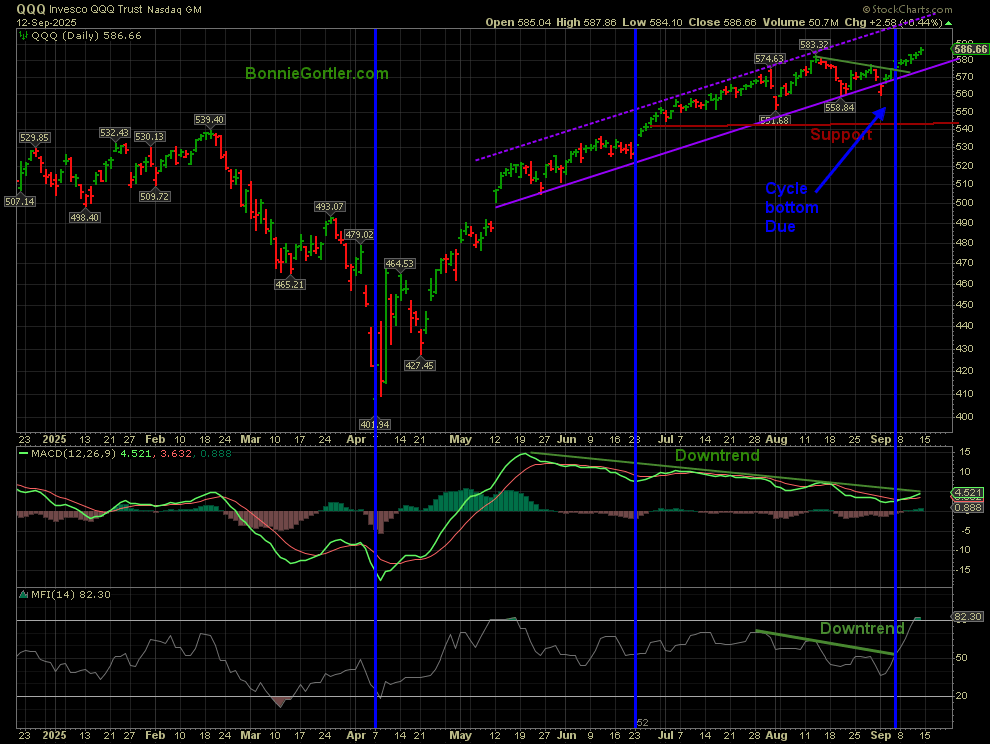
Figure 15: QQQ Daily Invesco QQQ Trust (QQQ) Price (Top), 12-26-9 MACD (Middle), and Money Flow (Bottom)
091225 QQQ Daily
Source: Stockcharts.com
The Chart shows the daily Invesco QQQ, an exchange-traded fund based on the Nasdaq 100 Index.
Nasdaq 100 (QQQ) remains in an uptrend (purple solid line), up +1.84% closing last week at 586.66, a new high. Next upside projection is 615.00. Two closes below 560.00 would negate the upside objective.
Support is at 577.00, 560.00, 551.00, and 540.00.
MACD (middle chart) remains on a sell signal above 0, in a downtrend with declining momentum, and has not fallen below 0, a sign of strength. A break of the downtrend would be a positive sign for higher prices in the near term.
Money Flow (bottom chart) is rising after being in a downtrend.
QQQ appears to have broken out of its trading range in line with the September cycle bottom mentioned in the 8/29 market update.
Summing Up:
All major averages showed gains last week and have made record highs, continuing the rally from the April 2025 low with only minor retracements. The intermediate trend remains up on the major averages. Market breadth is broadening, yields are falling, and New Lows on the New York Stock Exchange remain low, implying low risk, supporting the market. Its positive Technology and Semiconductors have resumed their rally. If support levels continue to hold, the bulls remain in control. Manage your risk, and your wealth will grow.
If you would like to get to know each other better, schedule your Free 30-minute Wealth Building Strategy Session today. Register Here.


Create more wealth in your life
with these simple strategies.
As an added bonus you will also
receive BG’s Updates and Ezine

Discover how to quickly create more well-being in your life with these simple strategies.
As an added bonus you will also
receive BG’s Updates and Ezine

As an added bonus you will receive BG’s Updates and Ezine

All work listed on BonnieGortler.com is licensed under a Creative Commons Attribution - Noncommercial - No Derivative Works 3.0 Unported License.
