

Bonnie’s Market Update 4/12/24
04/14/2024
January was a strong month for stocks. The Dow Industrials and the S&P 500 had their best January since the1990’s. However, the indices have turned lower to end the month. Investors appear to have stopped buying dips and have turned a bit more cautious. Investor optimism remains high, a contrary indicator. Intra-day volatility has picked up. It looks like the days of half of one percent intraday ranges on the market indices now are a distant memory. I anticipate the daily trading ranges over the next several months to widen.
A short-term correction looms in the future. There has been some short-term weakness in the tape, along with a loss of momentum in some technical indicators. It was somewhat disturbing there were readings this week that showed a clear deterioration in the new 52-week highs and also an expansion of the new 52-week lows on the New York Stock Exchange Index.
On the contrary, a sign for the rally to resume would be for the opposite to take place: the new highs to expand and the new lows to contract to below 50. The intermediate and long-term price trends on the major averages remain favorable. Our U.S. equity timing model remains on its October 31st buy, a condition where historically risk has been below average and returns above average.
It’s too early to say the rally has come to an end.
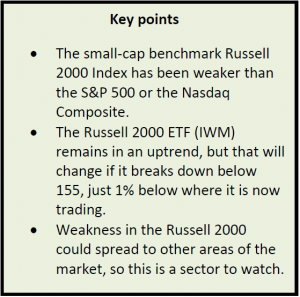
Keep a Close Eye on the Russell 2000 (IWM)
What ETF to watch now for signs of a correction in the near term? Answer: The Russell 2000
Figure: The iShares Russell 2000 Index (IWM) Weekly Price Channel, Upside Objective Channel, and 19-26-9 Week MACD
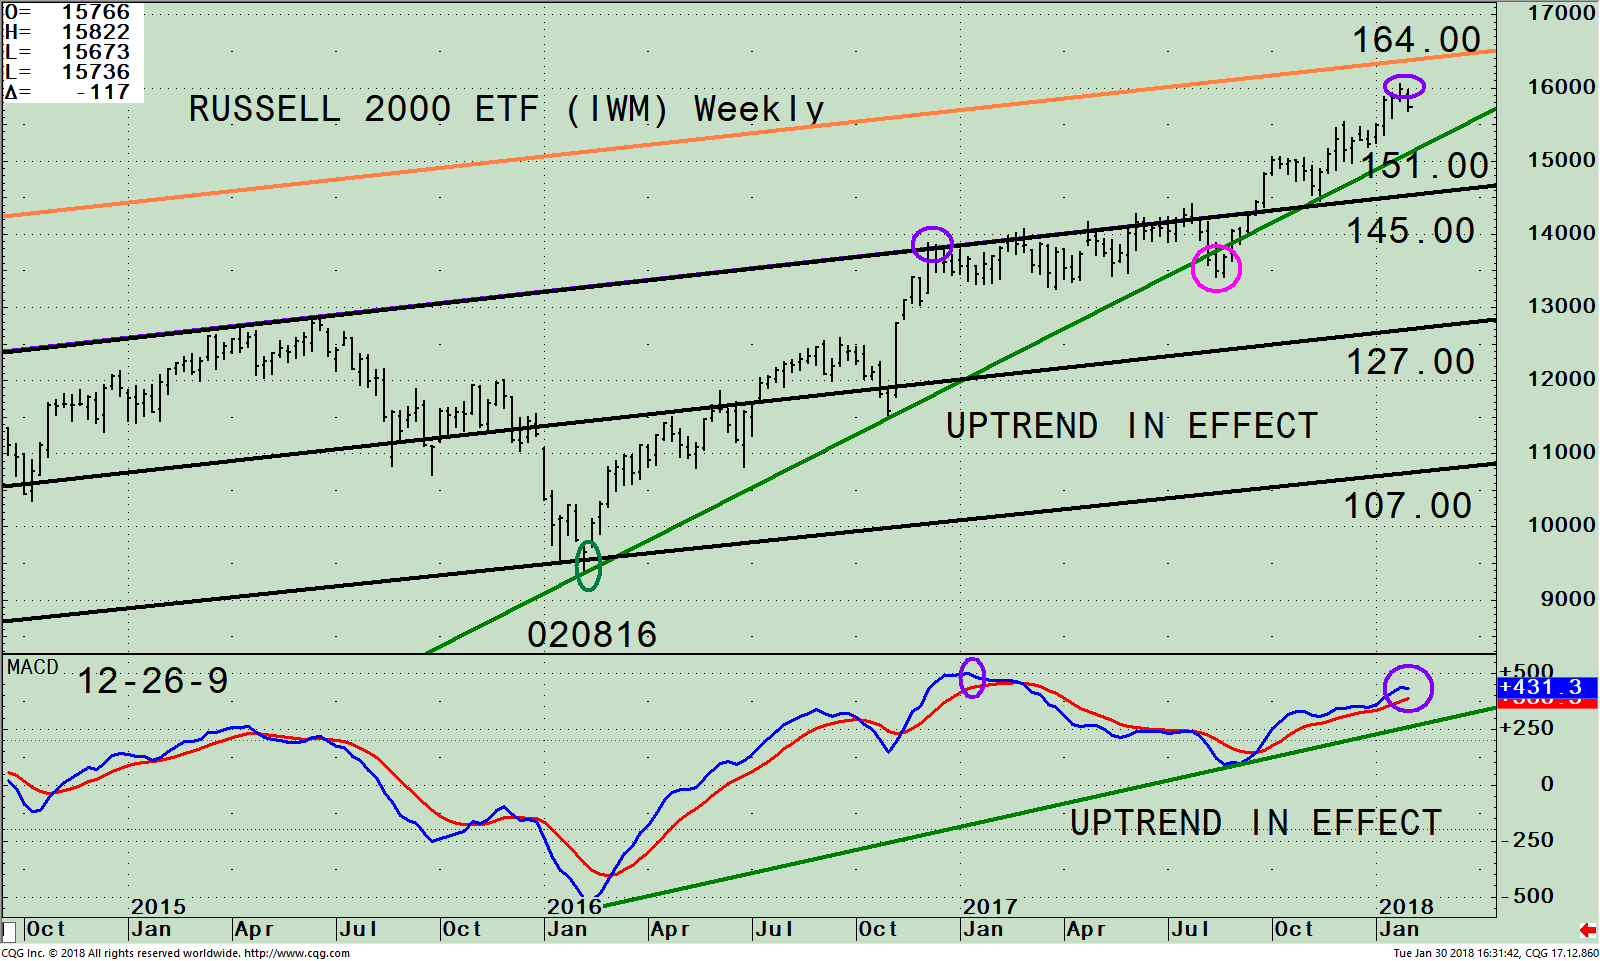
The iShares Russell 2000 Index ETF (IWM) is made up of companies with a market capitalization of between $300 million and $2 billion. The Russell 2000 (IWM) portfolio top sector holdings as of 01/30/18, is Financials 17.71%, Information Technology 16.77%, Health Care 16.16%, Industrials 15.22% and Consumer Discretionary 12.43%. The top sectors in the IWM all started the year strong.
The top portion of the chart shows the weekly IWM made a new record high of 160.62 on 1/24/18. The IWM has been in an uptrend (green line) since February 2016, with only one violation that lasted for three weeks in August 2017 (pink circle). The IWM appears to have stalled, before completing its latest upper channel objective at 164.00 (purple circle), unlike the S&P 500 and the Nasdaq, which made higher objectives, not a good sign. The IWM has been weaker than the other indices as of late.
Over the next several days, watch if the IWM stays above 151.00 keeping the uptrend intact. As of this writing the IWM is 156.69. In addition, if the IWM lags the S&P 500 (SPY), this would be another sign implying further weakness for the IWM that could potentially spill over to other sectors of the market in the near term. On the other hand, it would be bullish if the Russell 2000 (IWM) index were to stop falling and take out the IWM high at 160.62, and penetrate 164.00 giving higher objectives.
The lower portion of the chart is MACD, a technical indicator that measures momentum. MACD peaked in January 2017, (left purple circle) confirming the price high. The IWM stayed in a trading range as MACD moved lower until September when MACD turned up. The rise in MACD has slowed since the initial thrust. MACD has turned down, (right purple circle) forming a potential negative divergence from last January. More strength in the IWM is needed in the near term for MACD to make a new momentum high.
Figure: The iShares Russell 2000 Index (IWM) Daily Price Channel, and 12-26-9 Week MACD
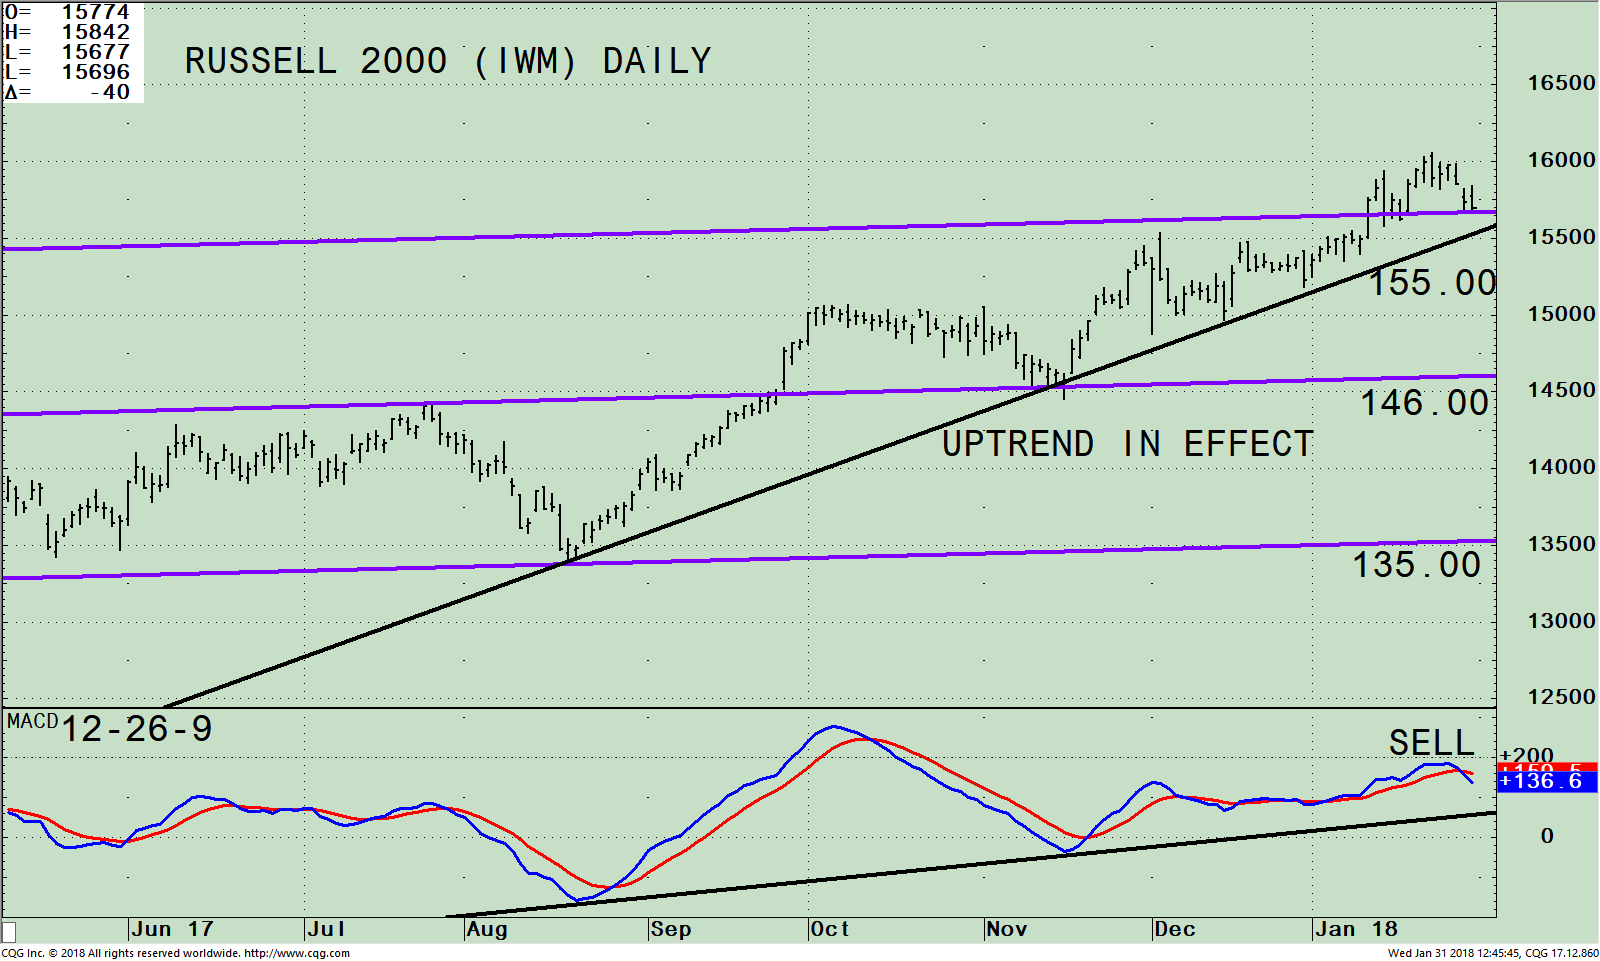
The top portion of the chart shows the Daily iShares Russell 2000 Index ETF (IWM).
The IWM has been in a daily uptrend since August 2017. The short-term trend is in jeopardy to turn negative if the present decline continues. A close below 155.00 for two days will shift the daily trend from up to down suggesting caution near term.
In the lower portion of the chart MACD has given a fresh sell signal showing momentum is clearly weakening. If the IWM continues to fall, the uptrend will also be broken, suggesting more selling is possible sooner rather than later.
Summing Up:
January has been a stellar month for the market. In the past few trading sessions volatility has picked up and the tape action has become more unfavorable. Short and intermediate trend lines are intact for now. However, further weakness would break the uptrends suggesting a short-term correction is possible. I am watching very carefully the action in the Russell 2000 as it is one of the few indices that didn’t reach its upper channel objective and now has started to turn down. Hold off on buying into the dip to see if the IWM remains above 155.00 on this pull back which would break the daily uptrend. A break below 151.00 on the IWM would violate the intermediate trend. For now, continue to give the benefit of the doubt to the bulls. However, if the uptrends are violated more caution is recommended.
I would love to hear from you. Please call me at 516-829-6444 or email at bgortler@signalert.com to share your thoughts or ask me any questions you might have.
Sign up for a FREE 3 issue trial of
SYSTEMS AND FORECASTS Click HERE
******Article published by Bonnie Gortler in Systems and Forecasts February 1, 2018
Disclaimer: Although the information is made with a sincere effort for accuracy, it is not guaranteed that the information provided is a statement of fact. Nor can we guarantee the results of following any of the recommendations made herein. Readers are encouraged to meet with their own advisors to consider the suitability of investments for their own particular situations and for determination of their own risk levels. Past performance does not guarantee any future results.


Create more wealth in your life
with these simple strategies.
As an added bonus you will also
receive BG’s Updates and Ezine

Discover how to quickly create more well-being in your life with these simple strategies.
As an added bonus you will also
receive BG’s Updates and Ezine

As an added bonus you will receive BG’s Updates and Ezine

All work listed on BonnieGortler.com is licensed under a Creative Commons Attribution - Noncommercial - No Derivative Works 3.0 Unported License.
