

10 Simple Tips for Financial Well-Being
07/01/2026
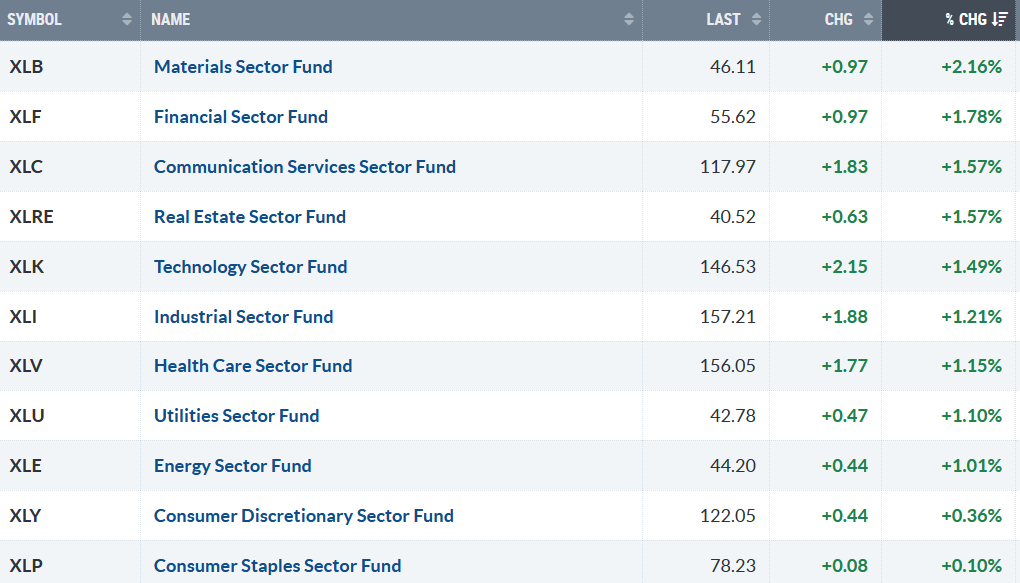
Further gains occurred in the holiday-shortened week. All eleven S&P SPDR sectors were higher. Materials (XLB) and Financials (XLF) were the strongest sectors, while Consumer Discretionary (XLY) and Consumer Staples (XLP) were the weakest. The SPDR S&P 500 ETF Trust (SPY) rose +1.43%.
S&P SPDR Sector ETFs Performance Summary 12/12/25 -12/26/25
122625 SPDR Sectors
Source: Stockcharts.com
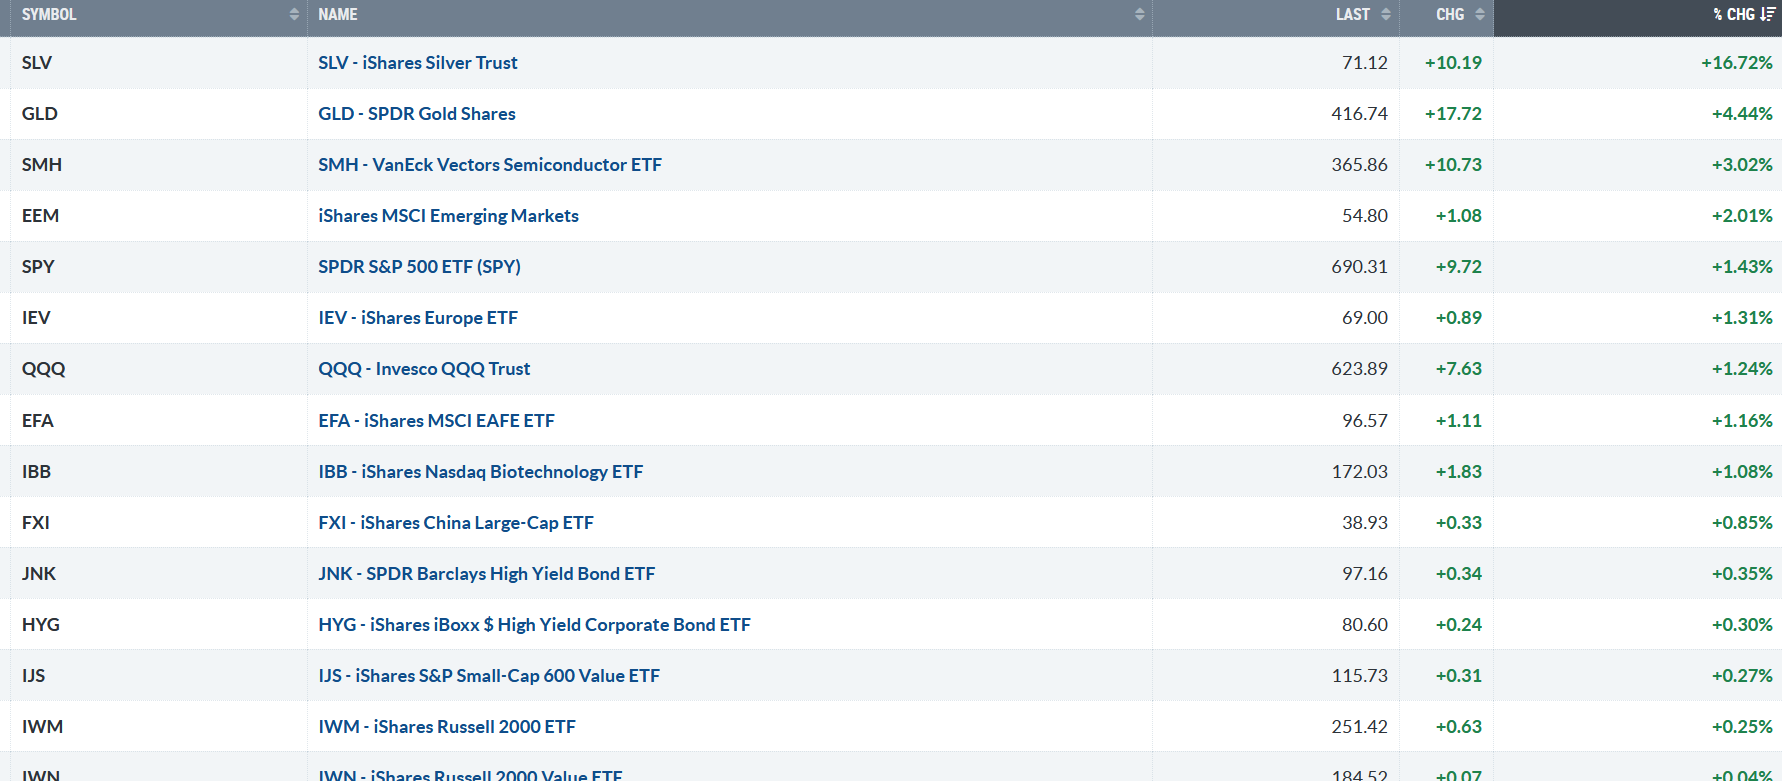
Figure 2: Bonnie’s ETFs Watch List Performance Summary 12/12/25 -12/26/25
122625 Bonnie’s ETF Watch List
Source: Stockcharts.com
Silver, the talk of the week, rose sharply. Gold and Semiconductors were strong, while Small Caps (both Growth and Value) lagged last week.
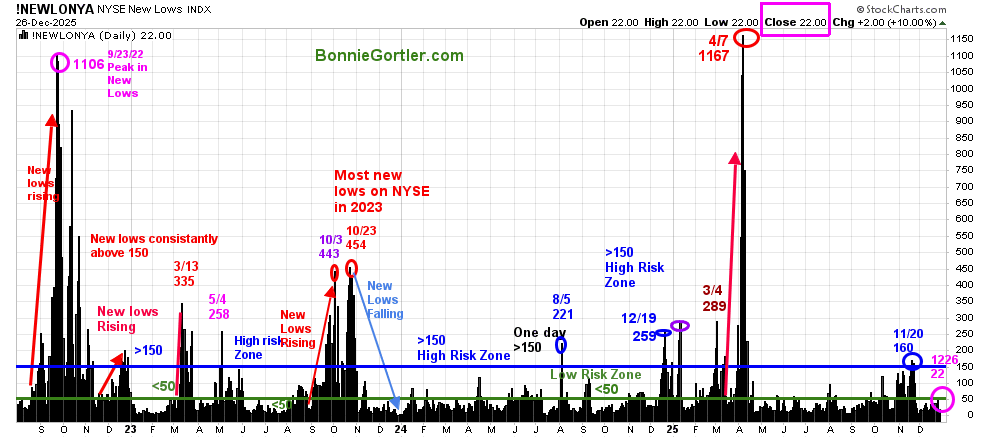
Figure 3: NYSE New Lows
122625 New Lows NYSE
Source: Stockcharts.com
New Lows closed Friday, 12/26, at 22, in the very low-risk zone, where prices tend to rise. It will remain positive in the short term if New Lows stay between 25 and 50. On the other hand, if new lows begin to increase and exceed 150, it would be short-term negative with more volatility and increased risk expected.
Learn more about the significance of New Lows in my book, Journey to Wealth, published on Amazon. For a chapter preview of Journey To Wealth, visit here.
If you want to talk about charts, email me at Bonnie@BonnieGortler.com
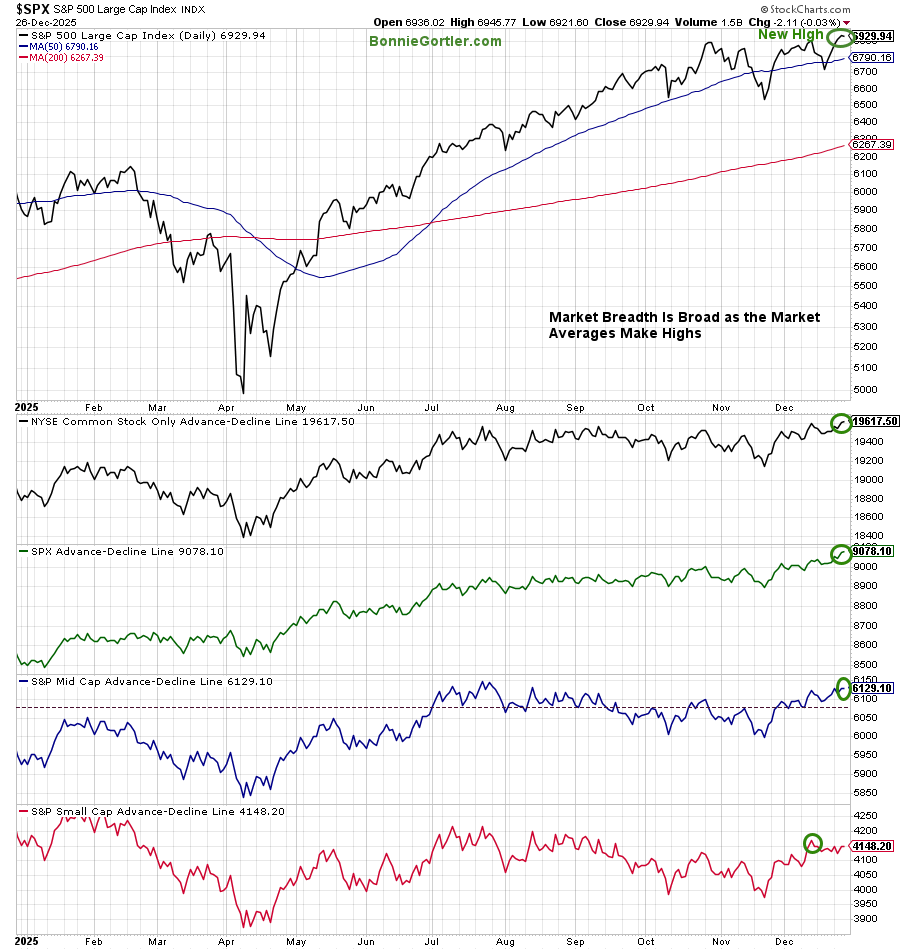
Figure 4: S&P 500 Price and NYSE, SPX, Mid and Small Cap AD Lines
122625 Price NYSE, SPX, Mid and Small Cap AD Lines
Source: Stockcharts.com
Market breadth is broad as the market averages make highs.
The New highs in the Advances-Declines line imply that any decline is unlikely to be the final peak.
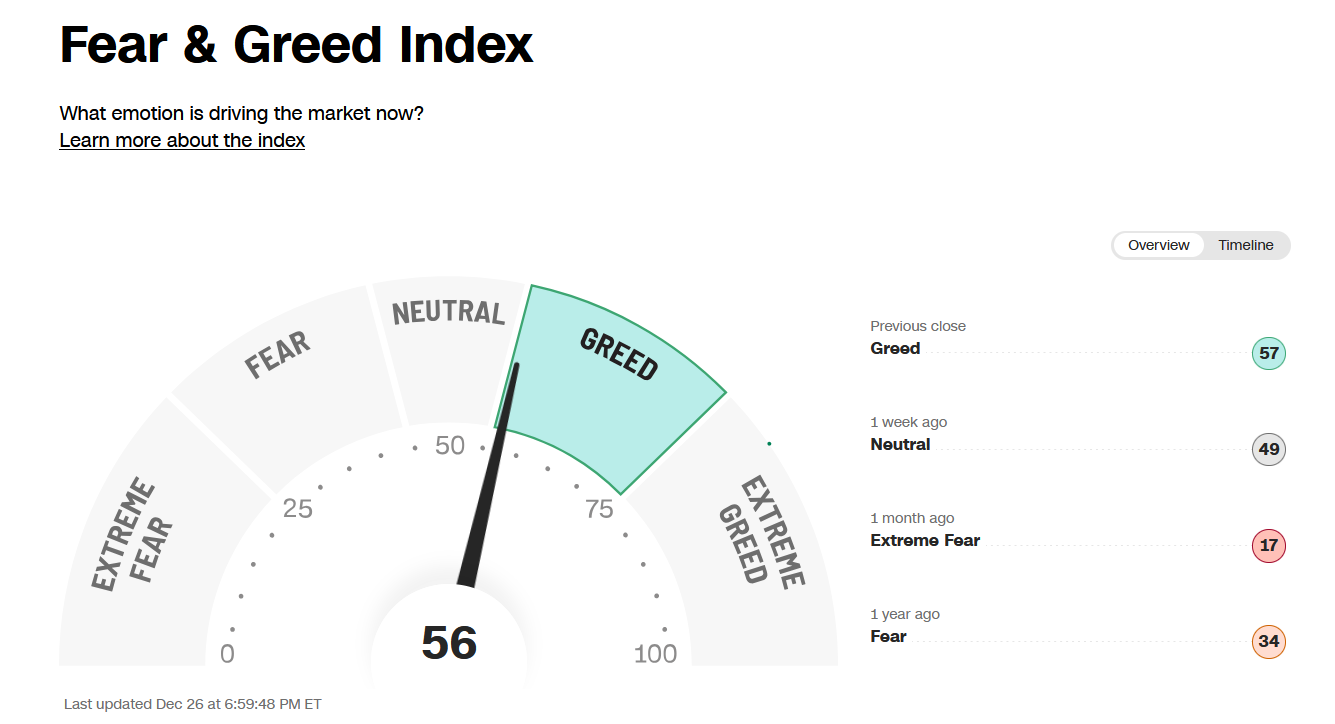
Figure 5: Fear & Greed Index
122625 Fear and Greed Index
Source. CNN.com
Investor sentiment, as measured by the Fear and Greed Index (a contrarian indicator), closed at 56, now indicating Greed. As we enter 2026, if sentiment hits Extreme Greed, it will increase risk.
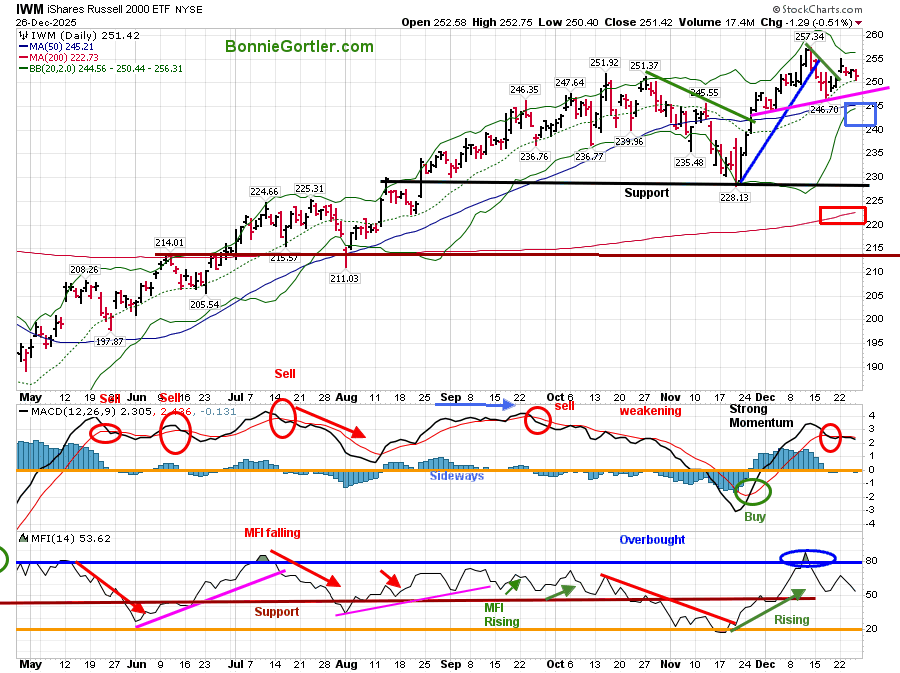
Figure 6: Daily iShares Russell 2000 (IWM) Price (Top),12-26-9 MACD (Middle), and Money Flow (Bottom)
122625 IWM Daily
Source: Stockcharts.com
If Small Caps rise, it’s likely to fuel the broad market higher.
Learn charting strategies to help you grow your wealth in the comfort of your home with my eCourse, Wealth Through Investing Made Simple.
New Module 7: Trading Alerts That Build Confidence and Reduce Risk. Learn more here.
You can explore more of Bonnie’s market HERE.
If you want to talk charts, contact me at Bonnie@BonnieGortler.com
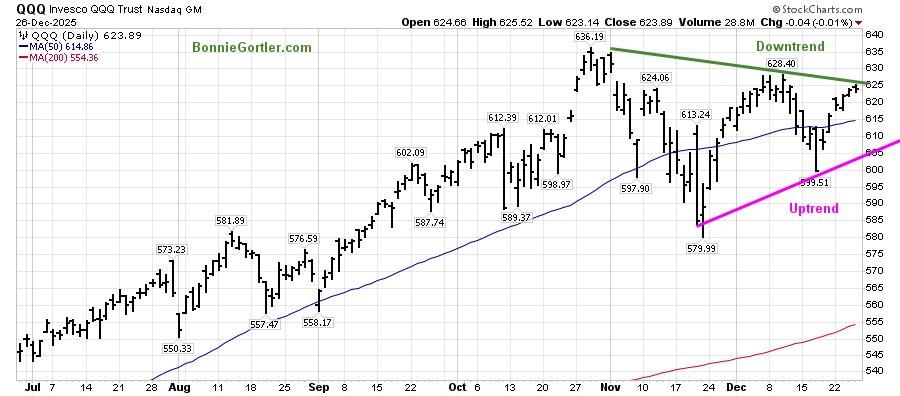
Figure 7: QQQ Daily Invesco QQQ Trust (QQQ) Price
122625 QQQ Daily
The chart shows the Invesco (QQQ), an exchange-traded fund based on the Nasdaq 100 Index.
Technology has fueled the rally in 2025. Two closes above 628.40 will break the November downtrend in the Nasdaq 100 (QQQ), implying further gains in Technology stocks. On the other hand, two closes below 599.00 would indicate weakness in Technology stocks,
Summing Up:
All major averages were higher last week. The intermediate S&P 500 (SPY) upside projection remains at 700.00. Market breadth remains bullish and encouraging. This time of year is historically favorable. Support levels remain intact. Until support breaks, the bulls continue to get the benefit of the doubt. Manage your risk, and your wealth will grow.
 If you would like to get to know each other better, schedule your Free 30-minute Wealth Building Strategy Session today. Register Here.


Create more wealth in your life
with these simple strategies.
As an added bonus you will also
receive BG’s Updates and Ezine

Discover how to quickly create more well-being in your life with these simple strategies.
As an added bonus you will also
receive BG’s Updates and Ezine

As an added bonus you will receive BG’s Updates and Ezine

All work listed on BonnieGortler.com is licensed under a Creative Commons Attribution - Noncommercial - No Derivative Works 3.0 Unported License.


Free Report:
Grow and Sustain Your Wealth
Discover how to grow your money with these easy, simple steps.

