

Bonnie’s Market Update 5/15/26
05/17/2026
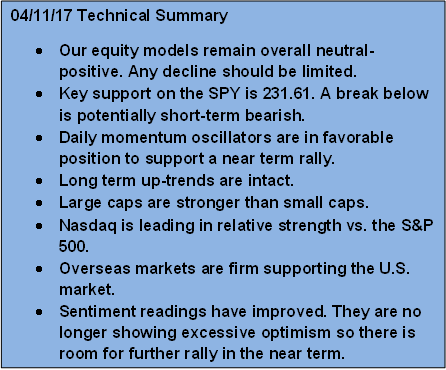 During the past five weeks the stock market held its own, holding key support levels and avoiding any major losses. The S&P 500 remains near its highs, holding above key support as it has been consolidating within a narrow trading range. Nonetheless, bullish momentum slowed down in US equities during March. This is normal considering the huge upside thrust that occurred in January and February. The Nasdaq Composite continues to lead the S&P 500 in relative strength, a bullish sign.
Fewer stocks have made new highs during the advance because of the decrease in momentum. Financials and small caps were the leaders of the advance in the aftermath of the election. However, they have weakened considerably in the past month. Continue to give the benefit of the doubt to the bulls. On any weakness look for buying opportunities with the expectation of another rally attempt taking place sooner rather than later.
Buying Opportunity in Energy
One of the worst performing sectors in the first quarter was energy. But that might be about to change. The short and intermediate term has shifted from down to up. This could present an opportunity to buy low rather than chasing a rally.
Energy Select Sector SPDR ETF XLE Daily (TOP) and MACD 12-26-9 (Bottom
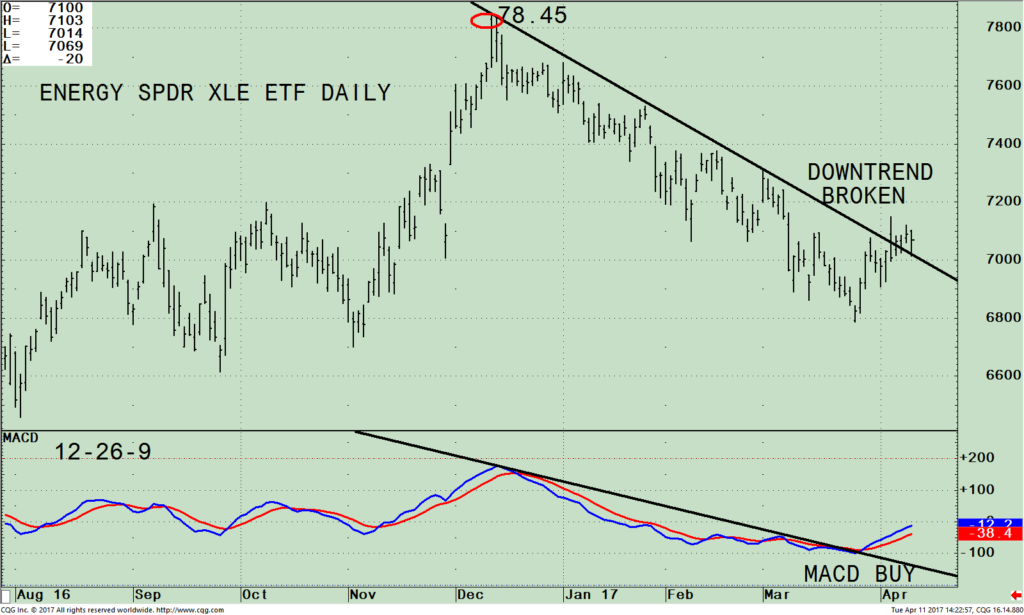
The top chart is the Energy Select Sector SPDR (XLE) that tracks the Energy Sector Index, investing in common stocks in the Oil, Natural Gas, and Oil & Gas Drilling & Exploration industries. As of 04/7/17 its top 4 holdings are Exxon Mobil Corp (XOM) 23.11%, Chevron (CVX) 15.47%, Schlumberger Ltd (SLB) 8.23%, and Conoco Phillips (CON) 4.66%, totaling 51.47%. Be aware the XLE is an aggressive investment vehicle. The XLE 90-day volatility is 1.72 compared to the S&P 500 of 1.00.
The XLE peaked on 12/16/2016 at 78.45 and steadily declined through the first quarter of 2017, making lower highs and lower lows forming a down trend. The XLE bottomed 03/27/17 at 67.86. The downtrend was broken on 04/05/17. However, the XLE reversed to close near its lows suggesting the breakout could be false. There was no follow through to the downside so investors stepped in to buy. On 04/10/17 the XLE closed clearly above the downtrend line and is in the process of testing the breakout. Short term support is at 70.00, resistance is at 73.00.
The bottom half of the chart shows the 12-26-9 MACD, a technical indicator that shows you changes in direction, momentum, and strength of the stock’s price. MACD generated a buy in late March from an oversold condition below 0, is gaining momentum, and has broken its downtrend from its December 2016 peak after moving sideways since February. This suggests the downside risk should be contained in the near term.
Energy Select Sector SPDR ETF XLE Weekly (TOP) and MACD 12-26-9 (Bottom)
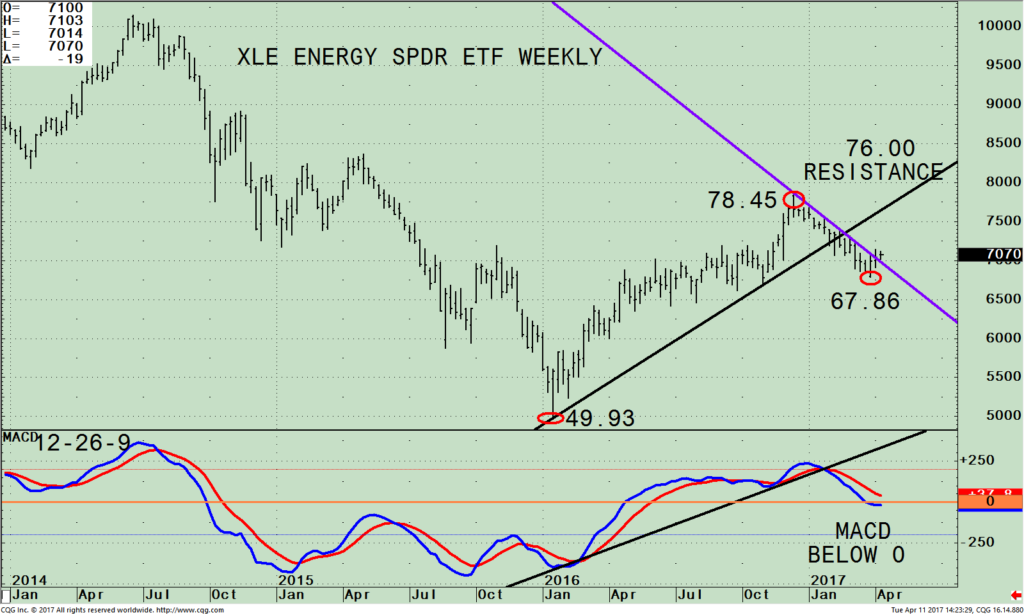
The top portion shows the weekly SPDR S&P Energy Select SPDR ETF (XLE). The XLE was trending higher for 2016, peaking at 78.45. This year the XLE has been the opposite, out of favor by investors, much weaker than other sectors to start the year. The XLE this past week broke the weekly downtrend (purple line), shifting the intermediate trend to up. Resistance is at 76.00. A break below the recent low at 67.86 would negate my near term bullish outlook and increase the odds of a further decline.
The bottom half of the chart is MACD (12, 26, 9) a technical indicator that measures momentum. MACD gave a sell in January. However, MACD has now reset, falling to below 0. Downside momentum has subsided. If the XLE turns up now, MACD would generate a fresh buy signal supporting the bullish case the XLE is ready to resume its bullish trend from 2016.
In Sum:
The market continues to be resilient. The S&P 500 is holding above key support consolidating within a narrow trading range. Another rally attempt toward new highs is possible sooner rather than later. Continue to give the benefit of the doubt to the bulls on any weakness looking for buying opportunities. A buying opportunity has developed in the energy sector (XLE). The short and intermediate trend has shifted from down to up. As long as the XLE remains above 67.86 you can anticipate higher prices in the near term and risk to be limited.
I would love to hear from you. Please call me at 516-829-6444 or email at bgortler@signalert.com to share your thoughts or ask me any questions you might have.
If you like this article, then you will love this!
Click here for a free report:
Top 10 Investing Tips To More Wealth
*******Article published by Bonnie Gortler in Systems and Forecasts April 13, 2017
Discover the right wealth building attitude…

Download a Free chapter of my book
Journey To Wealth
Disclaimer: Although the information is made with a sincere effort for accuracy, it is not guaranteed that the information provided is a statement of fact. Nor can we guarantee the results of following any of the recommendations made herein. Readers are encouraged to meet with their own advisors to consider the suitability of investments for their own particular situations and for determination of their own risk levels. Past performance does not guarantee any future results.


Create more wealth in your life
with these simple strategies.
As an added bonus you will also
receive BG’s Updates and Ezine

Discover how to quickly create more well-being in your life with these simple strategies.
As an added bonus you will also
receive BG’s Updates and Ezine

As an added bonus you will receive BG’s Updates and Ezine

All work listed on BonnieGortler.com is licensed under a Creative Commons Attribution - Noncommercial - No Derivative Works 3.0 Unported License.


Free Report:
Grow and Sustain Your Wealth
Discover how to grow your money with these easy, simple steps.

