

10 Simple Tips for Financial Well-Being
07/01/2026
During November the major averages tried to recover from big losses in October which created a short-term oversold condition. Each time there was an intraday rally the rise gained no momentum as sellers outnumbered the buyers. Large up and down swings occurred daily as the selling intensified. The major averages tried to form a bottom, re-testing the October lows but it remains to be seen if the retest is complete or if another test of the lows will occur. Some averages have made a lower low, while other averages the low has not been violated. There is hope the decline will end soon.
A research study (by Glenn Gortler, Head of Research), from our database during 12/31/17 – 11/18/18 of 4,238 stocks >= $5.00, shows that 70% of stocks have already had a 20% or more drawdown in 2018, much more than the major averages themselves. My perception is a bottom could be close at hand because many stocks already are weaker than the market averages and are in position for a rebound. Even in the worst of markets opportunities do occur.
A recovery in the averages now would be from a deeply oversold condition on both short and intermediate term momentum patterns, which are at levels that have not been seen since 2016. Positive divergences are beginning to occur. This could take some time. However, what is needed now is prices to stabilize and turn up. It would be positive if new 52-week lows get under 50, and an expansion in upside volume more than downside volume on the New York Stock Exchange and the Nasdaq Index would occur. Keep an eye if the technology stocks (QQQ) and the Russell 2000 (IWM) begin to rise and outperform the S&P 500 consistently. Both together could be powerful and a sign the bottom is in, and the Santa Claus rally is upon us.
Where do we go from here?
Figure: Weekly iShares Russell 2000 Index (IWM) (top) and 12-26-9 MACD (bottom)
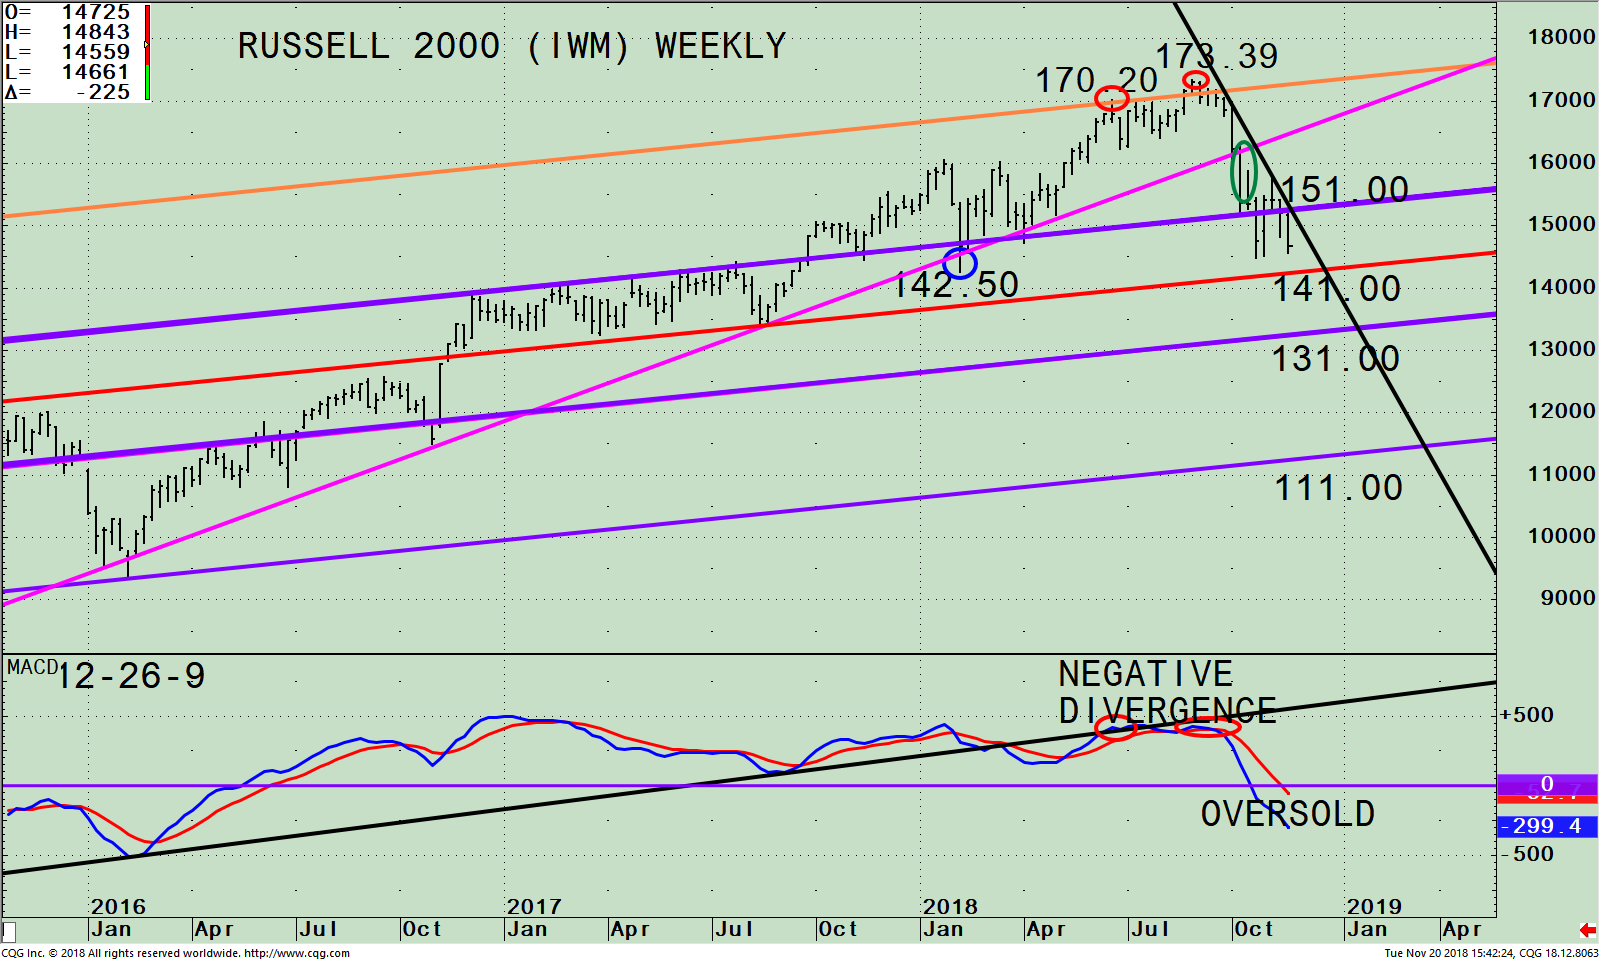
The top portion of the chart shows the weekly (intermediate-term) Russell 2000 (IWM) and its price channels (purple and orange lines). The IWM** was in an uptrend (pink line) since February 2016 except for one breach on 2/9/18 when it made a low at 142.50 (blue circle). The IWM recovered intra-week, gaining strength immediately to ultimately reach the upper channel (orange line) on 6/20 at 170.20 (red circle) before peaking at 173.39 on 8/31/18 (second red circle). A decline followed with selling pressure increasing after the uptrend was violated on 10/10/18 (green circle). The IWM has penetrated support at 151.00, then tried to rally but failed to get above the down trendline (black line), where the IWM broke down from.
It’s a little worrisome the IWM closed on 11/20 at 145.99, below the support level at 151.00. If the IWM closes below the intraday low made on 10/26 at 144.70, then a likely place for the decline to stop is 141.00. The next downside objective, which I’m not expecting to occur is 131.00. It’s encouraging that on the latest decline, the Russell 2000 (IWM) has not taken out the January low as did the Nasdaq Composite Index. It’s also positive that favorable seasonality for small caps historically begins in November.
The lower portion of the chart is MACD, a technical indicator that measures momentum. MACD warned of momentum weakening when it broke the uptrend in March. MACD gave an initial sell signal in June 2018 (red circle on left) that was not confirmed by any declining tops or negative divergences. Since IWM was in an uptrend at the time of this initial sell, it is recommended to disregard the initial sell signal and wait for a second sell to occur. This second sell did take place in August with MACD making a lower high than at the initial sell (red circle on right), not confirming the 8/31/18 price high in IWM at 173.39. This formed a negative divergence. Now, MACD is falling. However, MACD is in an oversold condition below 0 (purple line), the most oversold it has been since 2016. It would be bullish if MACD turns up now. For this to occur first the IWM needs to get above 151.00, the old support level which is now resistance. MACD turning up would imply the decline is most likely over in the near term.
For now, patience is needed until the tape action gives an all-clear signal suggesting the bottoming process is over and a tradeable sustainable rally is possible. A turn up now in small caps could be what the market needs to begin the holiday spirit and the clue that a short-term bottom has formed, and the bottoming process is complete.
I would love to hear from you. Please call me at 516-829-6444 or email at bgortler@signalert.com to share your thoughts or ask me any questions you might have.
I want to wish you and your family a very Happy Thanksgiving.
**The iShares Russell 2000 Index ETF (IWM) is made up of companies with a market capitalization of between $300 million and $2 billion. The portfolio top 5 sector holdings as of 11/19/18 are Financials 23.75%, Health Care 15.01%, Industrials 14.65%, Consumer Cyclicals 14.14%, and Technology 12.79%. (Source: http://www.etf.com/IWM)
I would love to hear from you. Please call me at 516-829-6444 or email at bgortler@signalert.com to share your thoughts or ask me any questions you might have.
Sign up for a FREE 3 issue trial of
SYSTEMS AND FORECASTS Click here
******Article published in Systems and Forecasts by Bonnie Gortler November 21, 2018

If you like this article you would love the free
excerpt chapter of my book Journey to Wealth.
Get instant access here
Disclaimer: Although the information is made with a sincere effort for accuracy, it is not guaranteed that the information provided is a statement of fact. Nor can we guarantee the results of following any of the recommendations made herein. Readers are encouraged to meet with their own advisors to consider the suitability of investments for their own particular situations and for determination of their own risk levels. Past performance does not guarantee any future results.


Create more wealth in your life
with these simple strategies.
As an added bonus you will also
receive BG’s Updates and Ezine

Discover how to quickly create more well-being in your life with these simple strategies.
As an added bonus you will also
receive BG’s Updates and Ezine

As an added bonus you will receive BG’s Updates and Ezine

All work listed on BonnieGortler.com is licensed under a Creative Commons Attribution - Noncommercial - No Derivative Works 3.0 Unported License.


Free Report:
Grow and Sustain Your Wealth
Discover how to grow your money with these easy, simple steps.

