

10 Simple Tips for Financial Well-Being
07/01/2026
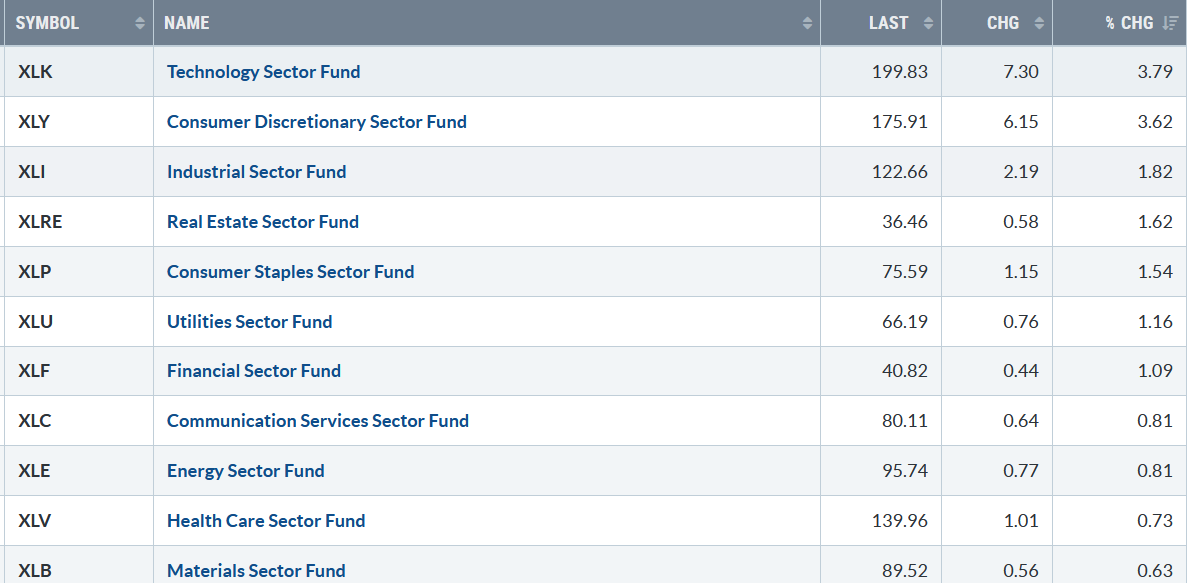
The relief rally started last week. All eleven S&P SPDR sectors finished higher. Technology (XLK) and Consumer Discretionary (XLY) were the strongest, while Health Care (XLV) and Materials (XLB) were higher but lagged. The SPDR S&P 500 ETF Trust (SPY) was up +2.65%.
 042624 SPDR Sectors
S&P SPDR Sector ETFs Performance Summary 4/19/24-4/26/24
Source: Stockcharts.com
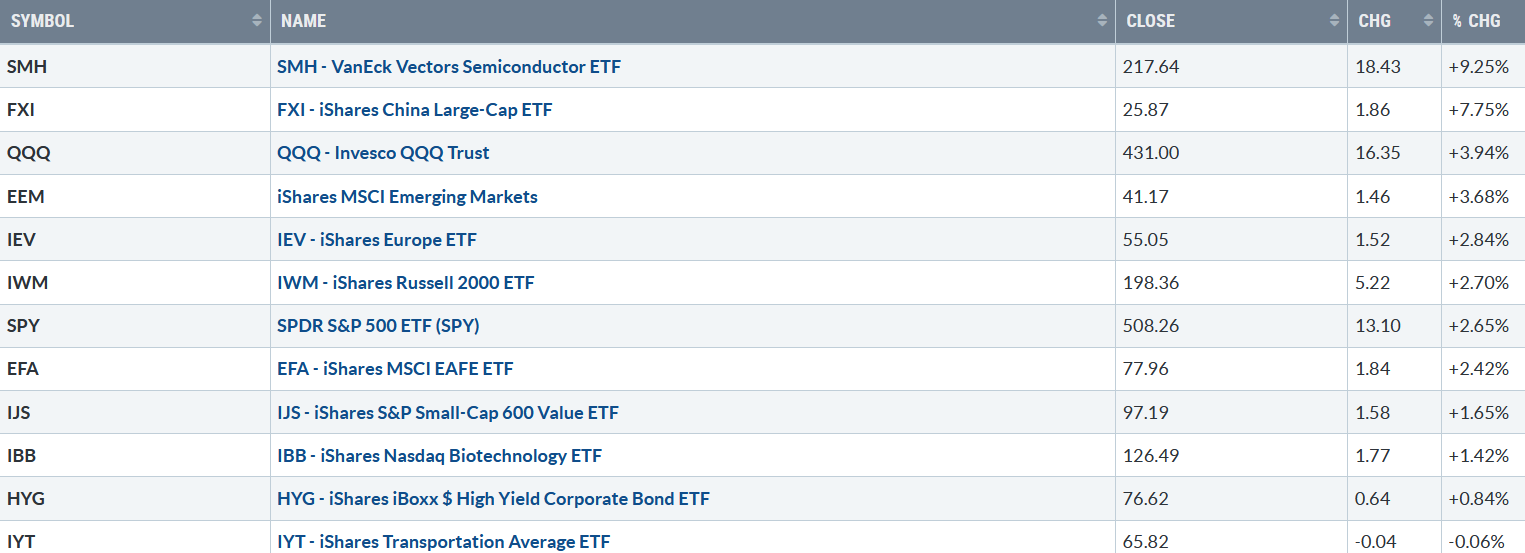
Figure 2: Bonnie’s ETFs Watch List Performance Summary 4/19/24-4/26/24
042624 Bonnie’s ETFs
Source: Stockcharts.com
Semiconductors and Technology stocks led the way. International markets were higher, led by China.
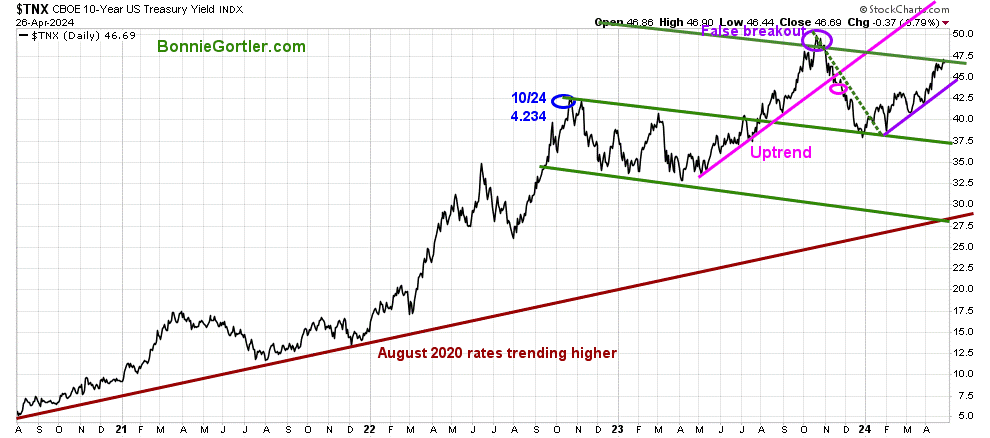
Figure 3: UST 10YR Bond Yields Daily
UST 10 Yr Bond Yields Daily
Source: Stockcharts.com
The 10-year U.S. Treasury rose last week, closing at 4.669%, at the top of the channel, but remains below the 2023 high. Yields continuing to rise and close above 4.75% could fuel further selling pressure in U.S. Equities.
Are you interested in learning more about the stock market? Learn how to implement a powerful wealth-building mindset and simple, reliable strategies to help you grow your wealth in my eCourse Wealth Through Investing Made Simple. Learn more here.
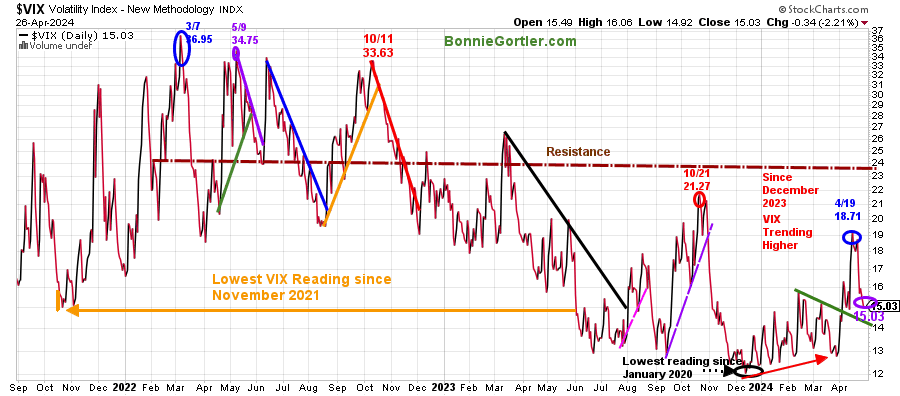
Figure 4: CBOE Volatility Index VIX
042624 VIX Daily
Source: Stockcharts.com
The CBOE Volatility Index (VIX), a measure of fear, traded above 20.00 for most of 2022, with a high at 36.95 on 3/7 (blue circle on the left), which did not get violated in 2023. VIX has been trending higher since December 2023.
Last week, VIX reversed sharply lower, closing at 15.03. (purple circle), and could fall further if VIX closes below 14.30%. If VIX closes above the October 2023 high of 21.27, volatility would likely increase quickly.
The major market averages all rose last week. The Dow was up +0.67%, the S&P 500 ended the three-week losing streak up 2.67%, the best week of the year, and the Nasdaq was up +4.23%. The Russell 2000 Index joined the rally, up 2.79%.
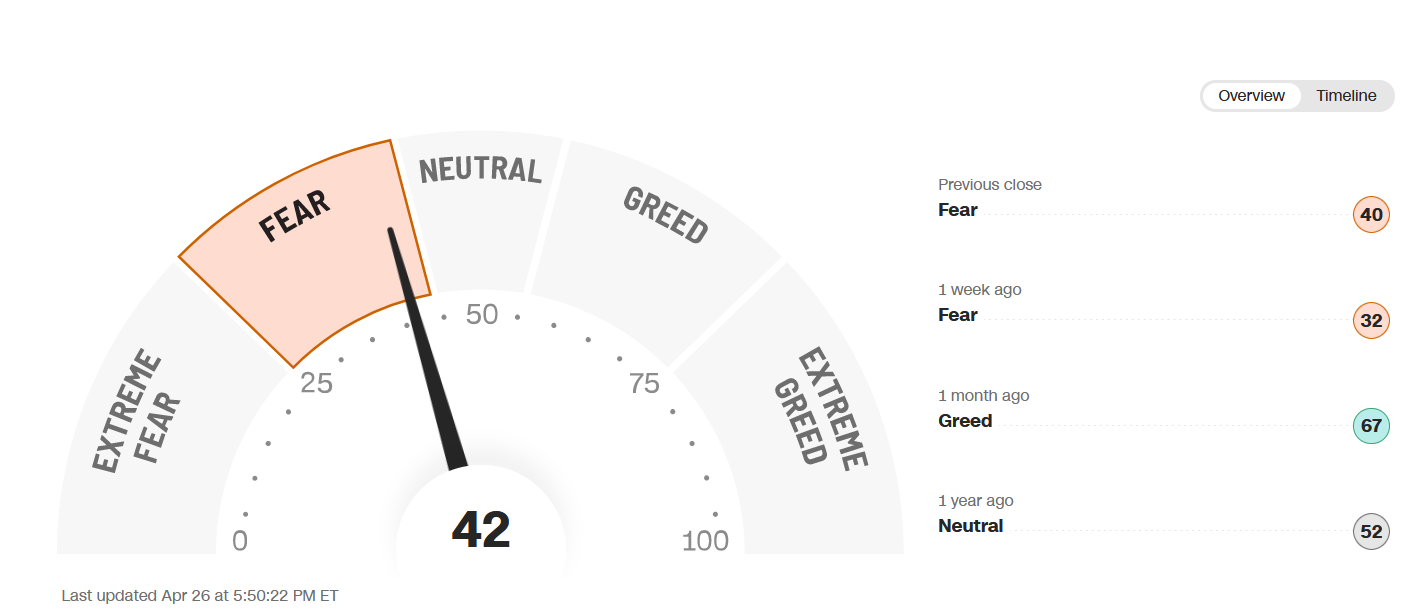
Figure 5: Fear & Greed Index
042624 Fear and Greed Index
Source: CNN.com
Investor sentiment based on the Fear and Greed Index (a contrarian index) measures the market’s mood. The Fear and Greed Index rose last week from a reading of 31 to close at 42, remaining in the fear zone. In the past strong market periods, after readings of Extreme Greed, there has been a retracement towards neutral or fear, which turned out to be a buying opportunity. Time will tell if last week’s relief rally will turn into a short-term bottom.
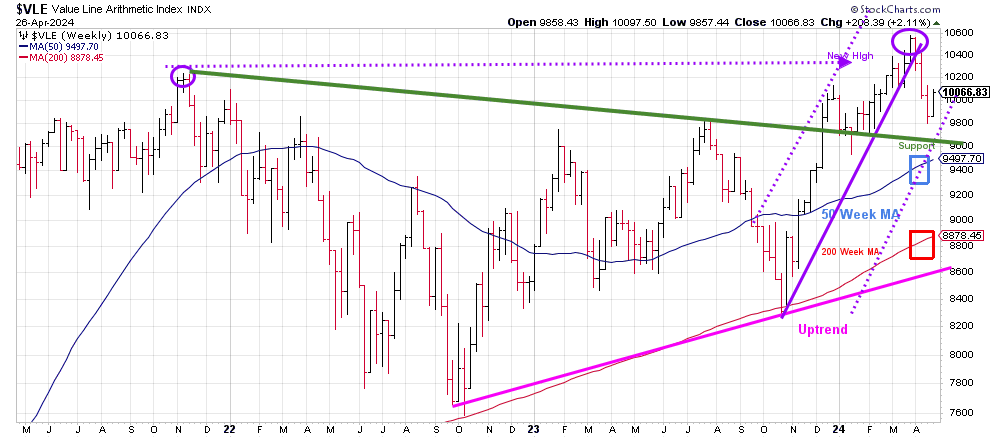
Figure 6: Weekly Value Line Arithmetic Average
042624 VLE Weekly
Source: Stockcharts.com
The top chart is the weekly Chart of the Value Line Arithmetic Index ($VLE), which includes approximately 1700 stocks.
The uptrend (pink line) since October 2023 is no longer in effect (purple line). However, the longer-term uptrend from October 2022 (pink line) remains. VLE rose +2.11%, holding support at 9600, closing near its high for the week. VLE remains above the rising 50-week MA (blue rectangle) and 200-week MA.
Support is at 9600, 9400, and 8800. Resistance is at 10133, 10400, and 10600.
It would be a positive sign that the short-term rally is more than a relief rally if VLE closes above the close on 4/5/24 at 10328.53.
Weekly market breadth was positive on the New York Stock Exchange Index (NYSE) and for the Nasdaq. The NYSE had 2006 advances and 887 declines, with 154 new highs and 93 new lows. There were 2889 advances and 1665 declines on the Nasdaq, with 167 new highs and 417 new lows.
Do you want to go deeper into charting? Learn more in the comfort of your home today with my Free 33-minute Training, Charting Strategies to Cut Risk and Trade with the Trend. Sign up here.
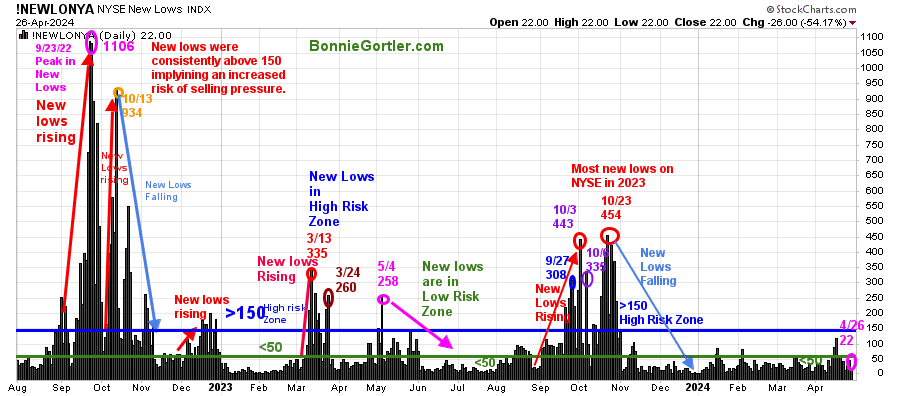
Figure 7: New York Stock Exchange (NYSE) New Lows
042624 NYSE New Lows Daily
Source: Stockcharts.com
Watching New Lows on the New York Stock Exchange is a simple technical tool that helps increase awareness of the direction of an immediate trend.
For most of 2022, new lows warned of a potential sharp pullback, high volatility, and “panic selling,” closing above 150. The peak reading of New Lows in 2022 was on 9/23 at 1106, not exceeded in 2023.
In 2024, New Lows have stayed below 150, and a good part of the year below 50, a sign of a healthy market.
Last week, New Lows on the NYSE closed at 22 (pink circle), below 25, the lowest risk zone. It would be positive in the short term if New Lows remain between 25 and 50. On the other hand, an increase above 150 would be a warning sign that a deeper market correction is possible.
Learn more about the significance of New Lows in my book, Journey to Wealth, published on Amazon. If you would like a preview, get a free chapter here.
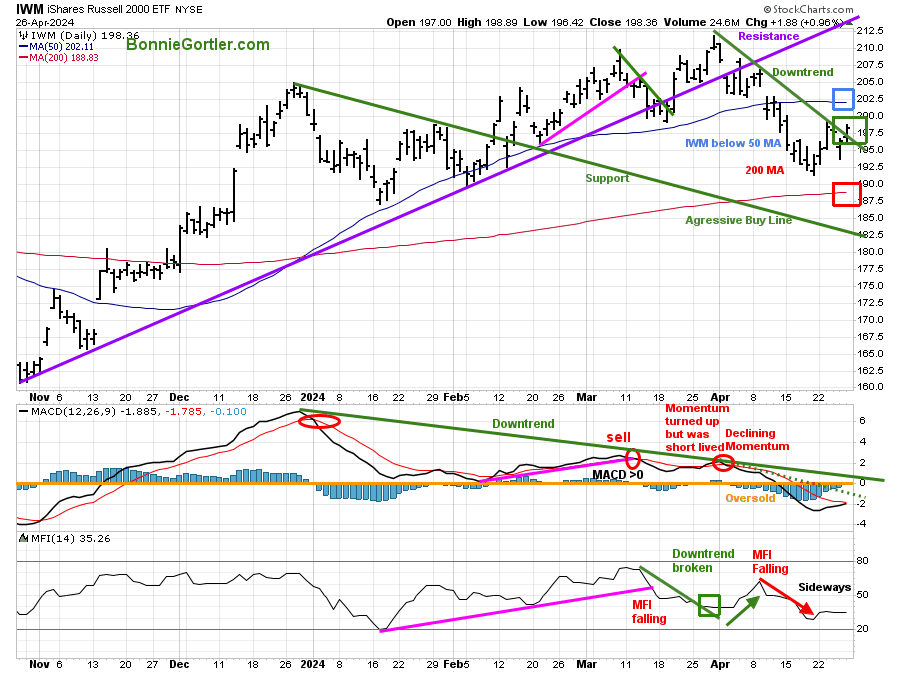
Figure 8: Daily iShares Russell 2000 (IWM) Price (Top) and 12-26-9 MACD (Middle and Money Flow (Bottom)
042624 IWM Daily
Source: Stockcharts.com
The top Chart is the daily iShares Russell 2000 Index ETF (IWM), the benchmark for small-cap stocks, with a 50-Day Moving Average (MA) (blue rectangle) and 200-Day Moving Average (MA) (red rectangle) that traders watch and use to define trends.
IWM peaked in March, formed a bearish pattern of lower highs, and fell below the 50-day MA in early April but held above the 200-day MA, a key area.
Support is at 197.50, 192.50, 187.50 and 182.50. Resistance is at 202.50, 207.50, and 212.50.
MACD (middle chart) remains on a sell, falling below 0, the most oversold since November 2023. MACD is close to generating a fresh buy and downtrend break from January 2024 (green line) on IWM strength.
Money flow (lower chart) is moving sideways. It would be a positive sign that investors are more interested in Small Caps if the money flow turns up and goes above 50.
On Friday, IWM broke the downtrend from March, shifting the daily trend to up. IWM closed above the resistance of 197.50 which is now support. There is no confirmation yet in MACD or Money Flow, but it will likely follow on IWM strength.
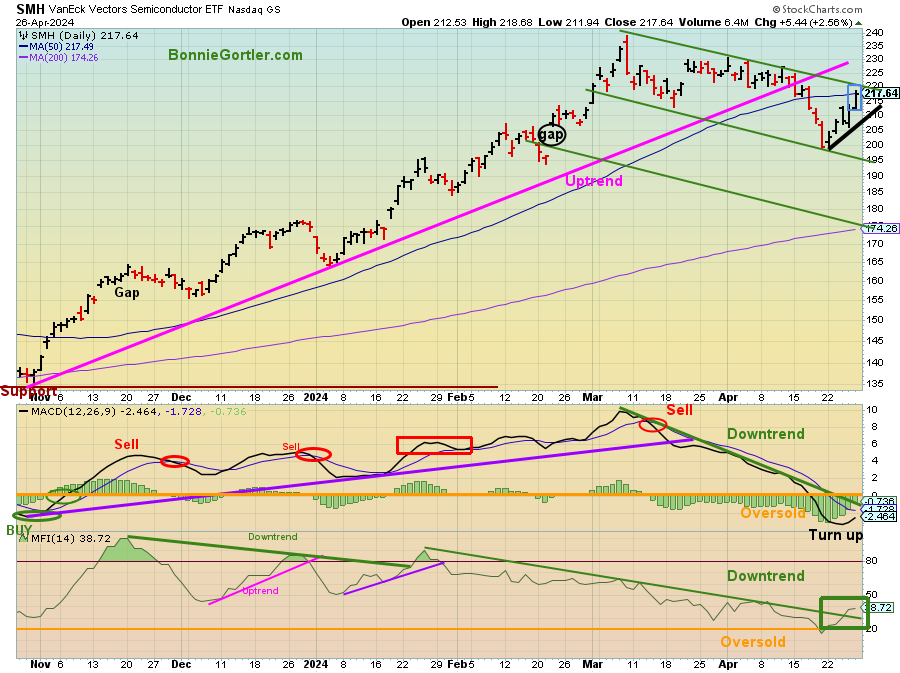
Figure 9: Daily Semiconductors (SMH) (Top) and 12-26-9 MACD (Middle) and Money Flow (Bottom)
042624 SMH Daily
Source: Stockcharts.com
The top chart shows the Daily Semiconductors (SMH) ETF, concentrated mainly in US-based Mega-Cap Semiconductor companies. SMH tends to be a lead indicator for the market when investors are willing to take on increased risk, and the opposite is true when the market is falling.
The Semiconductor ETF (SMH) peaked on March 3/8 at 239.14 and broke the daily uptrend from November 2023 (pink line), shifting the daily trend to down in early April.
SMH rose sharply last week, gaining 9.25%, and closed at 217.64, slightly above the 50-day Moving Average. Further gains this week will shift the daily trend to up.
Support is at 205.00, 195.00, and 175.00. Resistance is at 220.00, 225.00, and 235.00.
MACD (middle chart) remains on a sell below 0 and rising. Further strength will generate a fresh buy in MACD.
Money Flow (lower chart) is rising and broke its downtrend from January, a short-term positive.
Do you want more knowledge about the stock market? Learn how to implement a powerful wealth-building mindset and simple, reliable strategies to help you grow your wealth. Check out my eCourse Wealth Through Investing Made Simple Here.
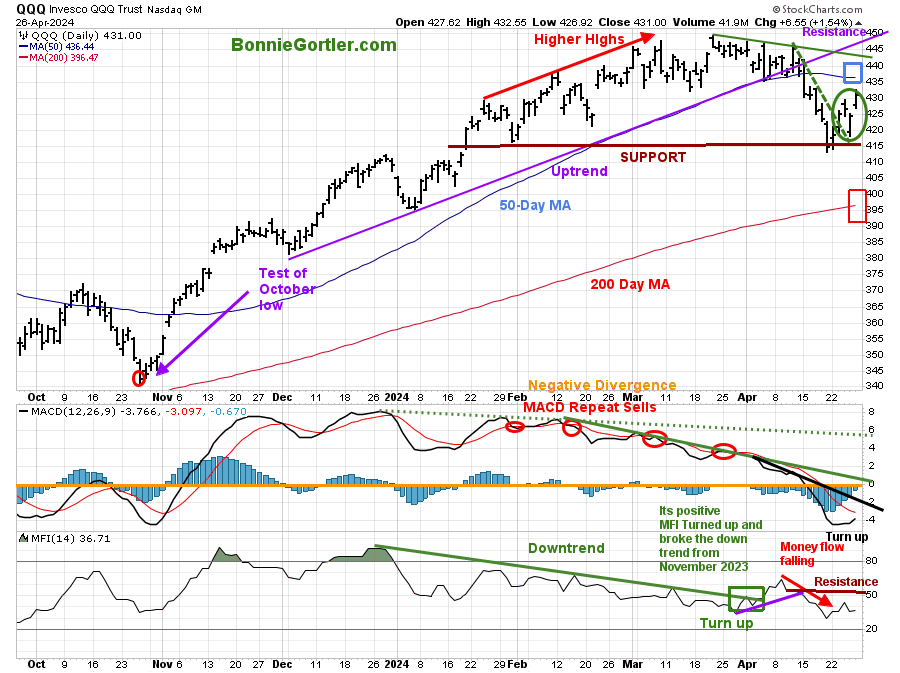
Figure 10: Daily Invesco QQQ Trust (QQQ) Price (Top) and 12-26-9 MACD (Bottom)
042624 QQQ Daily
Source: Stockcharts.com
The Chart shows the daily Invesco QQQ, an exchange-traded fund based on the Nasdaq 100 Index. QQQ made a low in October 2023 (red circle), followed by a successful retest of the low in early January 2024 and the start of an uptrend.
Nasdaq 100 (QQQ) rose sharply, +3.94%. However, QQQ remains in a downtrend, closing below the 50-day Moving Average (blue rectangle) and above the 200-day Moving Average.
Support is at 425.00, 413.00, and 395.00. Resistance is at 437.00 and 447.00.
The bottom chart, MACD (12, 26, 9), remains on a sell, below 0, rising after the lowest reading since November 2023. MACD remains in a downtrend (black line).
Money flow (lower chart) turned up in April but has not shown much strength, closing below resistance (brown line).
In Sum:
QQQ had a relief rally last week from an oversold condition. However, there is no confirmation from MACD or Money Flow rising above resistance. A MACD buy and both the MACD momentum downtrends breaking would be bullish, implying last week’s gains are more than a relief rally. On the other hand, a weekly close below 413.00 would suggest further downside.
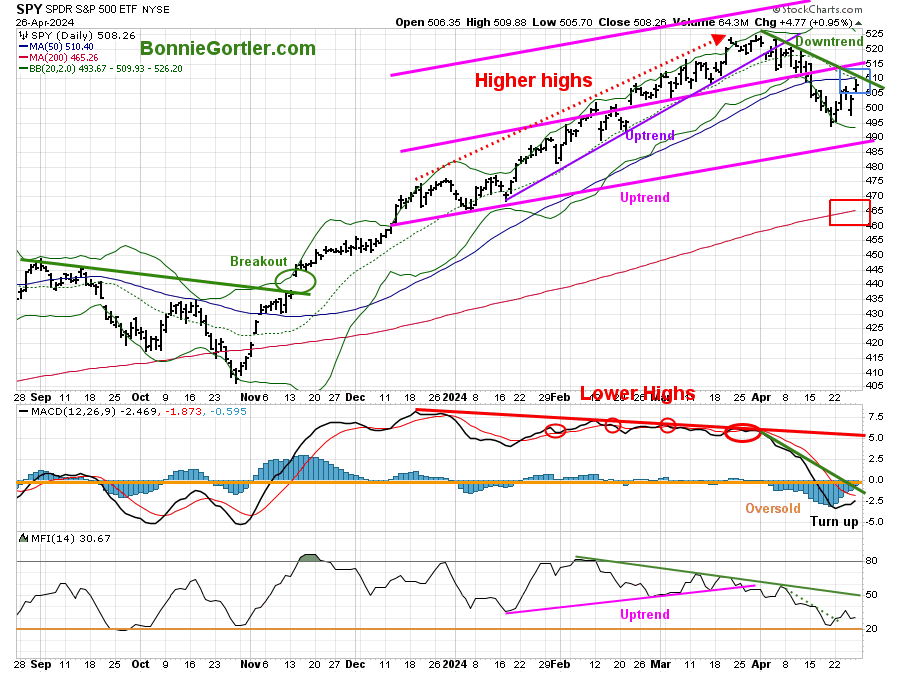
Figure 11: The S&P 500 Index (SPY) Daily (Top) and 12-26-9 MACD (Middle) and Money Flow (Bottom)
042624 SPY Daily
Source: Stockcharts.com
The SPY April downtrend remains.
The SPY closed up +2.65% at 495.16, closing near last week’s high support but below the 50-day Moving Average (blue rectangle). SPY remains above the 200-day Moving Average (red rectangle).
Support is at 505.00, 487.00 and 465.00. Resistance is at 515.00 and 525.00.
MACD (middle chart) remains on a sell below 0, rising but in a downtrend from March.
Money Flow (bottom chart) turned up, breaking the April downtrend (green dotted line), but there is more work to do to get above the February downtrend (green line).
The SPY closed for two days above resistance at 502.00, generating a relief rally, but did not get through the previous week’s high of 515.30. Two closes above would imply another test of the high, and last weeks rise is more than a relief rally.
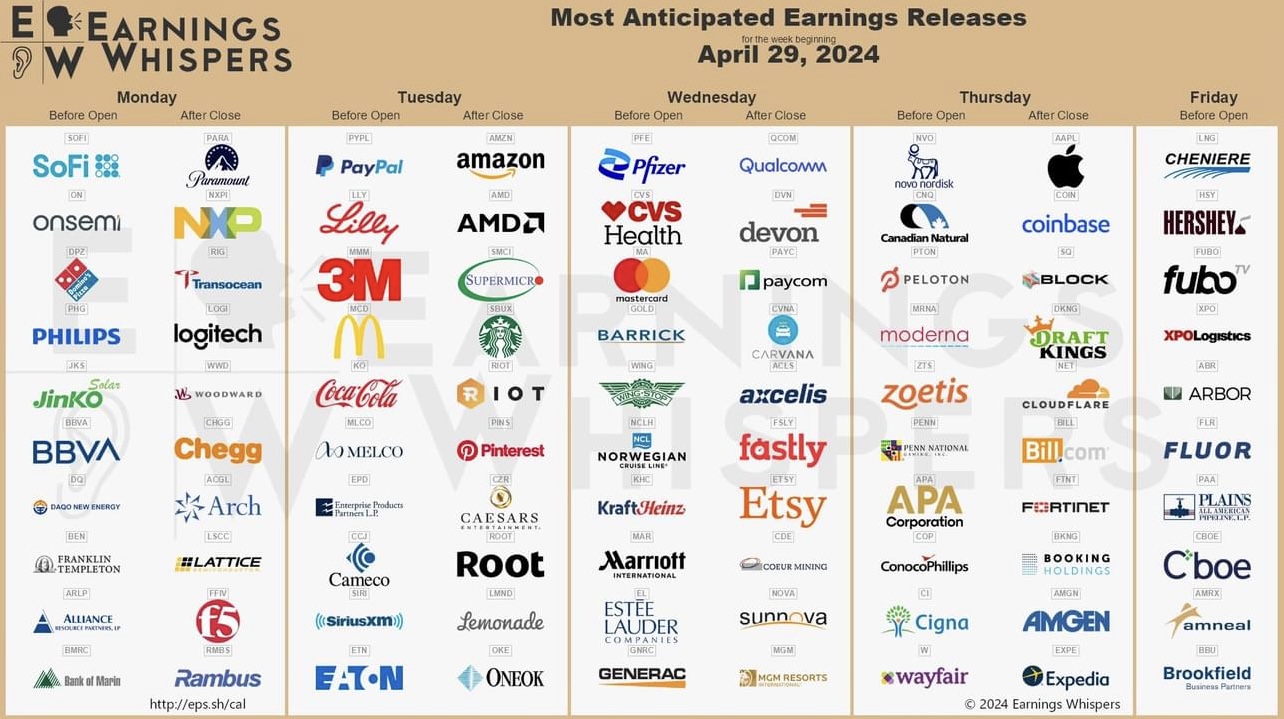
Figure 12: Most Anticipated Earnings Releases for the week of 4/29/24
Source: Earnings Whispers
More than 150 S&P 500 index companies will report earnings, including Advanced Micro Devices (AMD), Amazon (AMZN) and Apple (AAPL) this week.
Summing Up.
Stocks closed Friday near their session highs, fueled by Alphabet and Nvidia. Look for increased volatility with the busiest week of Earnings announcements, the Fed meeting, the Jobs Report, and the Treasury Refunding this week. Technically, daily momentum oscillators have turned up and are no longer accelerating lower, implying the worst is over, but there is no confirmation yet. It’s bullish that market breadth improved, support levels held, and Small-Cap stocks joined Semiconductor and Technology stocks last week. Look for the relief rally to broaden if the economic news and earnings announcements are positive without violating the April low.
Remember to manage your risk, and your wealth will grow.
Let’s talk about investing together. You are invited to schedule your Free 30-minute consultation here or by emailing me at Bonnie@BonnieGortler.com. I would love to schedule a call and connect with you.
Disclaimer: Although the information is made with a sincere effort for accuracy, it is not guaranteed that the information provided is a statement of fact. Nor can we guarantee the results of following any of the recommendations made herein. Readers are encouraged to meet with their own advisors to consider the suitability of investments for their own particular situations and for determination of their own risk levels. Past performance does not guarantee any future results.


Create more wealth in your life
with these simple strategies.
As an added bonus you will also
receive BG’s Updates and Ezine

Discover how to quickly create more well-being in your life with these simple strategies.
As an added bonus you will also
receive BG’s Updates and Ezine

As an added bonus you will receive BG’s Updates and Ezine

All work listed on BonnieGortler.com is licensed under a Creative Commons Attribution - Noncommercial - No Derivative Works 3.0 Unported License.


Free Report:
Grow and Sustain Your Wealth
Discover how to grow your money with these easy, simple steps.

