

Bonnie’s Market Update 2/13/26
02/15/2026
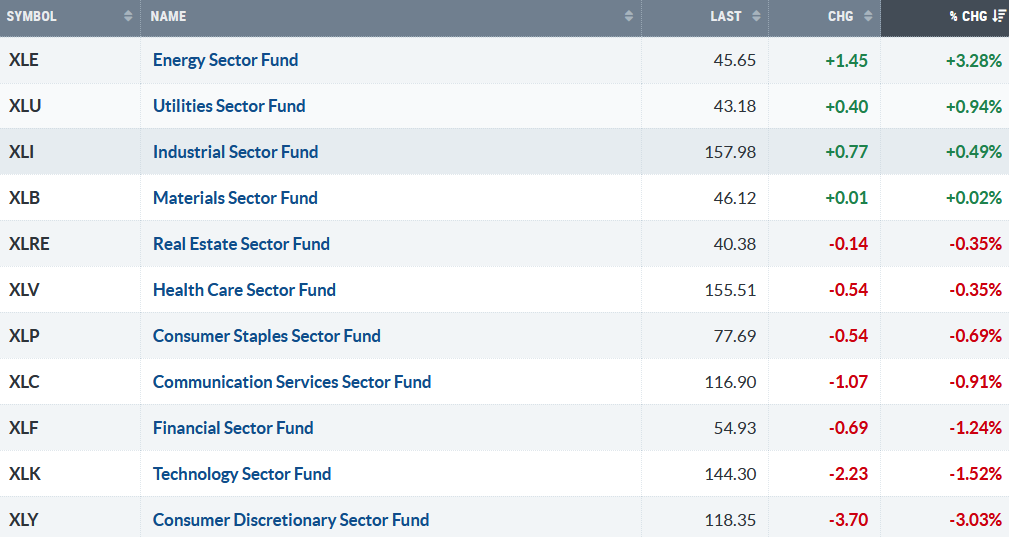
Solid gains in 2025 for the major averages. Only four of the eleven S&P SPDR sectors were higher last week. Energy (XLE) and Utilities (XLU) were the strongest sectors, while Technology (XLY) and Consumer Discretionary (XLY) were the weakest. The SPDR S&P 500 ETF Trust (SPY) fell -1.03%.
S&P SPDR Sector ETFs Performance Summary 12/26/25 -1/02/26
010226 SPDR Sectors
Source: Stockcharts.com
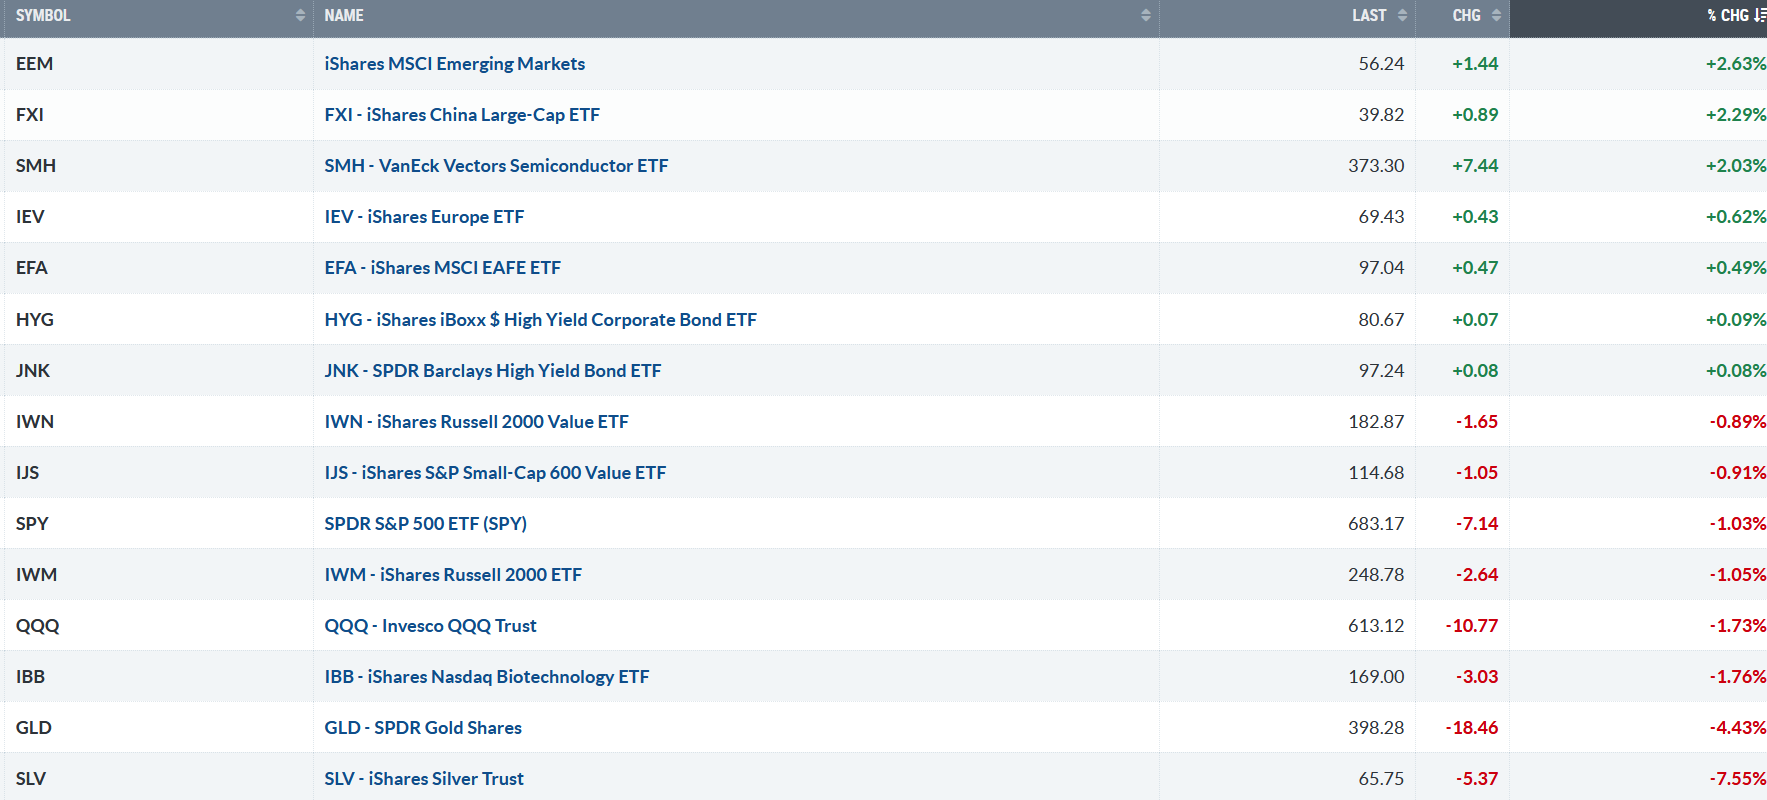
Figure 2: Bonnie’s ETFs Watch List Performance Summary 12/26/25 -1/02/26
010226 Bonnie’s ETF Watch List
Source: Stockcharts.com
Emerging Markets, China, and Semiconductors led thanks to Friday’s strength, while Gold and Silver were under selling pressure.
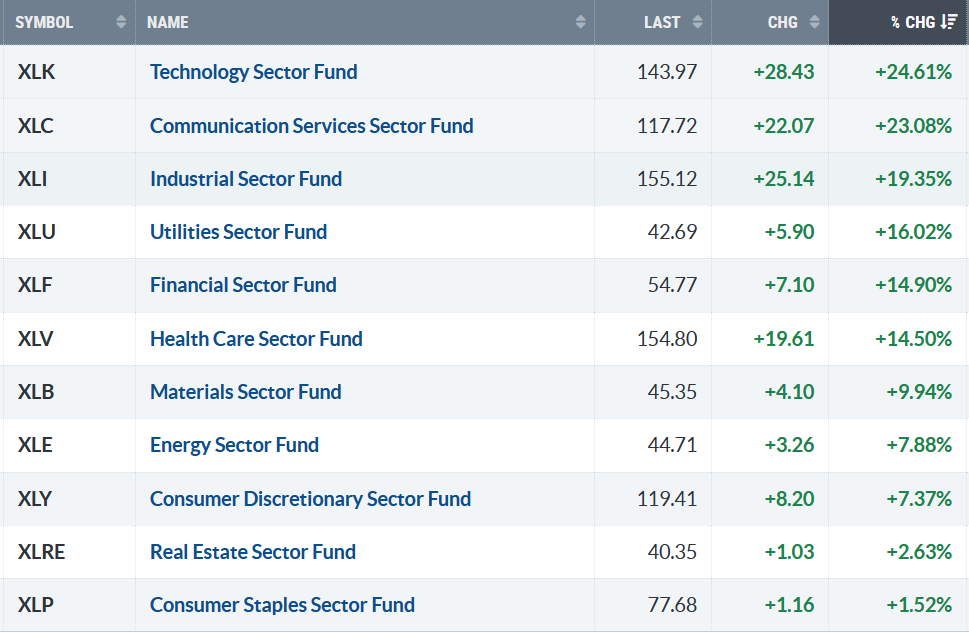
Figure 3: S&P SPDR Sector ETFs Year-End 2025 Performance Summary
123125 SPDR Sectors YTD
Source: Stockcharts.com
Technology and Communication Services, aggressive sectors were the strongest S&P SPDR sectors in 2025, while defensive sectors, Real Estate (XLRE) and Consumer Staples (XLP) were the weakest.
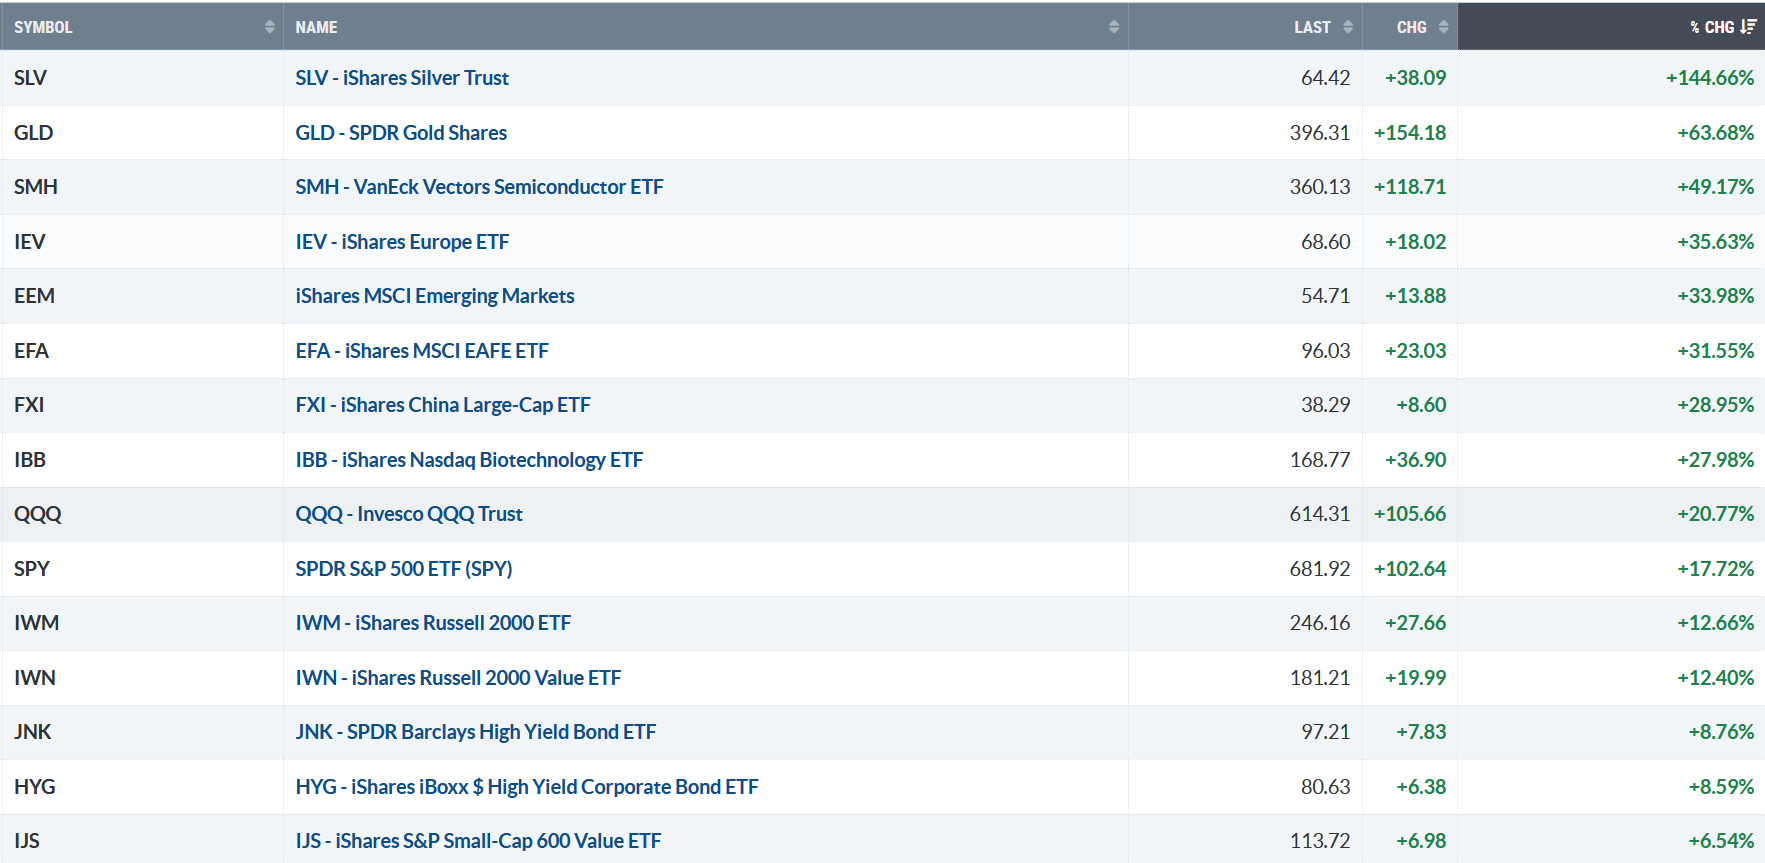
Figure 4: Bonnie’s ETFs Watch List Year-End 2025 Performance Summary
123125 Bonnie’s ETF Watch List
Source: Stockcharts.com
Silver was the biggest gainer for 2025. Gold, Semiconductors, Biotechnology, and the Nasdaq 100 led the U.S. market. In 2025, international equities posted the most significant outperformance against the S&P 500 since 2009.
Figure 5: Year-End 2025 Performance Summary Major Averages
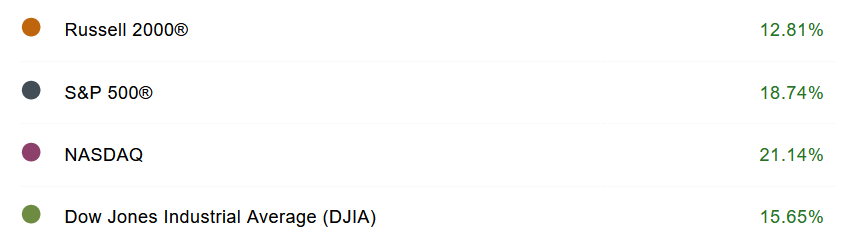
123125 January – December 2025
Source: Schwab
The major averages all posted solid gains in a volatile 2025 after bottoming in April.
Figure 6: NYSE New Lows
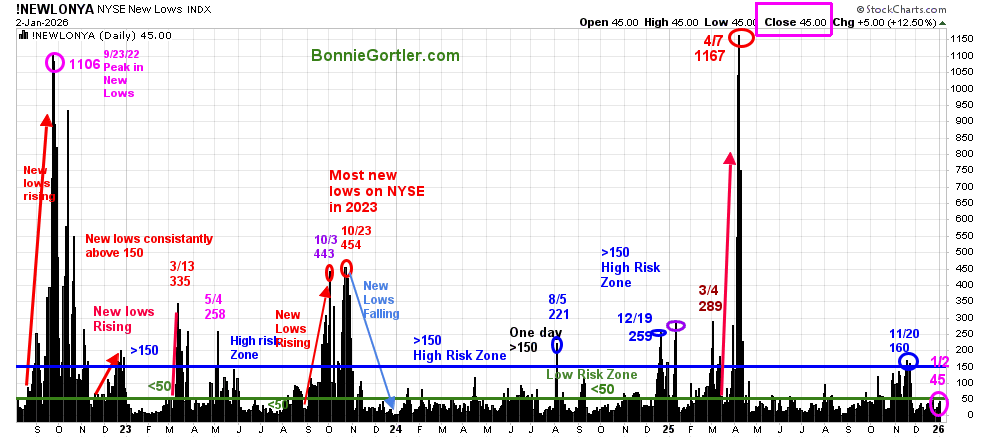
010226 NYSE New Lows
Source: Stockcharts.com
New Lows closed Friday, 1/2/26, at 45, in a low-risk zone, where prices tend to rise. It will remain positive in the short term if New Lows stay between 25 and 50. On the other hand, if new lows begin to increase and exceed 150, it would be short-term negative with more volatility and increased risk expected.
Learn more about the significance of New Lows in my book, Journey to Wealth, published on Amazon. For a chapter preview of Journey To Wealth, visit here.
Figure 7: S&P 500 Price and NYSE, SPX, Mid and Small Cap AD Lines
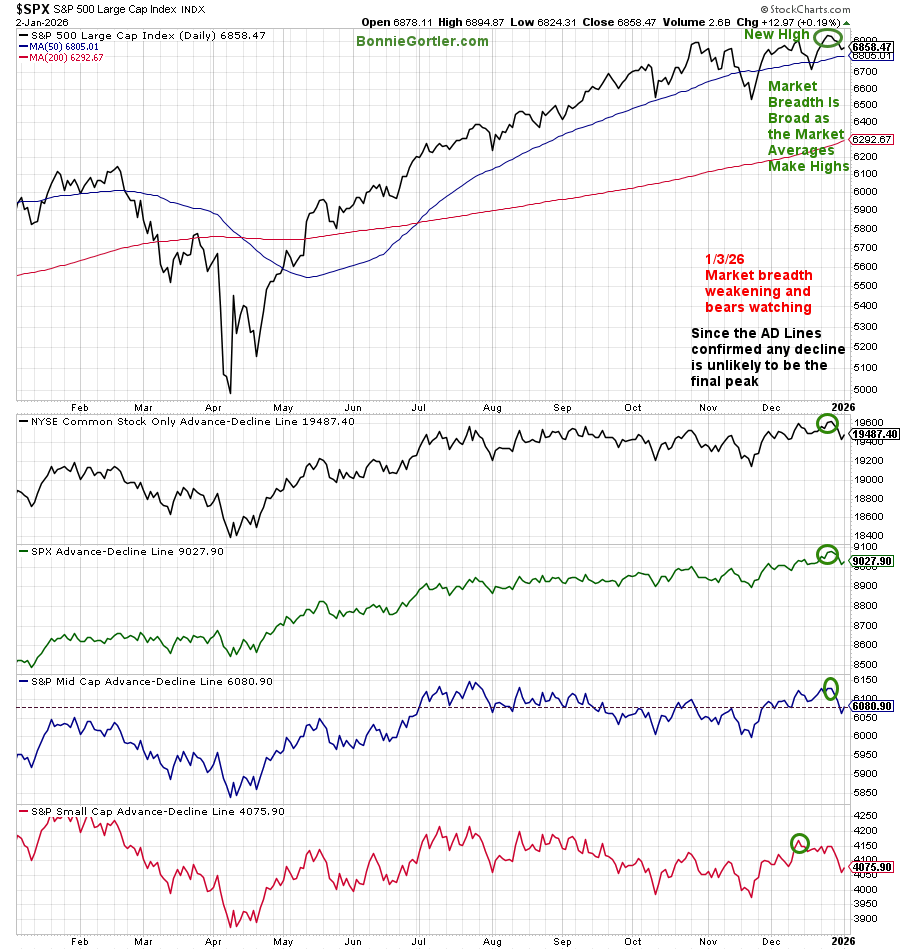
010226 S&P 500 Price and NYSE, SPX, Mid and Small Cap AD Lines
Source: Stockcharts.com
The last week of 2025 saw market breadth weaken, and bears watching. Market breadth, as measured by the Advances-Declines line, had confirmed the market averages’ new highs in 2025, implying that any decline is unlikely to be the final peak.
Figure 8: Fear & Greed Index
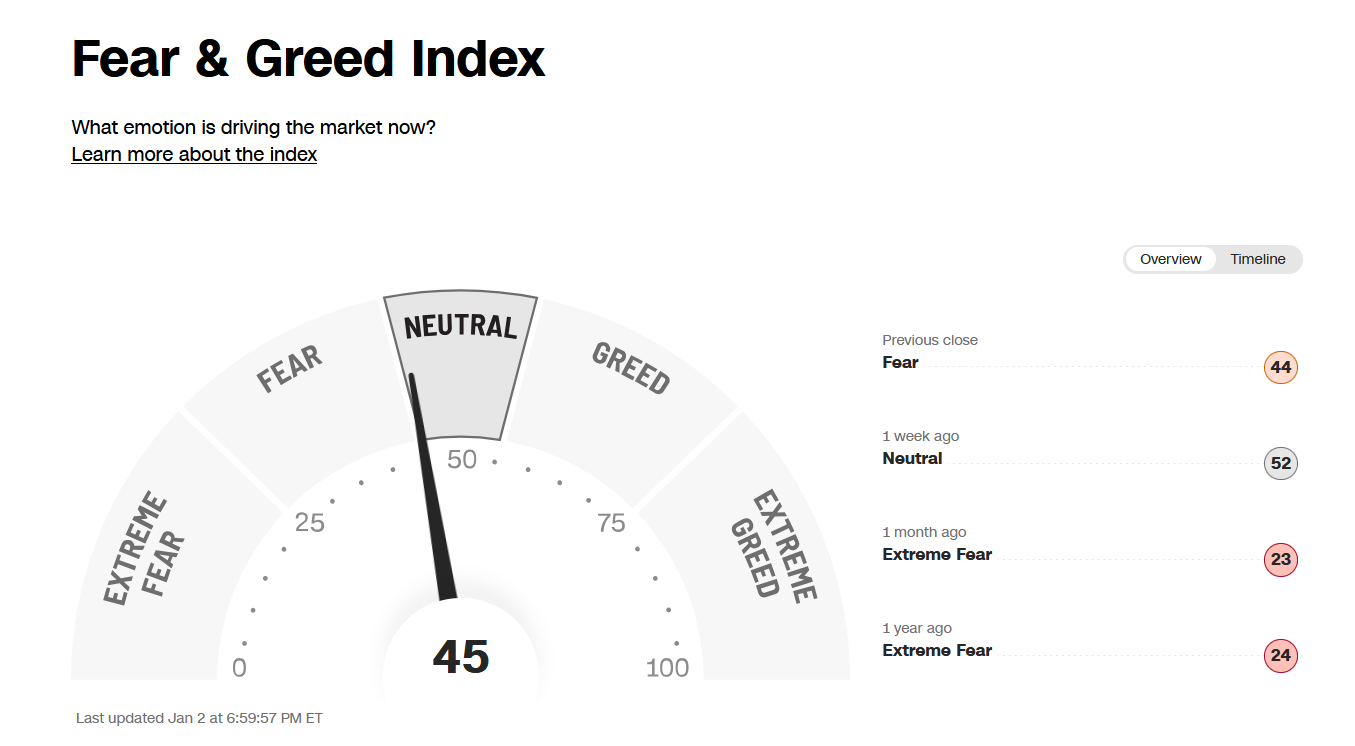
010226 CNN Fear and Greed Index
Source. CNN.com
Investor sentiment, as measured by the Fear and Greed Index (a contrarian indicator), closed at 45, a neutral reading. If sentiment rises to Extreme Greed, the risk of a short-term pullback will increase.
Figure 9: Daily iShares Russell 2000 (IWM) Price (Top),12-26-9 MACD (Middle), and Money Flow (Bottom)
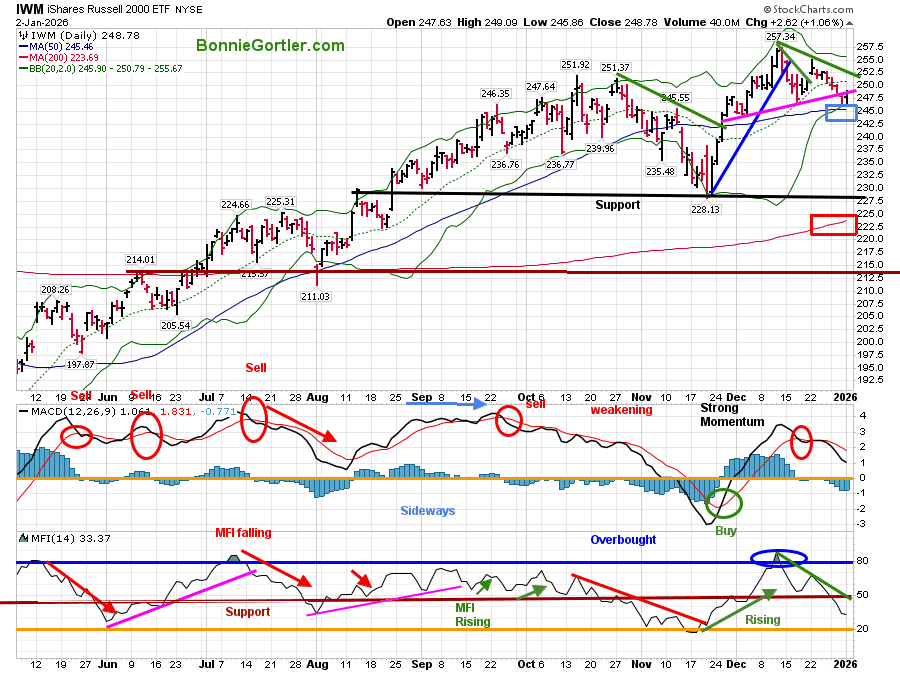
010226 IWM Daily
Source: Stockcharts.com
The Russell 2000 (IWM) closed above the 50-day Moving Average (blue rectangle) but down -1.05% for the week at 248.78. It was positive that IWM closed higher by +1.05%, outperforming the S&P 500 near its high of the day on Friday. If Small Caps show leadership and rise, closing two days above 252.50, it’s likely to fuel the broader market higher. On the other hand, two closes below 244.50 would likely be short-term negative.
Learn charting strategies to help you grow your wealth in the comfort of your home in my eCourse, Wealth Through Investing Made Simple. New Module 7: Trading Alerts That Build Confidence and Reduce Risk. Learn more here.
If you want to talk charts, contact me at Bonnie@BonnieGortler.com
Figure 10: QQQ Daily Invesco QQQ Trust (QQQ) Price
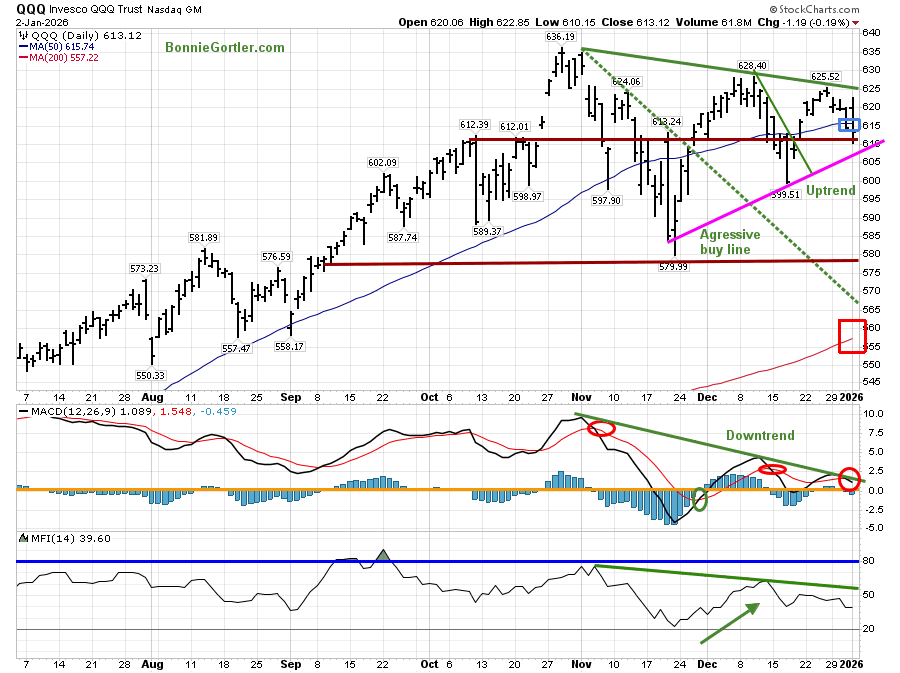
010226 QQQ Daily
The chart shows the Invesco (QQQ), an exchange-traded fund based on the Nasdaq 100 Index.
QQQ fell -1.73% last week, closing in the lower range of Friday’s trading. QQQ remains in its downtrend from October.
It was positive that Semiconductor stocks led on Friday, gaining +3.66% much stronger than QQQ. It would be positive if there are two closes above 625.52, breaking the October downtrend in the Nasdaq 100 (QQQ). On the other hand, two closes below 605.00 would indicate further weakness in Technology stocks.
Summing Up:
All major averages were lower last week on weakening market breadth as 2025 came to an end. New Lows on the New York Stock Exchange remain in a low-risk zone. Support levels remain intact on the major averages. Until support levels break and the New Lows on the NYSE expand over 150, higher prices are likely. Manage your risk, and your wealth will grow.
If you would like to get to know each other better, schedule your Free 30-minute Wealth Building Strategy Session today. Register Here.


Create more wealth in your life
with these simple strategies.
As an added bonus you will also
receive BG’s Updates and Ezine

Discover how to quickly create more well-being in your life with these simple strategies.
As an added bonus you will also
receive BG’s Updates and Ezine

As an added bonus you will receive BG’s Updates and Ezine

All work listed on BonnieGortler.com is licensed under a Creative Commons Attribution - Noncommercial - No Derivative Works 3.0 Unported License.
