

Bonnie’s Market Update 2/13/26
02/15/2026
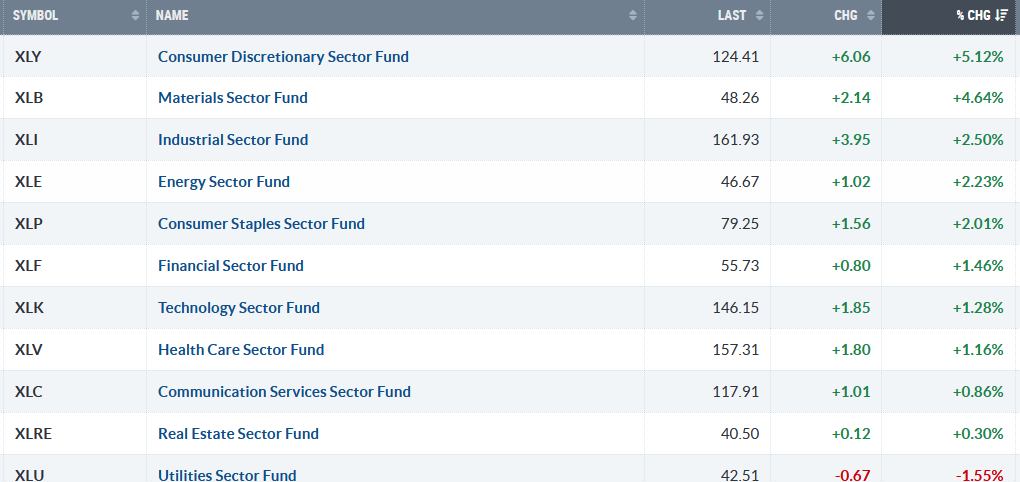
Solid gains for the major averages last week. Ten of the eleven S&P SPDR sectors were higher last week. Consumer Discretionary (XLY) and Materials (XLB) were the strongest sectors, while Real Estate (XLRE) and Utilities (XLU) were the weakest. The SPDR S&P 500 ETF Trust (SPY) gained +1.60%.
S&P SPDR Sector ETFs Performance Summary 1/02/26-1/9/26
010926 SPDR Sectors
Source: Stockcharts.com
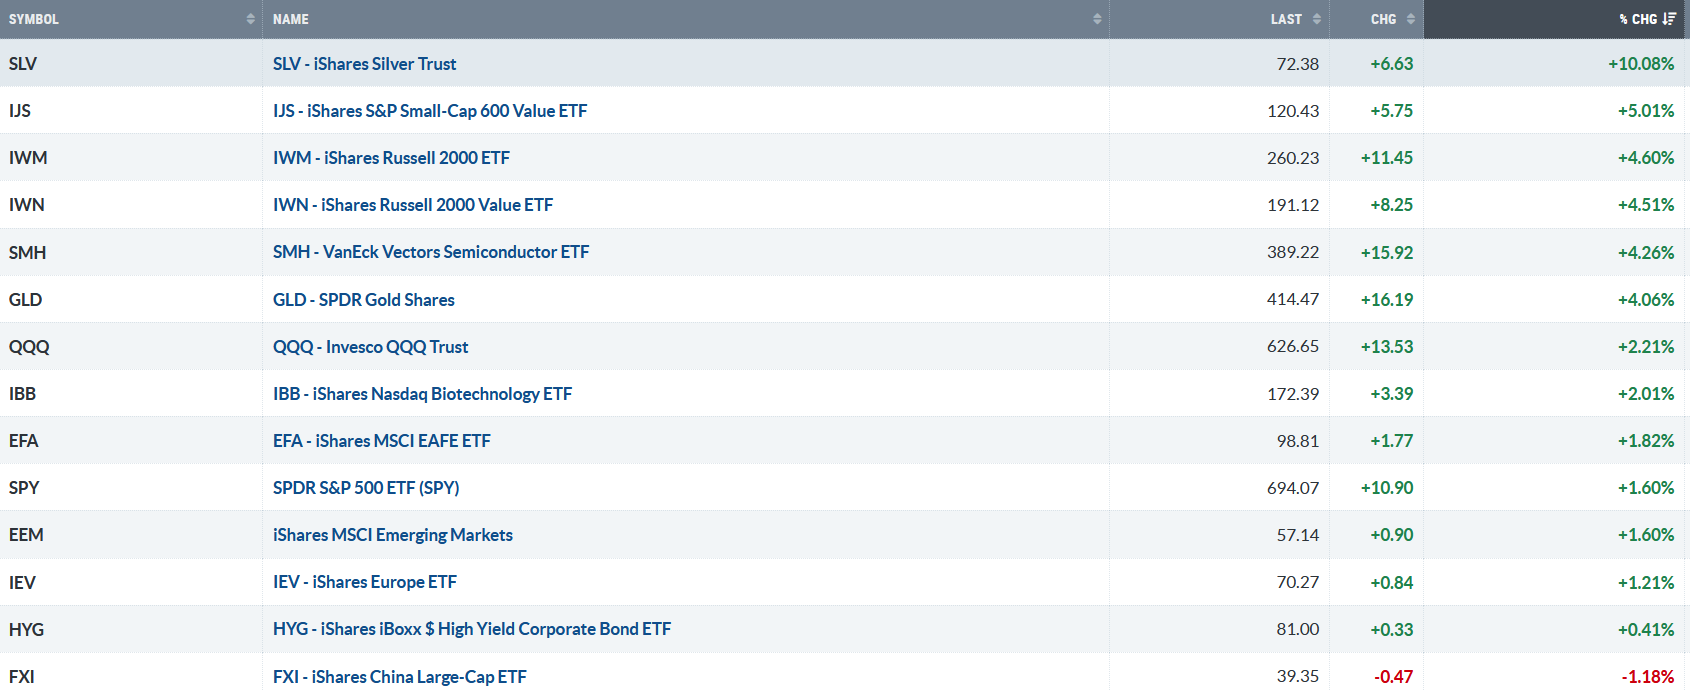
Figure 2: Bonnie’s ETFs Watch List Performance Summary 1/02/26-1/9/26
010926 Bonnie’s ETF Watch List
Source: Stockcharts.com
Silver, Small Cap Growth and Value, Semiconductors, and Gold were strong, while China was weak.
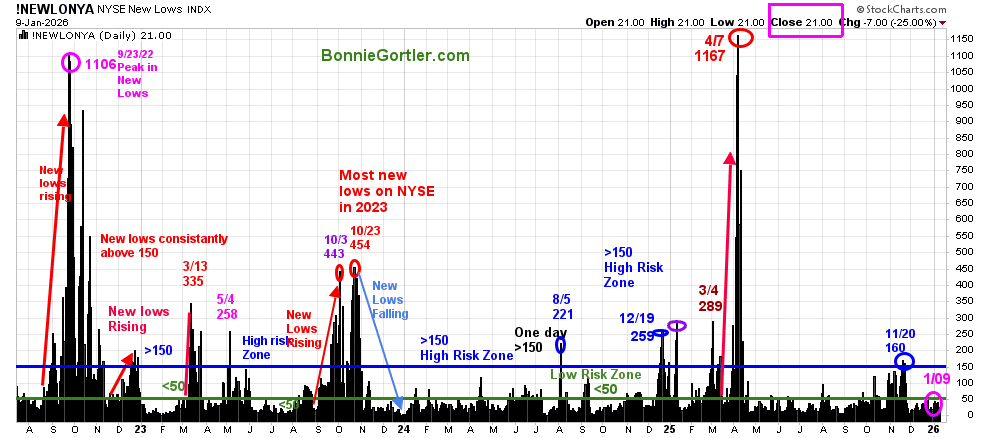
Figure 3: NYSE New Lows
010926 NYSE New Lows
Source: Stockcharts.com
New Lows closed Friday, 1/9/26, at 21, in the very low-risk zone, where prices tend to rise. It will remain positive in the short term if New Lows stay between 25 and 50. On the other hand, if new lows begin to rise and exceed 150, it would be a short-term negative, with more volatility and increased risk.
Learn more about the significance of New Lows in my book, Journey to Wealth, published on Amazon. For a chapter preview of Journey To Wealth, visit here.
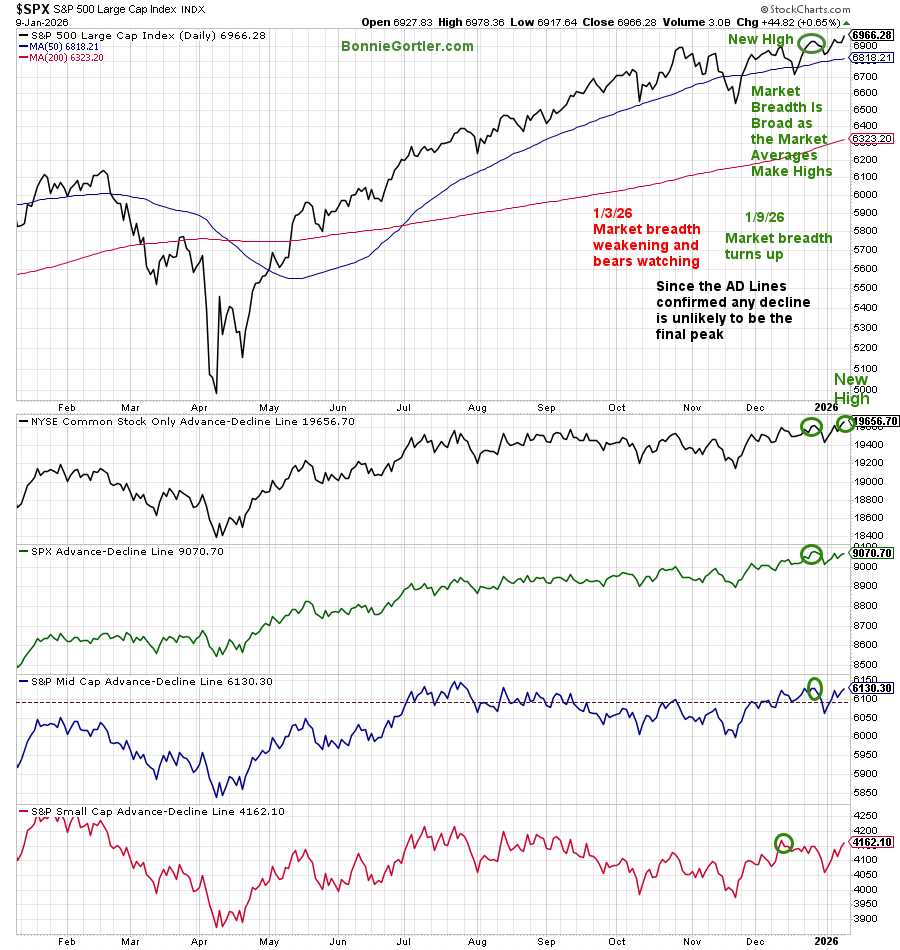
Figure 4: S&P 500 Price and NYSE, SPX, Mid and Small Cap AD Lines
010926 S&P 500 Price and NYSE, SPX, Mid and Small Cap AD Lines
Source: Stockcharts.com
Market breadth improved last week after weakness the previous week. The NYSE Common Stock Index made a new high.
You want to continue to see breadth remain positive.
It would be bullish if the S&P 500, the S&P Mid Cap, and the S&P Small Cap Advance-Decline lines make a new high.
Free Training Charting Strategies to Cut Risk and Trade with the Trend.
Learn more HERE
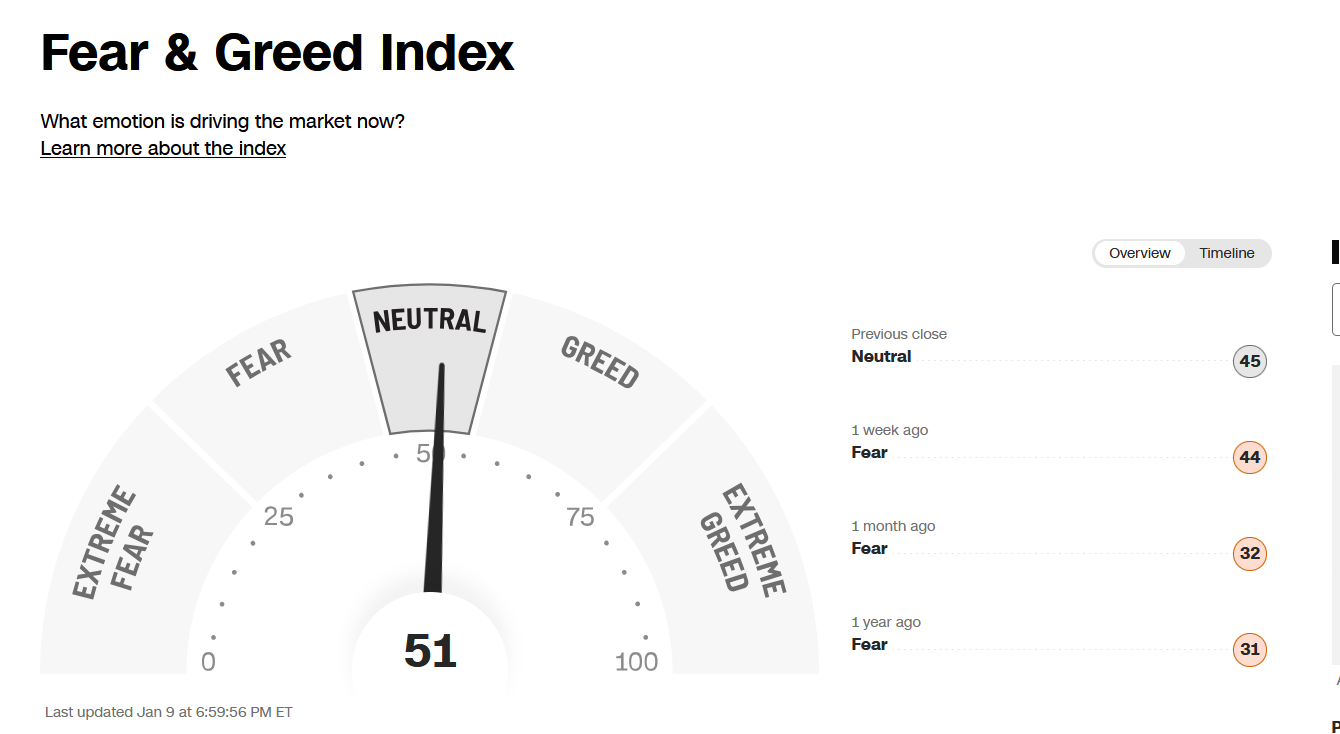
Figure 5: Fear & Greed Index
010926 CNN Fear and Greed Index
Source. CNN.com
Investor sentiment, as measured by the Fear and Greed Index (a contrarian indicator), increased to 51, remaining neutral. If sentiment rises to Extreme Greed, the risk of a short-term pullback will increase.
Watch Small Caps for a Clue to Market Direction
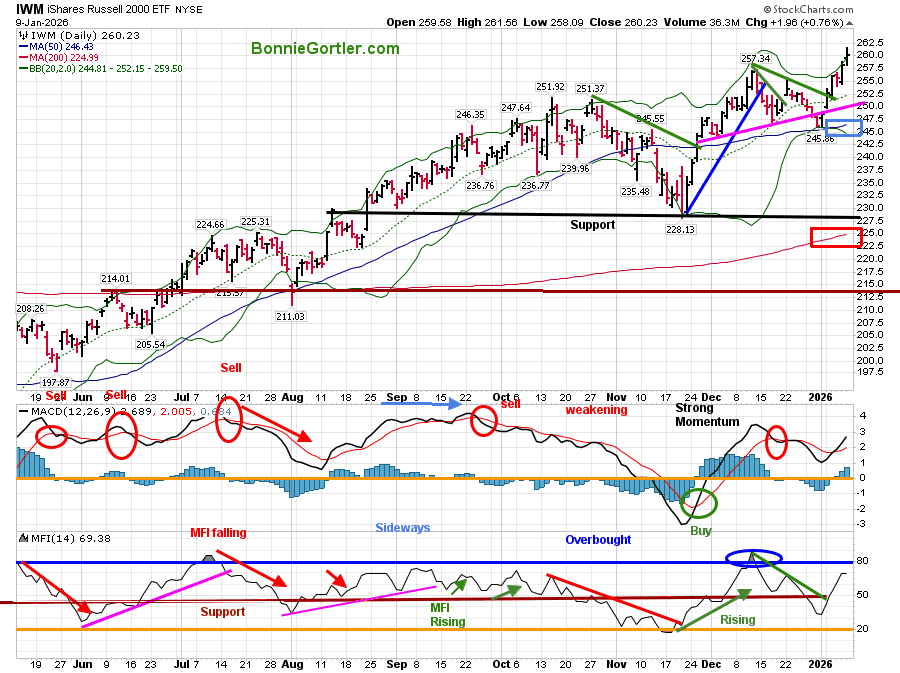
Figure 6: Daily iShares Russell 2000 (IWM) Price (Top),12-26-9 MACD (Middle), and Money Flow (Bottom)
010926 IWM Daily
Source: Stockcharts.com
The Russell 2000 (IWM) fueled the market higher last week, gaining +4.60% to close at 260.23, closing well above the 50-day Moving Average (blue rectangle).
If Small Caps continue to show leadership, it’s likely to fuel the broader market higher. On the other hand, Small Caps lagging the S&P 500 and closing below 249.57 would likely be short-term negative.
Learn charting strategies to help you grow your wealth in the comfort of your home in my eCourse, Wealth Through Investing Made Simple. New Module 7: Trading Alerts That Build Confidence and Reduce Risk. Learn more here.
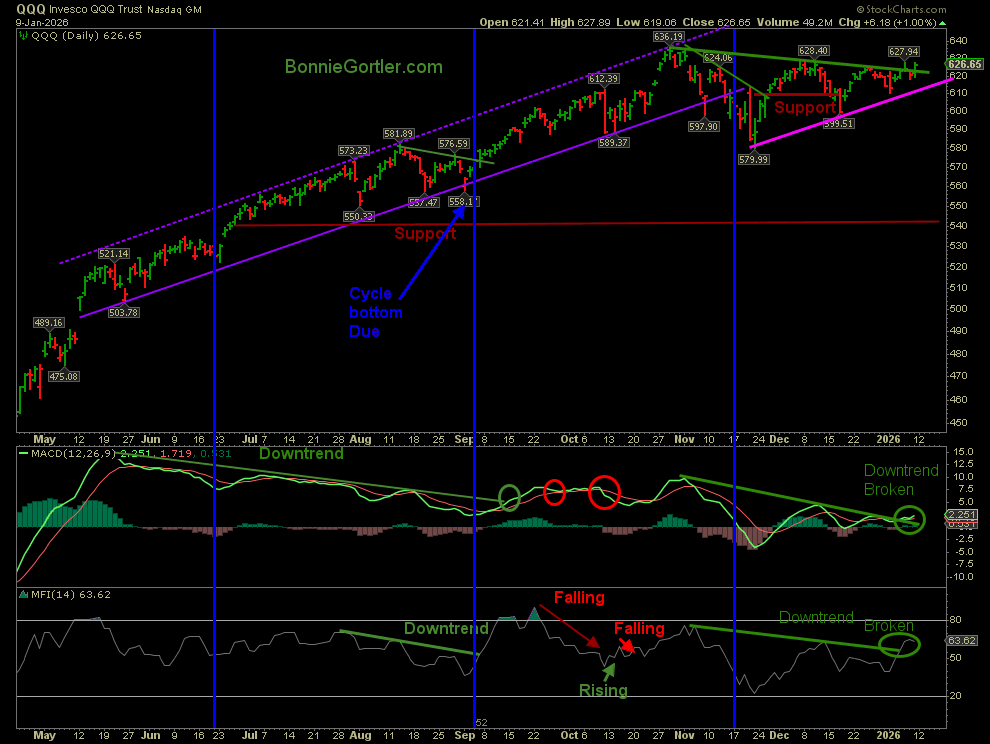
Figure 7: QQQ Daily Invesco QQQ Trust (QQQ) Price 12-26-9 MACD (Middle), and Money Flow (Bottom)
010926 QQQ Daily
The chart shows the Invesco (QQQ), an exchange-traded fund based on the Nasdaq 100 Index.
QQQ rose +2.21% last week, closing in the upper range of Friday’s trading. There was no help from Apple (AAPL) and NVIDIA (NVDA), which make up 16.44% of QQQ. Watch if this weakness continues.
Its positive QQQ downtrend broke in Price, Momentum (MACD), and Money Flow MFI.
Summing Up:
All major averages were higher last week. Market breadth turned up. Semiconductors and Small Caps led, which is positive for the broad market. New Lows on the New York Stock Exchange closed in a low-risk zone. Support levels continue to remain intact on the major averages. Until support levels break and the New Lows on the NYSE expand over 150, higher prices are likely. Manage your risk, and your wealth will grow.
If you would like to get to know each other better, schedule your Free 30-minute Wealth Building Strategy Session today. Register Here.


Create more wealth in your life
with these simple strategies.
As an added bonus you will also
receive BG’s Updates and Ezine

Discover how to quickly create more well-being in your life with these simple strategies.
As an added bonus you will also
receive BG’s Updates and Ezine

As an added bonus you will receive BG’s Updates and Ezine

All work listed on BonnieGortler.com is licensed under a Creative Commons Attribution - Noncommercial - No Derivative Works 3.0 Unported License.
