

Bonnie’s Market Update 2/13/26
02/15/2026
Tech stocks were hit hard on AI concerns last week. Six of the eleven S&P SPDR sectors were higher. Materials (XLB) and Financials (XLF) were the strongest sectors, while Utilities (XLU) and Technology (XLK) were the weakest. The SPDR S&P 500 ETF Trust (SPY) fell by -0.57%.
S&P SPDR Sector ETFs Performance Summary 12/5/25 -12/12/25
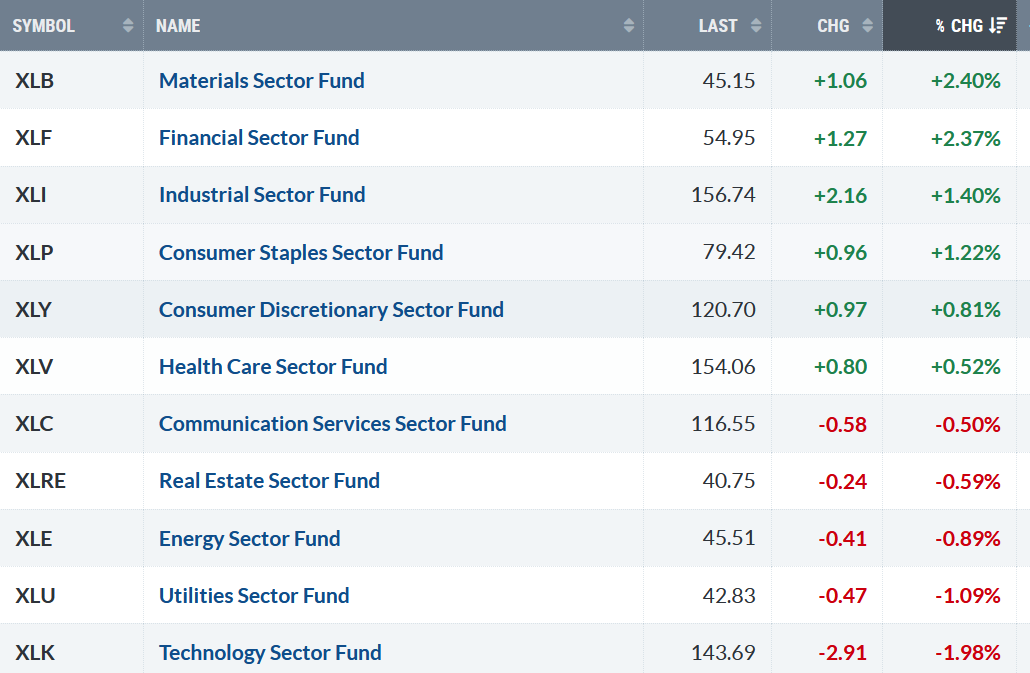
121225 SPDR Sectors
Source: Stockcharts.com
Figure 2: Bonnie’s ETFs Watch List Performance Summary 12/5/25 -12/12/25
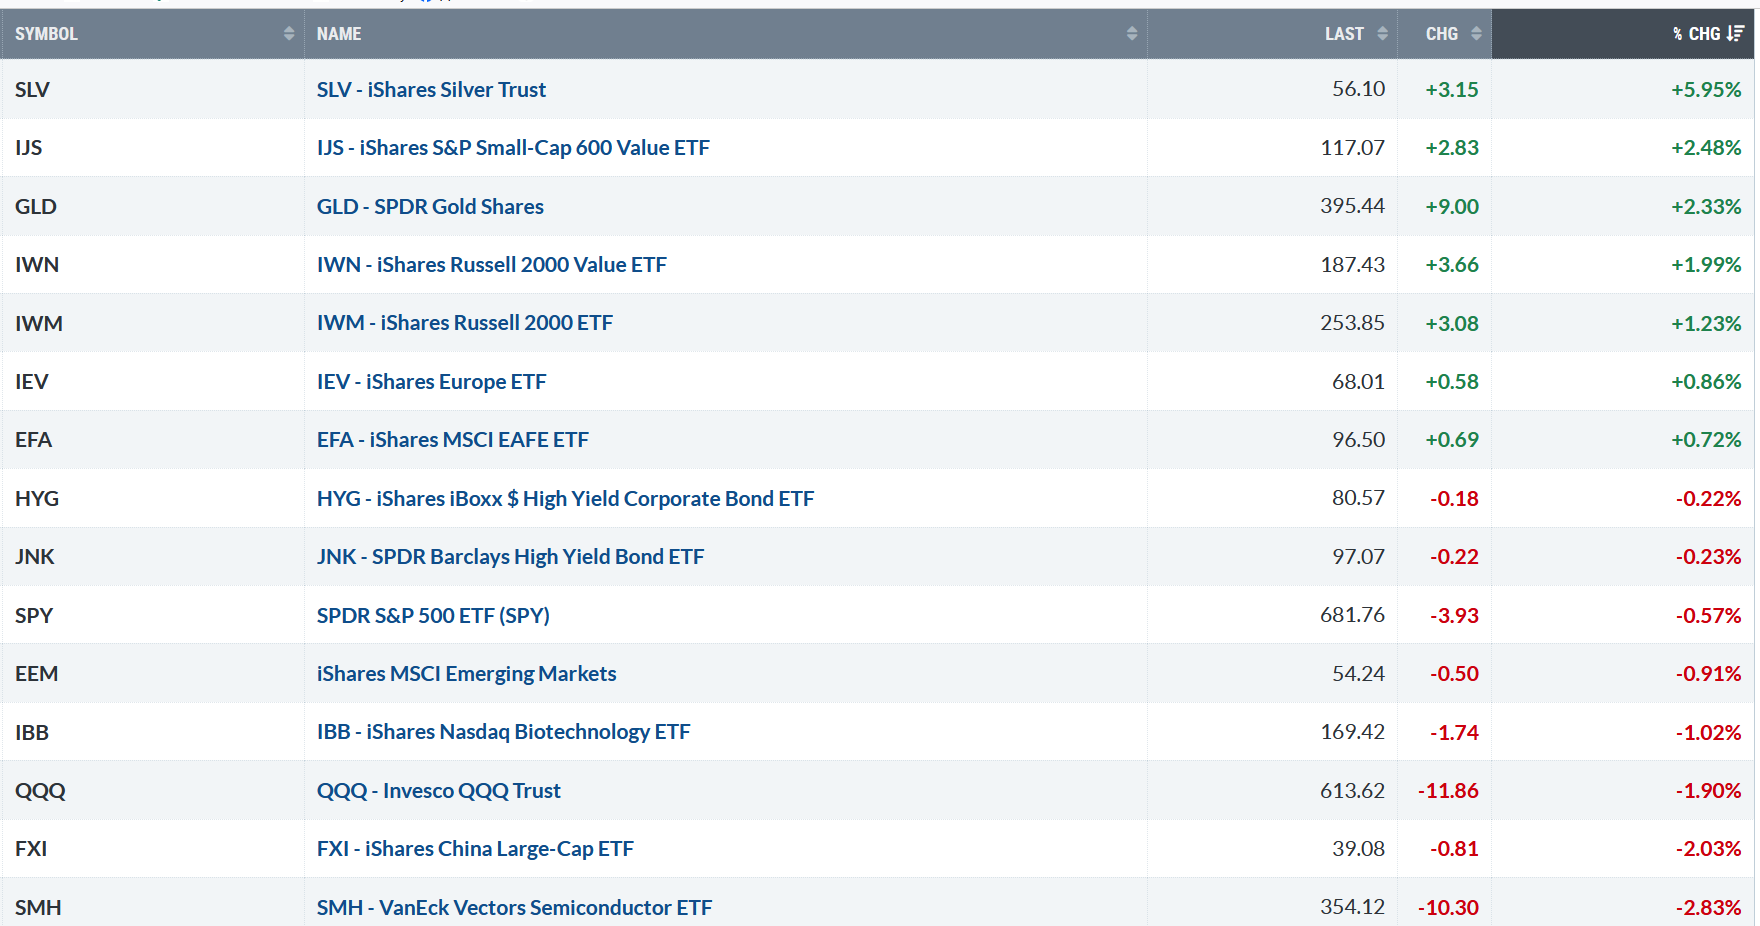
121225 Bonnie’s ETF Watch
Source: Stockcharts.com
Silver, Small Caps (both Growth and Value), led, while Technology lagged last week.
Figure 3: S&P 500 Price and NYSE, SPX, Mid and Small Cap AD Lines
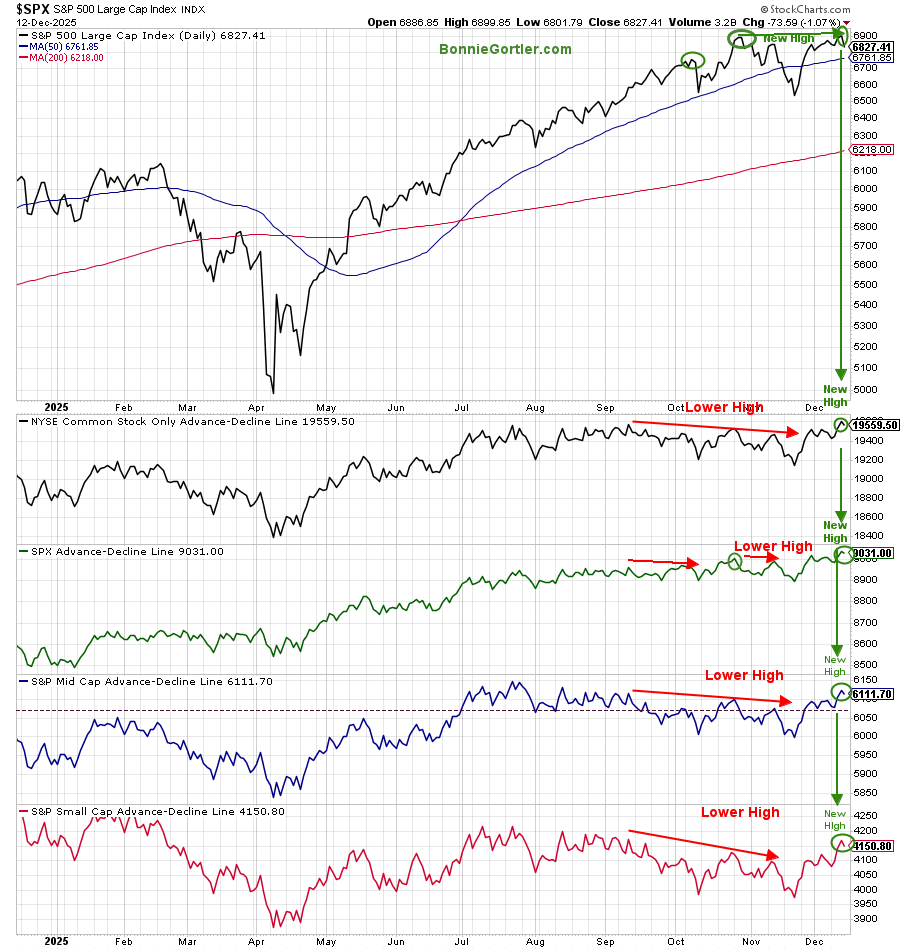
121225 S&P 500 Price and NYSE, SPX, Mid and Small Cap AD Lines
Source: Stockcharts.com
NYSE (chart 2), S&P 500 (chart 3), Mid Cap (chart 4), and Small Cap (chart 5) Advances Decline Lines all made new highs, nullifying the earlier negative divergence, confirming the new highs in the S&P 500 Index (top chart).
The New highs in the AD lines have negated the earlier negative divergences, implying that any decline is unlikely to be the final peak.

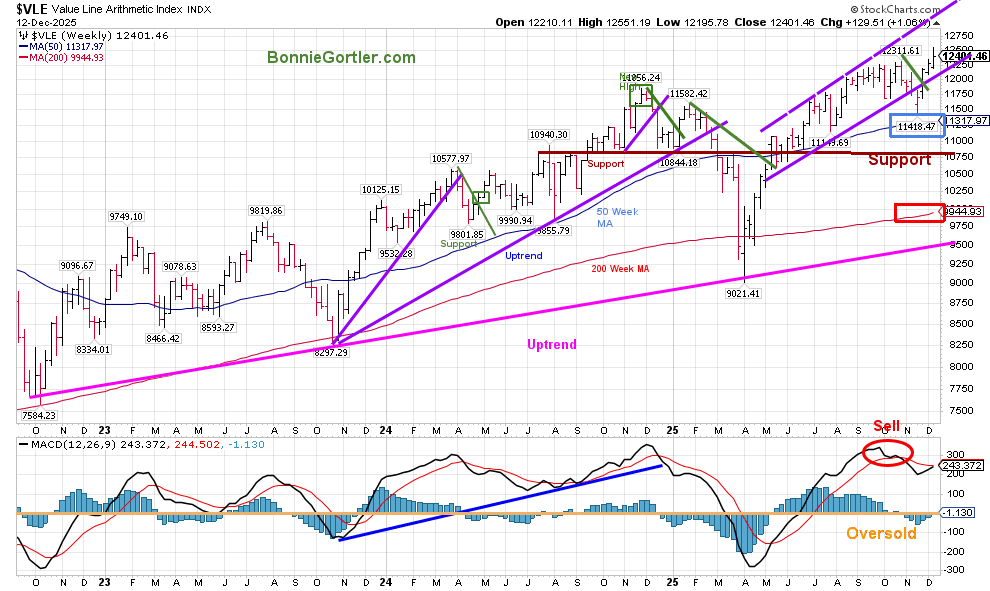
121225 VLE Weekly
Source: Stockcharts.com
The Value Line Arithmetic Index ($VLE) is composed of approximately 1,700 stocks.
The VLE intermediate uptrend, which began in October 2022 (pink line), remains in effect.
VLE made a new high after the May uptrend (purple line) had a false breakdown. VLE closed above its rising 50-week MA (blue rectangle) and the 200-week MA (red rectangle), continuing to imply underlying strength.
Support is at 12000, 11400, and 10750. Resistance is 12555.
MACD (lower chart) remains on a sell signal, rising above 0. No fresh buy is possible.
A weekly close above 12555 would imply further gains toward the upper channel (purple dotted line). On the other hand, a weekly close below 12000 would indicate a pullback towards support at 11400 and 10750.
Learn how to implement a powerful wealth-building mindset and charting strategies to help you grow your wealth in the comfort of your home in my eCourse Wealth Through Investing Made Simple. Learn more here.
Figure 5: Fear & Greed Index
121225 VLE Weekly
Source. CNN.com
Investor sentiment, as measured by the Fear and Greed Index (a contrarian indicator), closed at 42, indicating Fear despite the major averages trading only a few percent below all-time highs.
Figure 6: CBOE 10YR U.S. Treasury Yield Daily
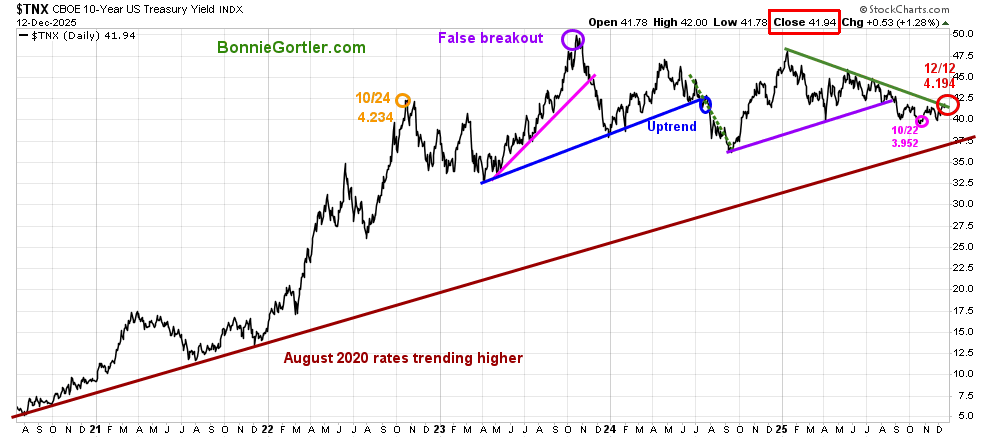
121225 $TNX – CBOE 10-Year US Treasury Yield
Source: Stockcharts.com
The long-term yield uptrend in 10-year U.S. Treasuries that began in August 2020 persists.
The Federal Reserve cut interest rates last week for a third straight meeting. However, the 10-year U.S. Treasury Yield continued rising last week, closing at 4.194%.
Yields falling below 3.950% would be positive, while yields closing above 4.30% are likely to be negative for equities.
Learn how to implement a powerful wealth-building mindset and charting strategies to help you grow your wealth in the comfort of your home in my eCourse Wealth Through Investing Made Simple. New Module 7: Trading Alerts That Build Confidence and Reduce Risk. Learn more here.
Figure 7: NYSE New Lows
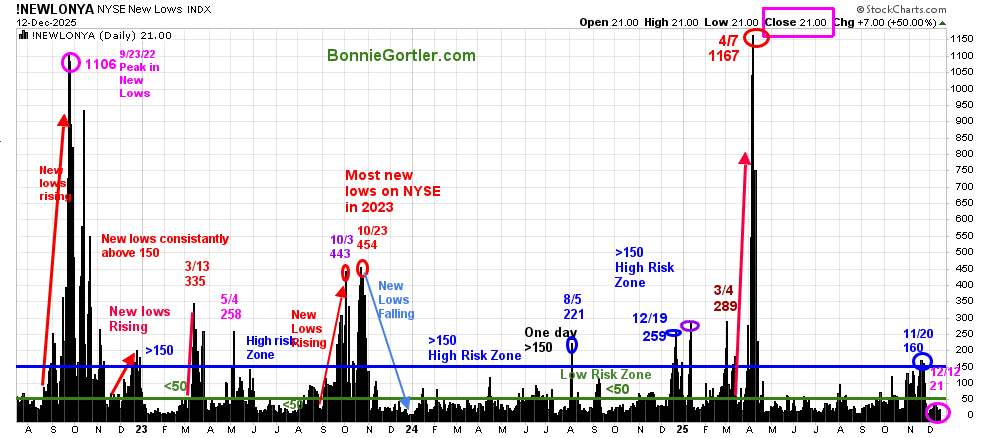
121225 NYSE New Lows
Source: Stockcharts.com
New Lows On The NYSE peaked at 1167 on 4/7/25, then contracted sharply as the market bottomed in April.
New Lows closed Friday, 12/13, at 21, in the very low-risk zone, where prices tend to rise. It will remain positive in the short term if New Lows stay between 25 and 50. On the other hand, if new lows begin to increase and exceed 150, it would be short-term negative with more volatility and increased risk expected.
Learn more about the significance of New Lows in my book, Journey to Wealth, published on Amazon. For a chapter preview of Journey To Wealth, visit here.
Figure 8: CBOE Volatility Index (VIX)
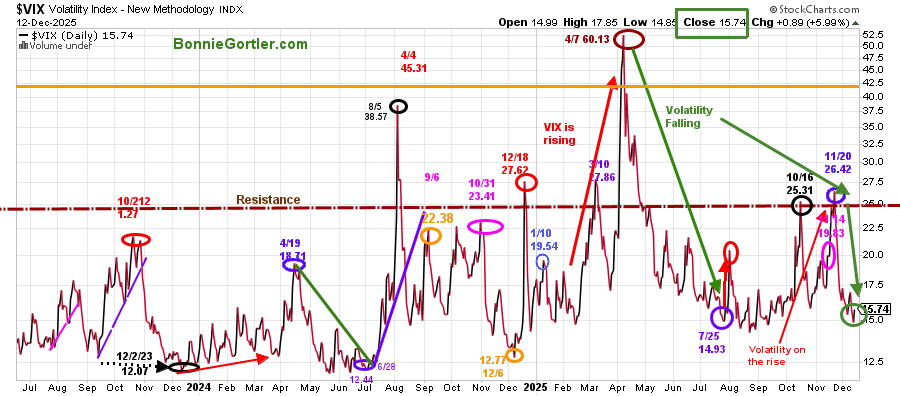
121225 VIX Daily
Source: Stockcharts.com
The CBOE Volatility Index (VIX), a measure of Fear, peaked this year on April 7.
The VIX rose slightly last week, closing at 15.74, a low reading despite the pressure in the Nasdaq. As long as VIX is stable, intraday volatility is likely to be contained.
Two closes above 25.00 would imply the VIX could jump to 32-40 quickly.
Discover how to cultivate a powerful wealth-building mindset and effective charting strategies to grow your wealth from the comfort of your own home in my eCourse, “Wealth Through Investing Made Simple,” including the New Module 7: Trading Alerts That Build Confidence and Reduce Risk. Learn more here.
Figure 9: S&P 500 Weekly (SPY) and 12-26-9 MACD (Middle), and Money Flow (Bottom)
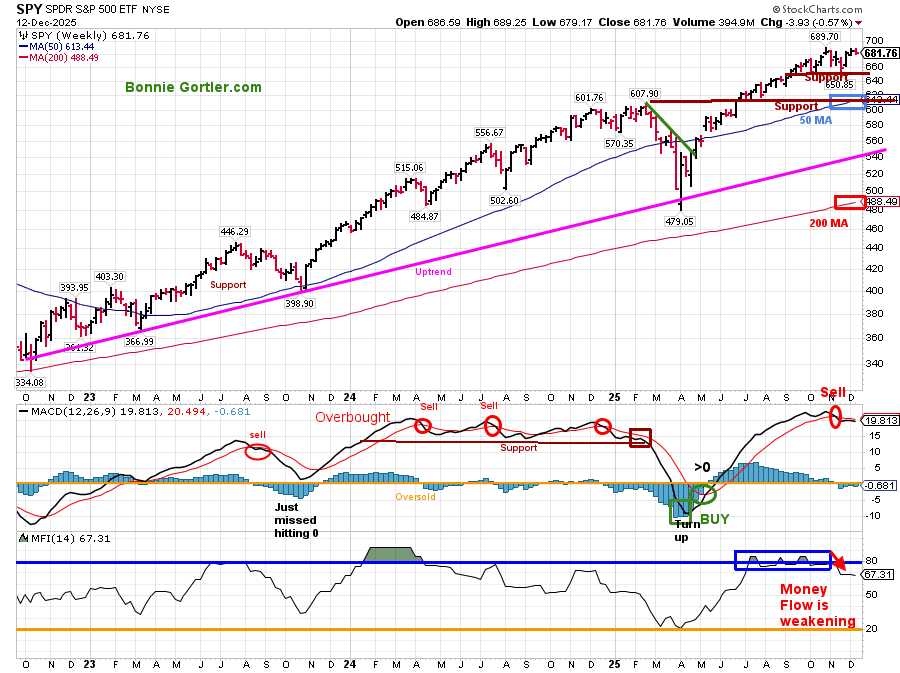
121225 SPY Weekly
Source: Stockcharts.com
The S&P 500 (SPY) from October 2022 remains. After hitting a low in April 2025, SPY consolidated its gains and has continuously made new all-time highs.
The S&P 500 fell -0.57% last week. Keep an eye on the S&P 500’s top holdings, which comprise almost 40% of the index and include Nvidia, Apple, Microsoft, Amazon, Avgo, Alphabet, and Meta. Due to the significant weighting, as these stocks perform, the S&P 500 will likely follow. If you want to look at these charts together, email me at Bonnie@BonnieGortler.com to schedule a time to talk.
The MACD (middle chart), a momentum indicator, has given a sell signal.
The Money Flow Index (MFI) hit 80 in July, followed by a sideways move. However, MFI has turned lower, suggesting that money is shifting out of the S&P 500.
Summing Up:
The intermediate upside projection remains at 700.00. SPY has been resilient with only minor retracements along the way. However, it’s clear now that momentum and Money Flow are weakening, which will make it harder to make money if the top holdings in the S&P 500 weaken. A weekly close below 670.00 would imply a pullback toward 650.00, 640.00, 620.00, and potentially 600.00.
I invite you to join my Charting Facebook Group. Learn more about it here: Wealth Through Market Charts.
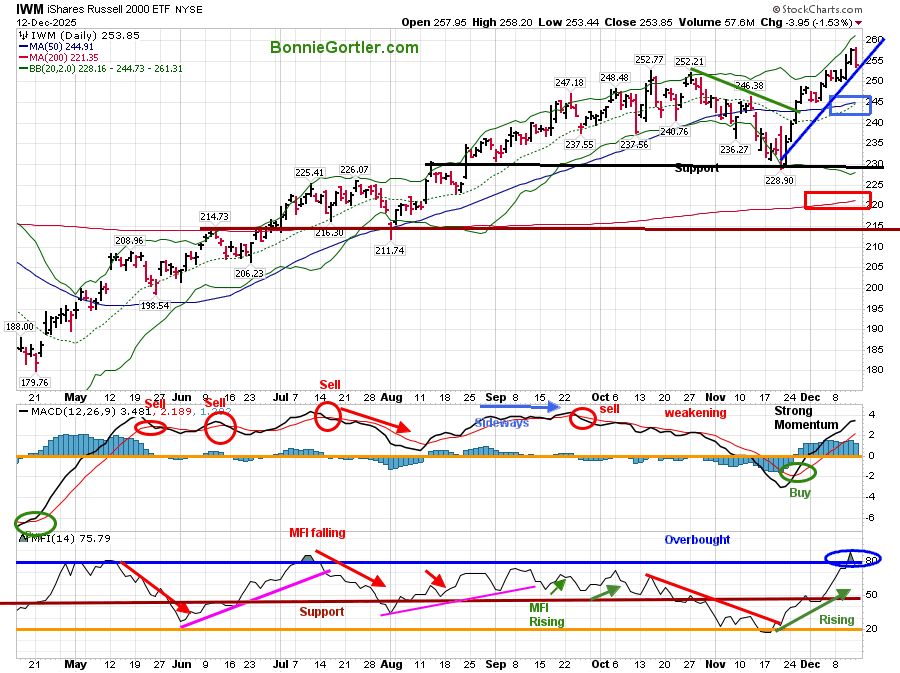
Figure 10: Daily iShares Russell 2000 (IWM) Price (Top),12-26-9 MACD (Middle), and Money Flow (Bottom)
121225 IWM Daily
Source: Stockcharts.com
The iShares Russell 2000 Index ETF (IWM) rose +1.23% for the week, outperforming the S&P 500.
The IWM uptrend from November (blue line) remains intact despite IWM falling by -1.53% on Friday. IWM remains above both the 50-day (blue rectangle) and 200-day (red rectangle) moving averages, suggesting underlying strength.
Support is at 245.00, 230.00, and 220.00. Resistance is at 258.00.
The MACD (middle chart) has been rising since November and remains on a buy signal, after resetting below 0.
The Money Flow (lower chart) rose in November, turned down after reaching 80, and may need some time to consolidate.
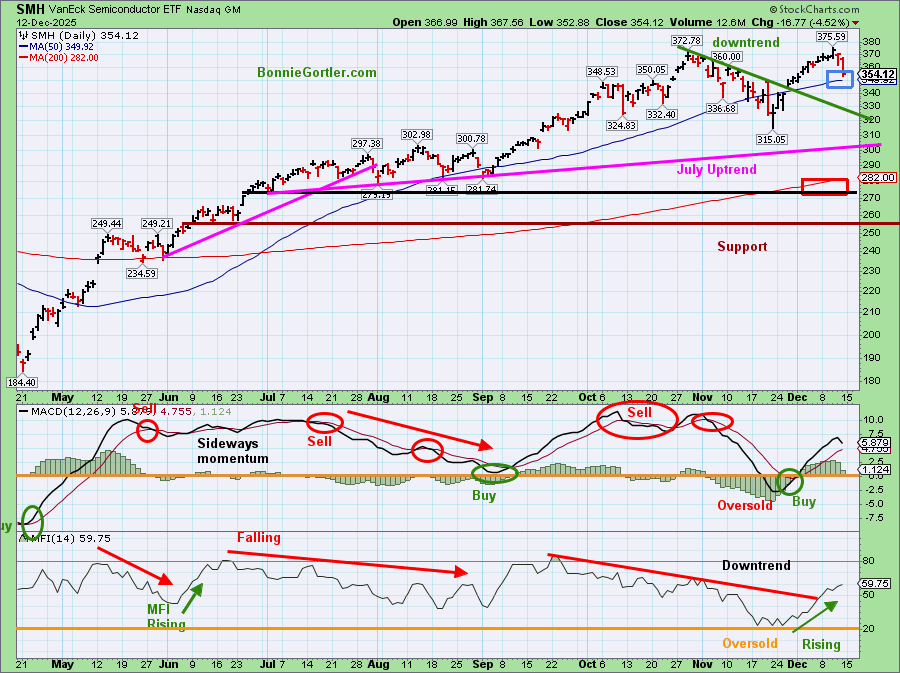
Figure 11: Daily Semiconductors (SMH) (Top), 12-26-9 MACD (Middle), and Money Flow (Bottom)
121225 SMH Daily
Source: Stockcharts.com
The top chart shows the Daily Semiconductor (SMH) ETF, which is concentrated mainly in US-based Mega-Cap Semiconductor companies. SMH can be highly volatile. SMH tends to be a leading indicator for the market when investors are willing to take on increased risk, and the opposite is true when the market is falling.
The July uptrend (pink line) remains. SMH was under heavy selling pressure, falling -4.52% on Friday, but only -2.83% for the week.
SMH remains above the 50-day MA (blue rectangle) and the 200-day MA (red rectangle), which is positive.
Support is at 350.00, 327.00, 310.00, and 280.00. Resistance is at 370.00 and 376.00.
The MACD (middle chart) remains on a buy signal, falling above 0.
The Money Flow (lower chart) continues to rise, which is positive in the short term.
As long as SMH closes above 327.00, I believe it is too early to give up on the Semiconductors. Time will tell.
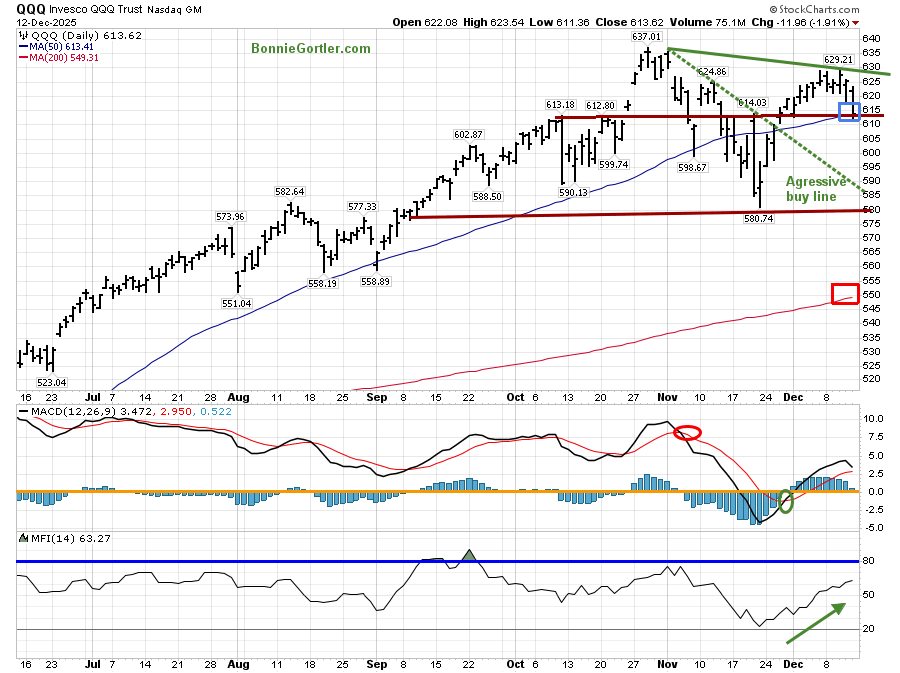
Figure 12: QQQ Daily Invesco QQQ Trust (QQQ) Price (Top), 12-26-9 MACD (Middle), and Money Flow (Bottom)
121225 QQQ Daily
The top chart shows the Invesco (QQQ), an exchange-traded fund based on the Nasdaq 100 Index.
Nasdaq 100 (QQQ) closed near its low on Friday as investors dumped Technology stocks for Value stocks, finishing the week down by -1.9% to 613.62, closing near the first support area (brown line) and the 50-Day MA (blue rectangle).
Support is at 597.00, 590.00, 580.00, and 550.00.
Although investors have begun to rotate out of Technology stocks, Technology has fueled the rally in 2025; it’s too early to say this trend is over.
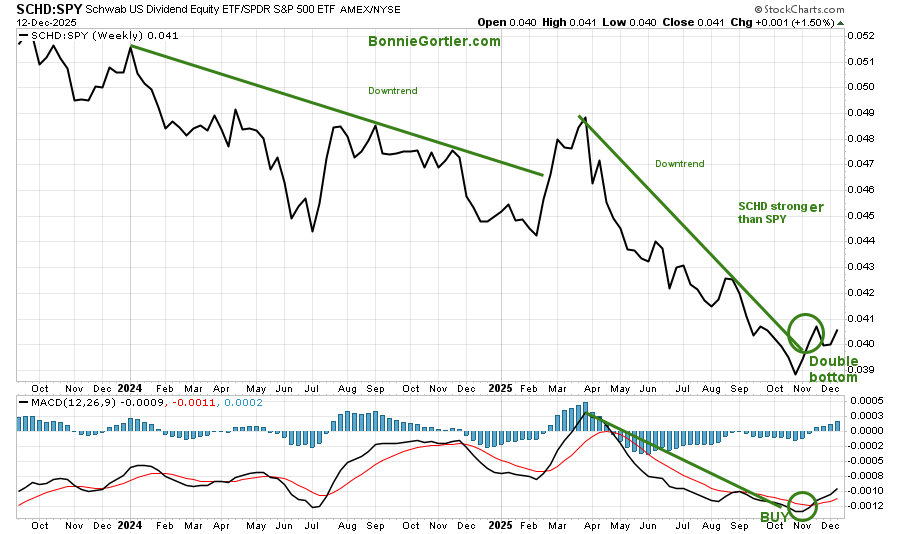
Figure 13: Schwab US Dividend Equity ETF (SCHD) /S&P 500 (SPY) Relative Strength Ratio
121225 SCHDSPY – Schwab US Dividend Equity ETF SPDR S&P 500 ETF
Source: Stockcharts.com
Defensive sectors have improved with selling pressure on aggressive stocks. The Dividend Equity ETF’s relative strength ratio has turned up, breaking the March downtrend relative to the S&P 500, and has formed a double bottom.
The MACD lower chart did generate the buy signal, confirming the relative strength breakout mentioned in the 11/14/25 Market Update.
Figure 14: SCHD Top 10 Holdings
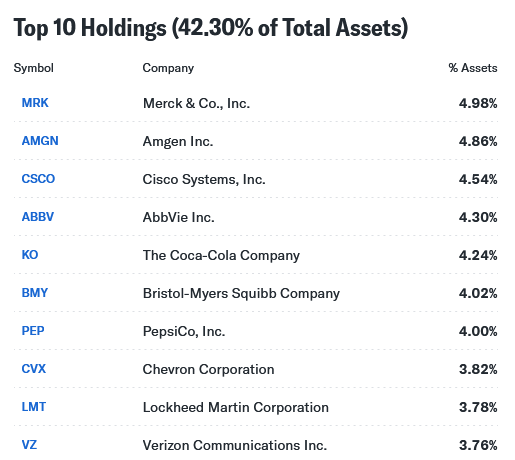
121225 SCHD top holdings
Source: Yahoo Finance
Figure 15: Schwab US Dividend Equity ETF
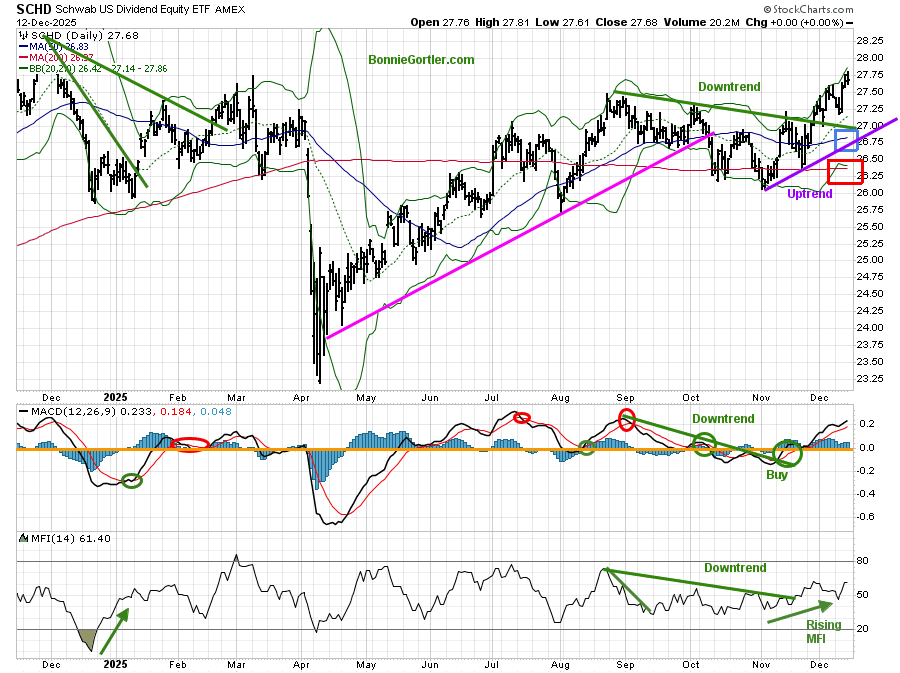
121225 SCHD Daily
Source: Stockcharts.com
Schwab US Dividend Equity ETF (SCHD) gives exposure to dividend-paying U.S. equities. The most recent dividend was 0.278 on 12/10/25.
SCHD broke its September downtrend (green line) and is attracting buyers. SCHD gained +0.91% last week and remains in its November uptrend with a favorable pattern of higher lows and higher highs. Value is gaining relative strength over growth stocks, prompting some investors to rotate out of aggressive market sectors. Time will tell whether this phenomenon will continue or be short-lived, as it has in recent years.
MACD (middle chart) remains on its November buy signal, rising above 0, and has broken the September momentum downtrend, which is positive.
Money Flow is rising and has also broken its August downtrend.
Support is 26.80, and resistance is 28.33 (November 24 high), with a first upside objective of 29.50. Two closes below 26.80 would negate the 29.50 objective.
Summing Up:
The Dow rose while the Nasdaq and the S&P 500 fell last week. AI stocks faced heavy selling pressure, which became a catalyst for a broader market sell-off on Friday. Semiconductors and Technology ETFs were sharply lower. Market breadth has improved recently and is no longer flashing negative divergences, implying that any decline is likely short-lived and to be followed by another rally. This time of year is historically favorable, but expect higher intraday volatility as investors and institutions continue to rebalance their portfolios to adjust risk and make tax-related changes. Until support levels break, the bulls continue to get the benefit of the doubt. Manage your risk, and your wealth will grow.
If you would like to get to know each other better, schedule your Free 30-minute Wealth Building Strategy Session today. Register Here.


Create more wealth in your life
with these simple strategies.
As an added bonus you will also
receive BG’s Updates and Ezine

Discover how to quickly create more well-being in your life with these simple strategies.
As an added bonus you will also
receive BG’s Updates and Ezine

As an added bonus you will receive BG’s Updates and Ezine

All work listed on BonnieGortler.com is licensed under a Creative Commons Attribution - Noncommercial - No Derivative Works 3.0 Unported License.

2 thoughts on “Bonnie’s Market Update 12/12/25”