

Bonnie’s Market Update 4/12/24
04/14/2024
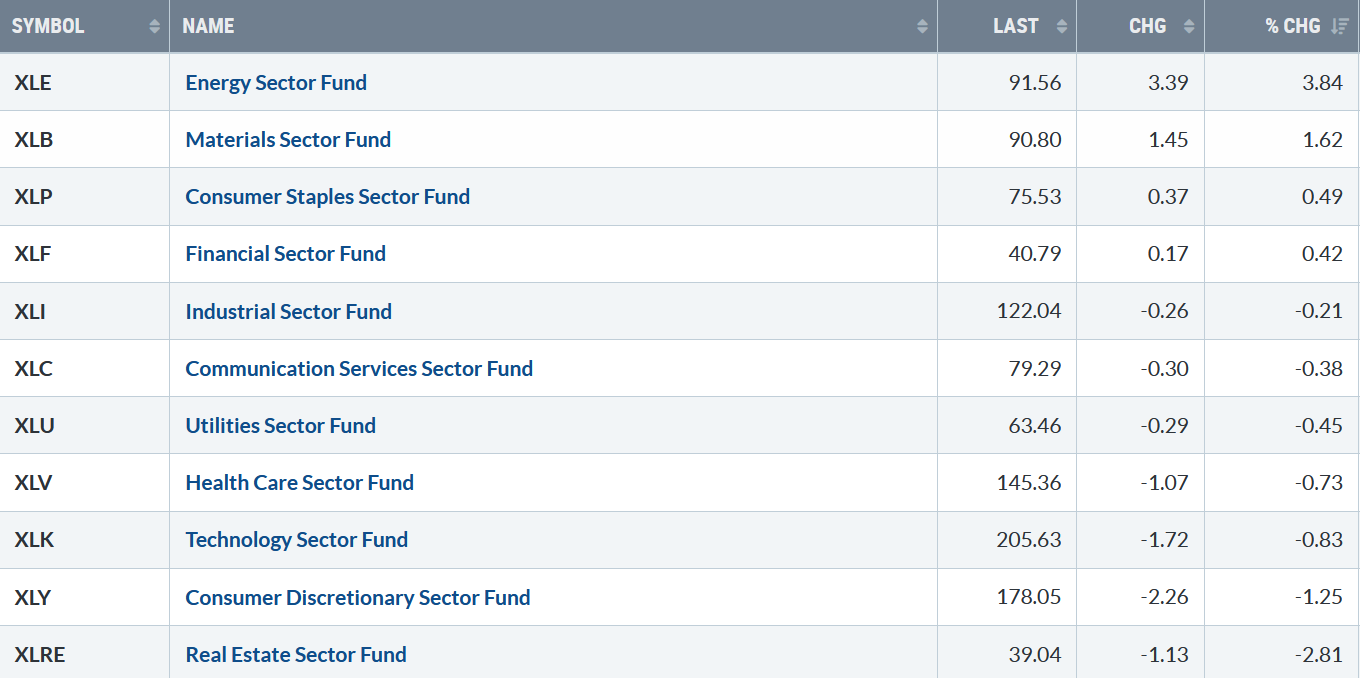
The tone changed last week as only four of the eleven S&P SPDR sectors finished higher. Energy (XLE) and Materials (XLB) were the best sectors, while Consumer Discretionary (XLY) and Real Estate (XLRE) were the weakest. The SPDR S&P 500 ETF Trust (SPY) was down -0.06%.
S&P SPDR Sector ETFs Performance Summary 3/8/24-3/15/24
031524 SPDR Sectors
Source: Stockcharts.com
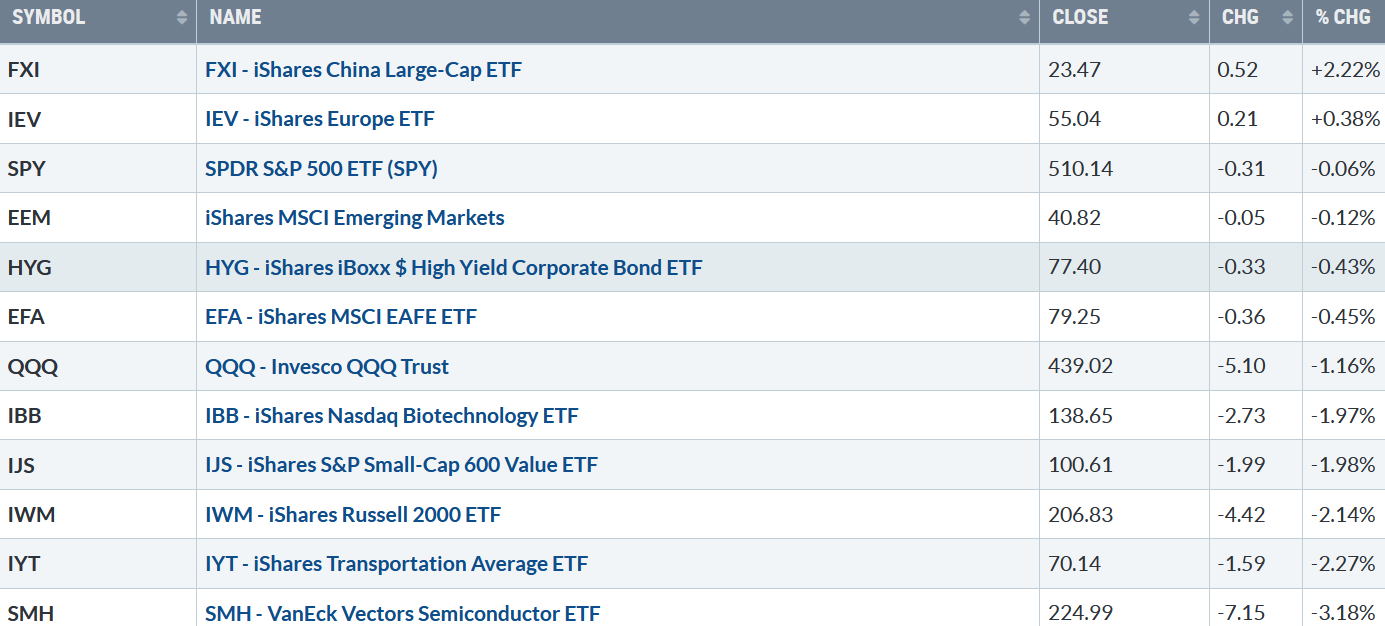
Figure 2: Bonnie’s ETFs Watch List Performance Summary 3/8/24-3/15/24
031524 Bonnie’s ETFs
Source: Stockcharts.com
China led, no longer lagging, as Semiconductors continued to show weakness. Selling pressure was also present in Transports, Small-Cap Growth and Value, and Biotechnology.
Do you want more knowledge about the stock market? Learn how to implement a powerful wealth-building mindset and simple, reliable strategies to help you grow your wealth. Check out my eCourse Wealth Through Investing Made Simple Here.
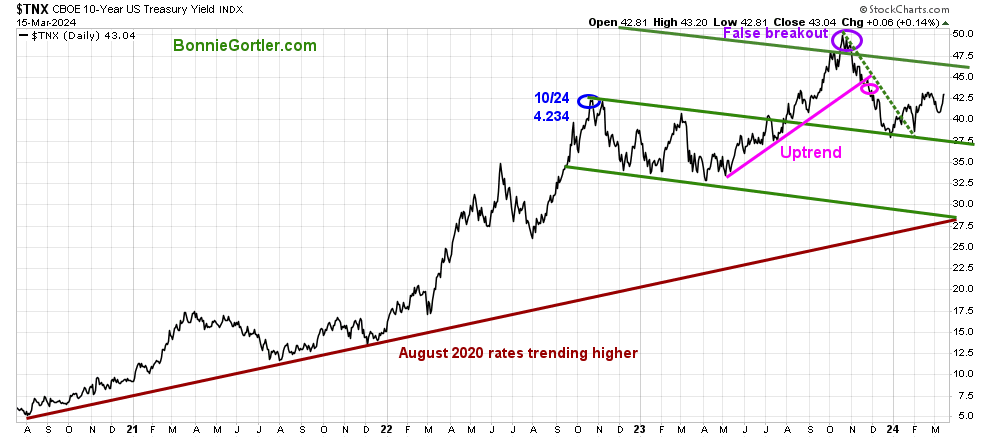
Figure 3: UST 10YR Bond Yields Daily
031524 UST 10 Yr Bond Yields Daily
Source: Stockcharts.com
The 10-year U.S. Treasury rose last week, closing at 4.304%. Rising yields could cause selling pressure in U.S. Equities, while falling yields will likely support further gains.
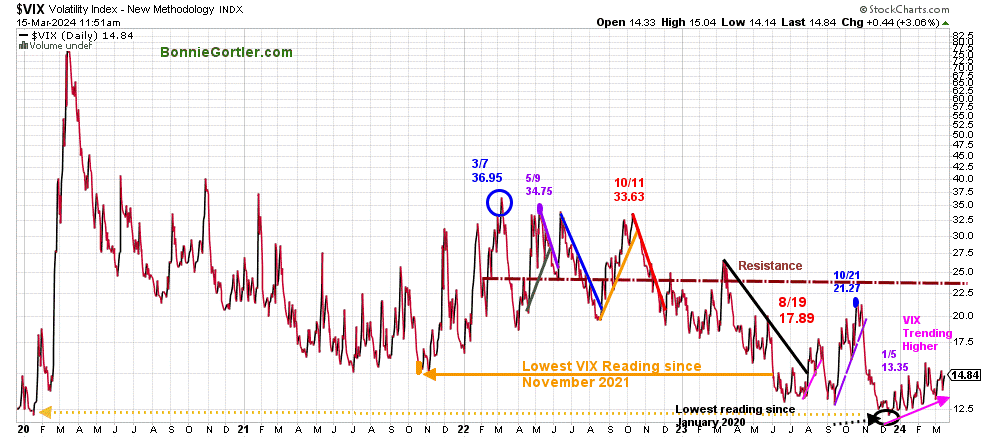
Figure 4: CBOE Volatility Index VIX
031524 VIX Daily
Source: Stockcharts.com
The CBOE Volatility Index (VIX), a measure of fear, traded above 20.00 for most of 2022, with a high at 36.95 on 3/7 (blue circle on the left), which did not get violated in 2023.
Since December 2023, VIX has been trending higher but remains low, closing at 14.41. If the VIX remains below 16, intraday volatility will be limited. On the other hand, if VIX closes above 16.00, daily volatility will likely increase.
The major market averages were lower last week. The Dow fell -0.02%, the S&P 500 fell -0.13%, while the Nasdaq dropped -0.70%. The Russell 2000 Index performed the worst, down -2.08%.
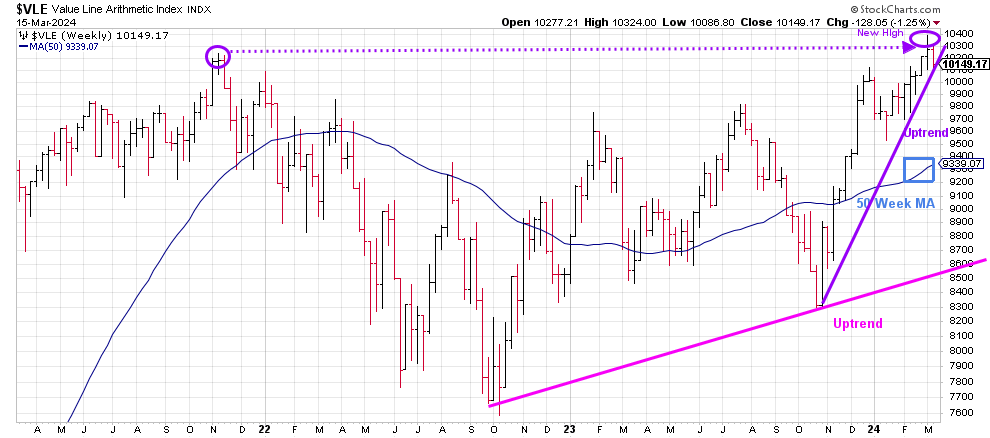
Figure 5: Weekly Value Line Arithmetic Average
031524 VLE Weekly
Source: Stockcharts.com
The top Chart is the weekly Chart of the Value Line Arithmetic Index ($VLE), which includes approximately 1700 stocks.
VLE fell -1.25% for the week, closing at 10149.17, remaining in an uptrend (pink line) from October 2022 but threatening to break the uptrend from November 2023 (purple line).
VLE remains above the rising 50-week MA (blue rectangle), a key level I would like to see held if the decline accelerates. As of this writing, it stands at 9339.07.
The first support is at 10000, followed by 9700 and 9300.
It will be short-term positive if VLE holds above last week’s low of 10086.80. However, selling pressure will likely increase if VLE closes below.
Do you want to go deeper into charting? Learn more in the comfort of your home today with my Free 33-minute Training, Charting Strategies to Cut Risk and Trade with the Trend. Sign up here.
Weekly market breadth was negative on the New York Stock Exchange Index (NYSE) and for the Nasdaq. The NYSE had 1195 advances and 1725 declines, with 459 new highs and 87 new lows. There were 1518 advances and 3049 declines on the Nasdaq, with 386 new highs and 332 new lows.
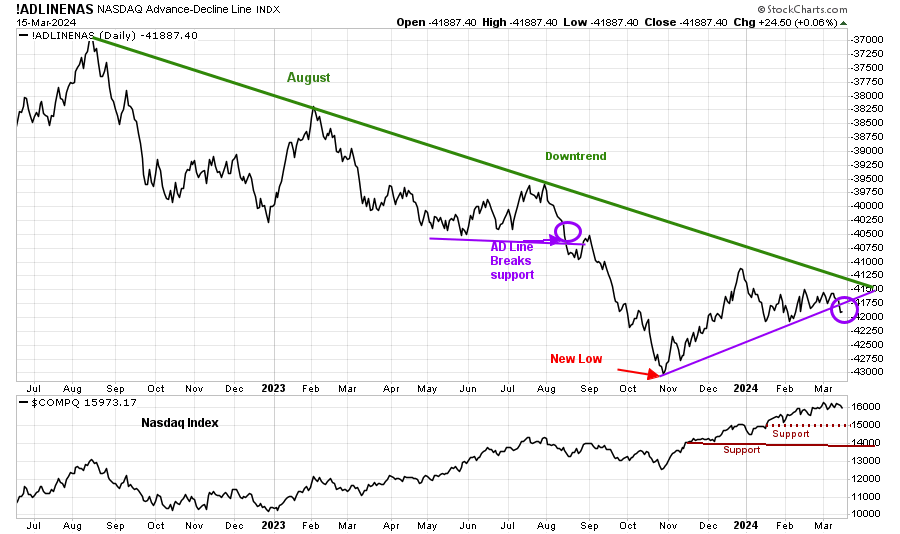
Figure 6: Nasdaq Advance Decline Line Daily (Top) and Nasdaq (Bottom)
031524 Daily Nasdaq Cumulative Advance-Decline Line
Source: Stockcharts.com
The top Chart is the Nasdaq Daily Advance-Decline Line, a technical indicator that plots the difference between the number of advancing and declining stocks.
The uptrend from October broke last week (purple line), warning risk is increasing in the short term, stock selection is more significant before making new purchases, and making money could be more challenging. On the other hand, if the downtrend from August 2022 (solid green line) is penetrated, it would be bullish for the longer term, implying a broadening of the Nasdaq rally.
Are you interested in learning more about the stock market? Learn how to implement a powerful wealth-building mindset and simple, reliable strategies to help you grow your wealth. Check out my eCourse Wealth Through Investing Made Simple. Get information HERE.
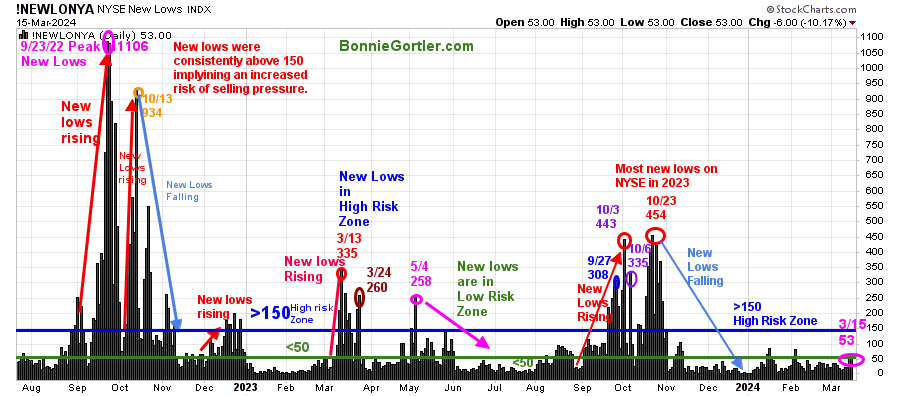
Figure 7: Daily New York Stock Exchange (NYSE) New Lows
031524 NYSE New Lows Daily
Source: Stockcharts.com
Watching New Lows on the New York Stock Exchange is a simple technical tool that helps increase awareness of the direction of an immediate trend.
For most of 2022, new lows warned of a potential sharp pullback, high volatility, and “panic selling,” closing above 150. The peak reading of New Lows in 2022 was on 9/23 at 1106, not exceeded in 2023.
Last week, new lows on the NYSE rose to 53 from 15 (pink circle), and they are no longer in the lowest-risk zone below 25 and are starting to inch up. It remains positive that New Lows are below 150. A rise above would be a warning sign of a market correction.
Learn more about the significance of New Lows in my book, Journey to Wealth, published on Amazon. If you would like a preview, get a free chapter here.
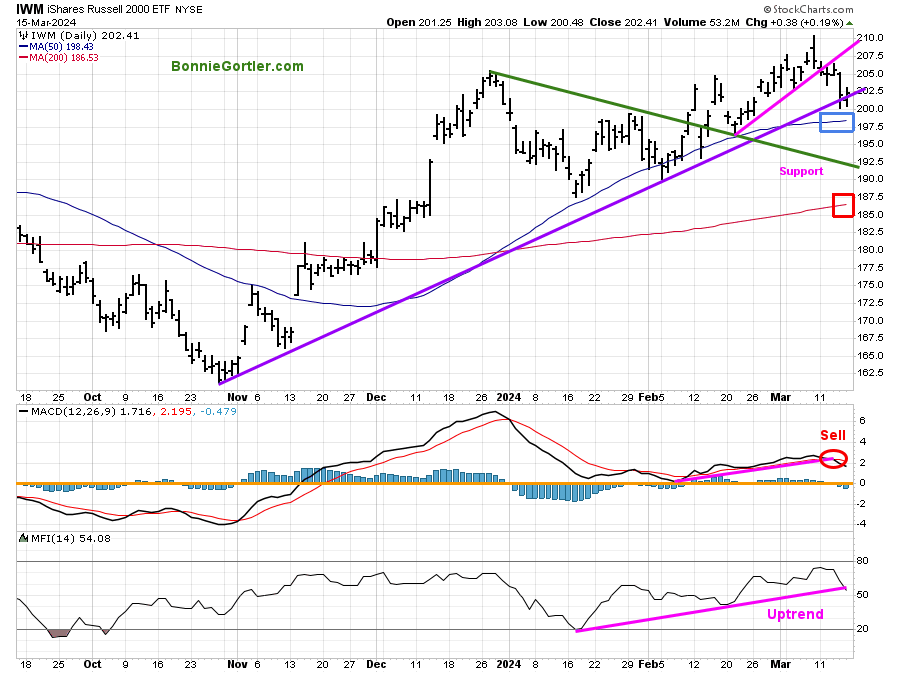
Figure 8: Daily iShares Russell 2000 (IWM) Price (Top) and 12-26-9 MACD (Middle and Money Flow (Bottom)
031524 IWM Daily
Source: Stockcharts.com
The top Chart is the daily iShares Russell 2000 Index ETF (IWM), the benchmark for small-cap stocks, with a 50-Day Moving Average (MA) (blue rectangle) and 200-Day Moving Average (MA) (red rectangle) that traders watch and use to define trends.
The uptrend from November 2023 is in question. IWM closed slightly above the uptrend and fell below intraday on Thursday and Friday, setting off stops but not following through to the downside. IWM remains above both the 50 and 200-day MA. Two closes below the 50-day MA would hit sell stops.
IWM was much weaker than the major averages, down -2.14%, breaking below support at 205.00 and closing at 202.41 last week.
Support is at 197.50, 192.50 and 185.00. Resistance is at 203.00, 205.00, and 210.00.
MACD (middle Chart) generated a sell last week, above 0 and falling.
Money flow (lower Chart) turned down and is close to breaking the January uptrend; if broken, it would be short-term bearish.
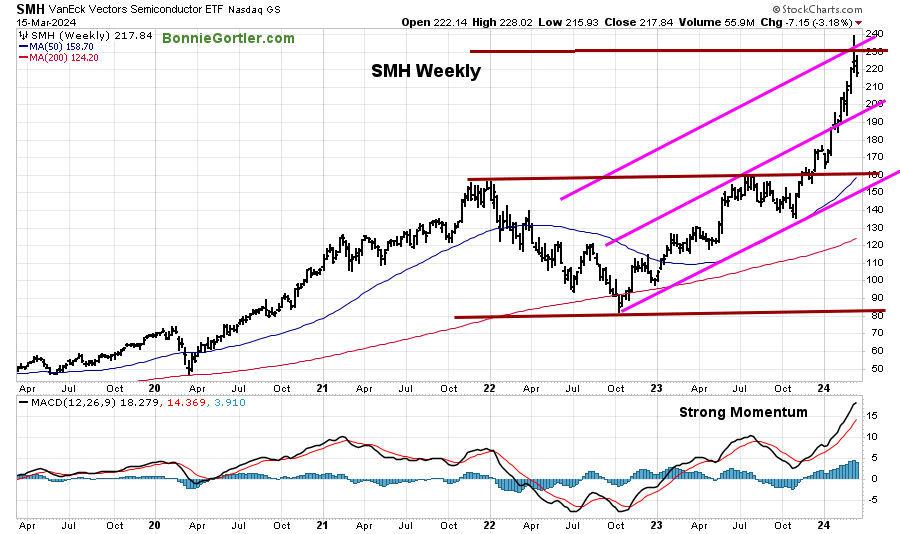
Figure 9: Weekly Semiconductors (SMH) (Top) and 12-26-9 MACD (Bottom)
031524 SMH Weekly
Source: Stockcharts.com
The top chart shows the Weekly Semiconductors (SMH) ETF, concentrated mainly in US-based Mega-Cap Semiconductor companies. SMH tends to be a leading indicator for the market when investors are willing to take on increased risk, and the opposite is true when the market is falling.
The Semiconductor ETF (SMH) fell -3.18% last week, closing at 217.84, continuing lower after the nasty reversal on 3/8, peaking at 239.14, hitting the top of the weekly channel (top brown line).
Support is at 195.00 and 160.00. Resistance at 220.00 followed by 230.00.
MACD (bottom chart) shows strong momentum, implying that the final top has not been made. Despite the likelihood of another test of the highs, I recommend patience before making new purchases in Semiconductor stocks in the short term, waiting for a lower-risk entry. If you are overweight or have long options, consider locking in partial gains or at least having stops in place to manage your risk in case of a sharp, quick selloff.
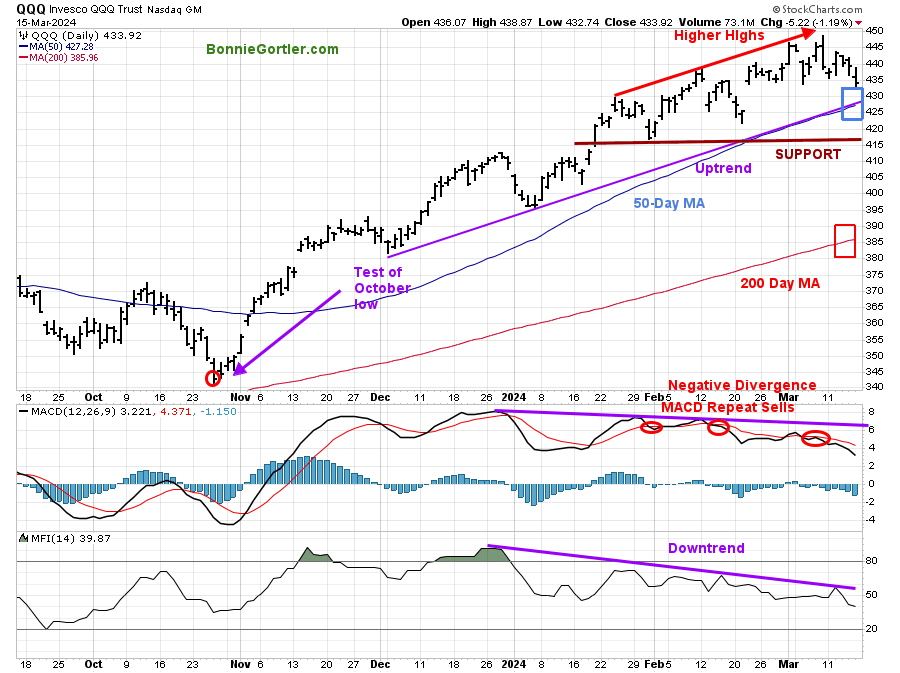
Figure 10: Daily Invesco QQQ Trust (QQQ) Price (Top) and 12-26-9 MACD (Bottom)
031524 QQQ Daily
Source: Stockcharts.com
The Chart shows the daily Invesco QQQ, an exchange-traded fund based on the Nasdaq 100 Index. QQQ made a low in October 2023 (red circle), followed by a successful retest of the low in early January 2024 and the start of an uptrend.
Last week, Nasdaq 100 (QQQ) closed at 433.92, -1.16% closing near the weekly low. QQQ remains above the rising 50-day Moving Average (blue rectangle) and the 200-day Moving Average (red rectangle), a sign of underlying strength.
Support is at 425.00, 416.00, 385.00. Two closes below 425.00 will likely increase selling pressure as investors lock in profits.
The bottom chart, MACD (12, 26, 9), remains on a sell, above 0, and falling, giving repeat sell signals with a negative divergence (higher high in QQQ but lower low in MACD) which is bearish.
Money flow (lower Chart) remains in a downtrend and falling.
Caution is recommended, as QQQ shows signs of weakening momentum and breadth.
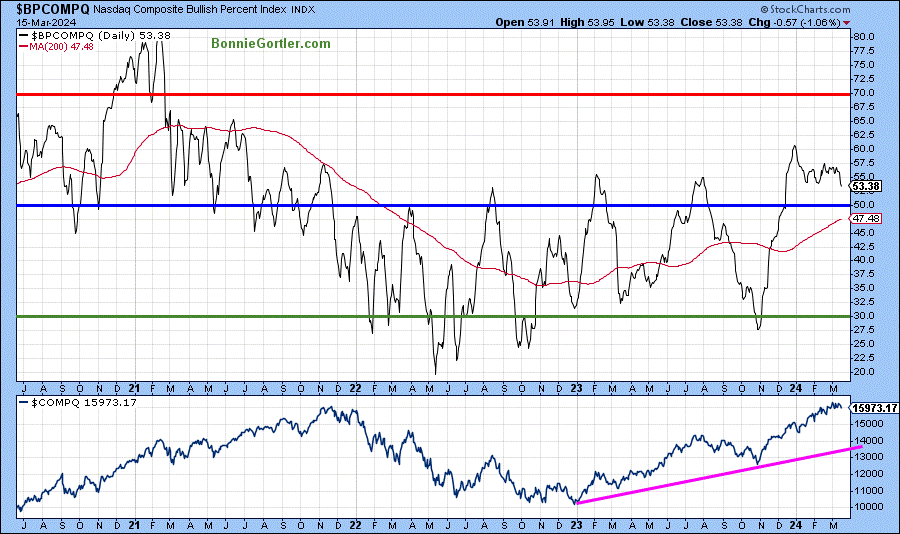
Figure 11: Nasdaq Bullish Percent Index
031524 Nasdaq Bullish Percent Index
Source: Stockcharts.com
The top Chart shows the Nasdaq Bullish Percent Index (BPI), a breadth indicator that measures the number of stocks on Point and Figure Buy signals. The indicator helps you identify the index’s strength and when it’s overbought or oversold.
When the bullish percent index is above 70%, the market is overbought, and when the indicator is below 30%, the market is oversold. Like other overbought indicators, it sometimes does not get as high or as low.
BPI made a higher high than in July of 2023 but did not reach 70 in late December and is now falling.
The risk of a potential short-term pullback or consolidation has increased unless there is an immediate expansion in market breadth.
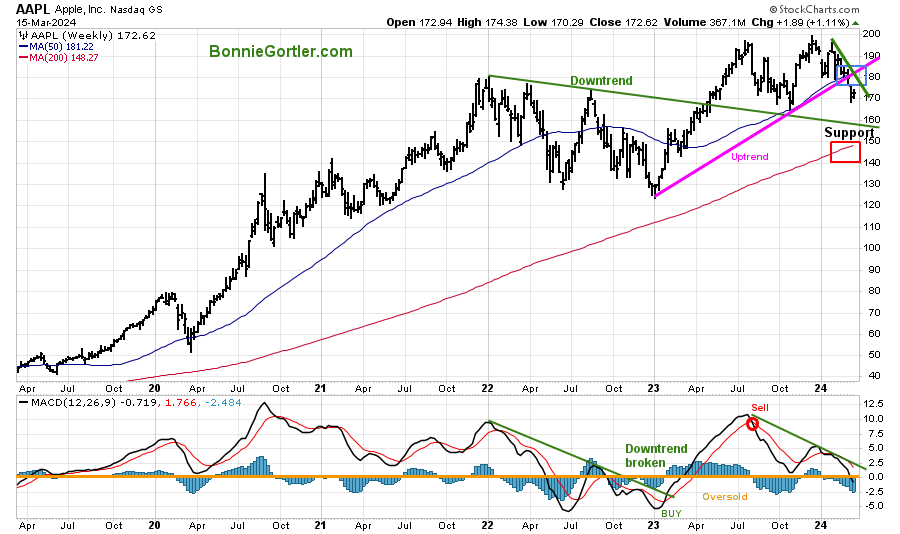
Figure 12: AAPL Weekly and 12-26-9 MACD (Bottom)
031524 AAPL weekly
Source: Stockcharts.com
The chart shows Weekly Apple (APPL) for the past five years. AAPL is one of the top holdings in QQQ and in over 300 ETFs.
AAPL rose last week +1.11% but remains below the 2023 weekly uptrend (pink line) and closed below the 50-week moving average, implying underlying weakness.
MACD (12, 26, 9) (the bottom chart) remains on a sell and continues in a downtrend. The risk remains that APPL will fall further with more time necessary for a safer bottom formation to develop.
Figure 13: The S&P 500 Index (SPY) Daily (Top) and 12-26-9 MACD (Bottom)
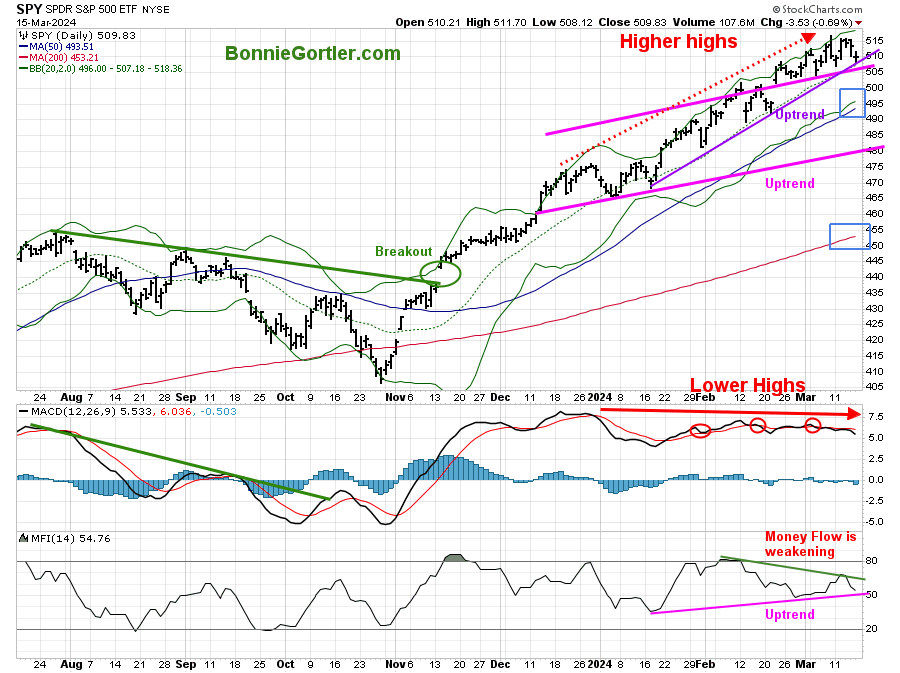
031524 SPY Daily
Source: Stockcharts.com
The S&P 500 (SPY) broke the downtrend in November 2023 (green solid line) and has been in a steady uptrend. The SPY accomplished its upside objective of 510.00.
The 2024 daily trend for the SPY remains up (purple line). The SPY closed at 509.83, down -0.06% for the week, remaining above the rising 50-day Moving Average (blue rectangle) and the 200-day Moving Average (red rectangle), a sign of strength.
Support is at 505.00, 491.00, 480.00, and 465.00.
MACD (bottom Chart) remains on a sell above 0, falling with weakening momentum.
It will be a positive in the short term if support at 505.00 holds and SPY closes above last week’s high of 515.22. On the other hand, a close below 505.00 could lead to stops hit, generating a sharp, quick decline.
Remember to manage your risk, and your wealth will grow.
Let’s talk about investing one-on-one. You are invited to schedule your Free 30-minute Wealth and Well-Being Strategy session here or by emailing me at Bonnie@BonnieGortler.com. I would love to schedule a call and connect with you.
Disclaimer: Although the information is made with a sincere effort for accuracy, it is not guaranteed that the information provided is a statement of fact. Nor can we guarantee the results of following any of the recommendations made herein. Readers are encouraged to meet with their own advisors to consider the suitability of investments for their own particular situations and for determination of their own risk levels. Past performance does not guarantee any future results.


Create more wealth in your life
with these simple strategies.
As an added bonus you will also
receive BG’s Updates and Ezine

Discover how to quickly create more well-being in your life with these simple strategies.
As an added bonus you will also
receive BG’s Updates and Ezine

As an added bonus you will receive BG’s Updates and Ezine

All work listed on BonnieGortler.com is licensed under a Creative Commons Attribution - Noncommercial - No Derivative Works 3.0 Unported License.
