


10 Simple Tips for Financial Well-Being
07/01/2026
MACD is a technical tool that combines momentum and trend and is valuable in identifying significant market trends that develop when investing. MACD is useful in various charting time frames ranging from one minute to monthly. MACD Gerald Appel developed the Moving Average Convergence/Divergence (MACD) oscillator in 1979. MACD is on technical software programs worldwide. MACD provides excellent entry and exit signals into stocks, exchange-traded funds (ETFs), bonds, options, and commodities. MACD oscillates above and below the zero line, using signal line crossovers.
MACD also identifies positive and negative divergences helping traders identify buying and selling opportunities. The simplest way to use MACD as a trading system alone is when MACD goes above 0, you buy, and you sell when MACD goes below 0. However, it’s not necessarily the most profitable when used in this manner. The shorter the time frame, the more trades, and potential whipsaws, buy and sells you will have.
The illustrations below are how I recommend using MACD.
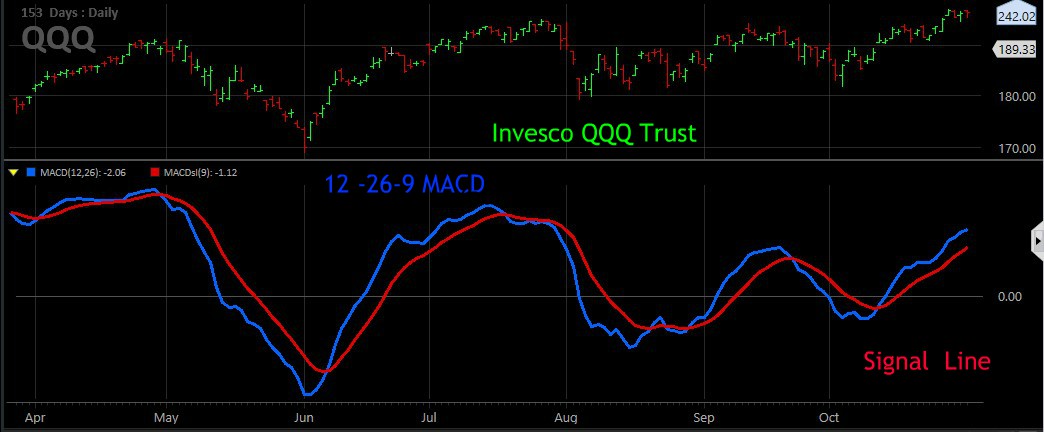
Figure 1: Invesco QQQ Trust Daily Top and 12-26-9 MACD (Bottom)
Source: Schwab StreetSmart Edge 03/27/19-10/31/19
Figure 1: The top chart is an example chart of Invesco QQQ Trust, an exchange-traded fund based on the Nasdaq-100 Index. The Index includes 100 of the largest domestic and international nonfinancial companies listed on the Nasdaq Stock Market based on market capitalization.
The MACD indicator is in the lower chart: MACD (blue line) is the 12-day Exponential Moving Average (EMA) less the 26-day EMA.) Closing prices of the security are used for these moving averages. A 9-day (EMA) of the MACD Line is plotted with the indicator to act as a signal line (red line) and identify potential turns.
The combination 12, 26, and 9 (medium MACD) is a standard parameter used**. Also commonly used are 6-19-9 (fast MACD) and 19-39-9 (slow MACD.) I like to use 12-26-9 MACD when I trade for both buy and sell signals. You can substitute the different settings depending on the market trend you’re in and your trading style. For example, during up-trending markets, MACD gives you a timelier buy using a faster entry and selling using a slower exit. During strong downtrends, the slower you buy, and the faster you sell, the better. In this way, you will not buy prematurely during a significant decline. In a fast-falling market, it’s better to be a little late than too early.
Over my more than 35-year stock market experience, I recommend the MACD setting using the difference between the 12- and 26-period EMAs (12,26,9). If you want to have quicker in and out signals, then speed up MACD using a shorter short-term moving average and a longer long-term moving average. If you prefer fewer signals, then lengthen the moving averages.
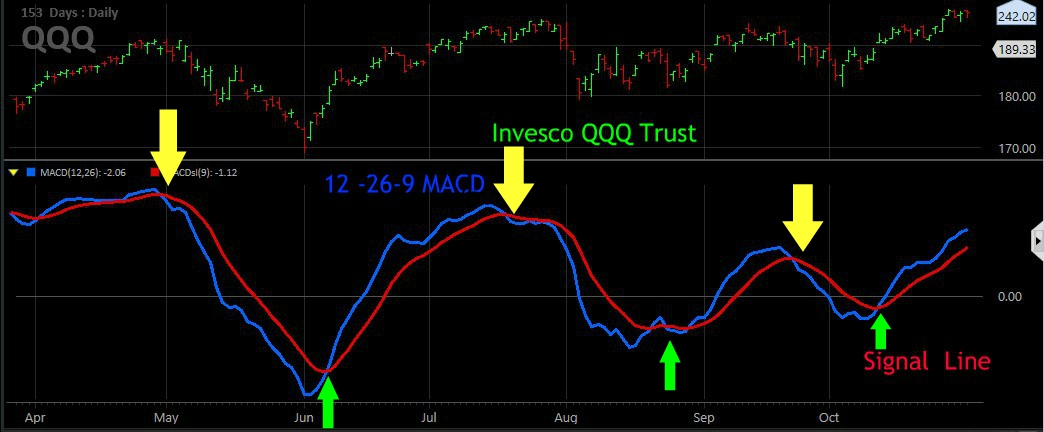
Figure 2: QQQ Invesco Trust Daily Top and 12-26-9 MACD (Bottom)
Source: Schwab StreetSmart Edge 03/27/19-10/31/19
I suggest using MACD as an indicator to help you identify overbought and oversold conditions giving you a clue of impending reversal areas for both buys and sells.
Figure 2: A buy signal occurs when the MACD turns up and crosses above the signal line (green arrows). Notice MACD buys are below 0. A sell signal occurs when MACD turns down and crosses below the signal line (yellow arrows). Notice MACD sell signals occur from above zero.
Buy signals and sell signals can last a few days, a few weeks, or months, depending on the power of the move. The stronger the rise, the higher the MACD reading will be reached (an overbought condition). Most times, overbought conditions are not immediately bearish. In most instances, a final peak in price, takes time, as upside momentum slows.
The weaker the move in the security, the lower the MACD reading will be reached (an oversold condition). Most times, oversold readings are not immediately bullish. As the price continues to fall, downside momentum increases until the decline begins to weaken.
During a sharp downturn, it is safest to wait until the signal line starts to flatten, followed by MACD turning up. However, the price may be higher than at the lowest reading of MACD. When there is a sustained downtrend, MACD will get below 0.
When price moves sideways or stays in a trading range, MACD tends to have numerous whipsaws, buy and sell until ultimately a breakout up or down begins.
**Calculation of MACD Line: (12-day EMA – 26-day EMA) Signal Line: 9-day EMA of MACD Line.
Divergences
In my opinion, divergences are one of the most useful charting patterns of MACD. Noticing a potential divergence using MACD before or as it occurs will help you increase your success at making money trading.
What is a divergence?
There are two types of divergences, positive (bullish) and negative (bearish) divergence. A bullish divergence forms when a security has a lower low and the MACD forms a higher low. The lower low in the security confirms the downtrend remains in effect, and the downtrend (more weakness) is likely to continue implying risk is high. However, a higher low in the MACD shows there is less downside momentum, and the decline is close to ending, and a potential trend reversal will occur.
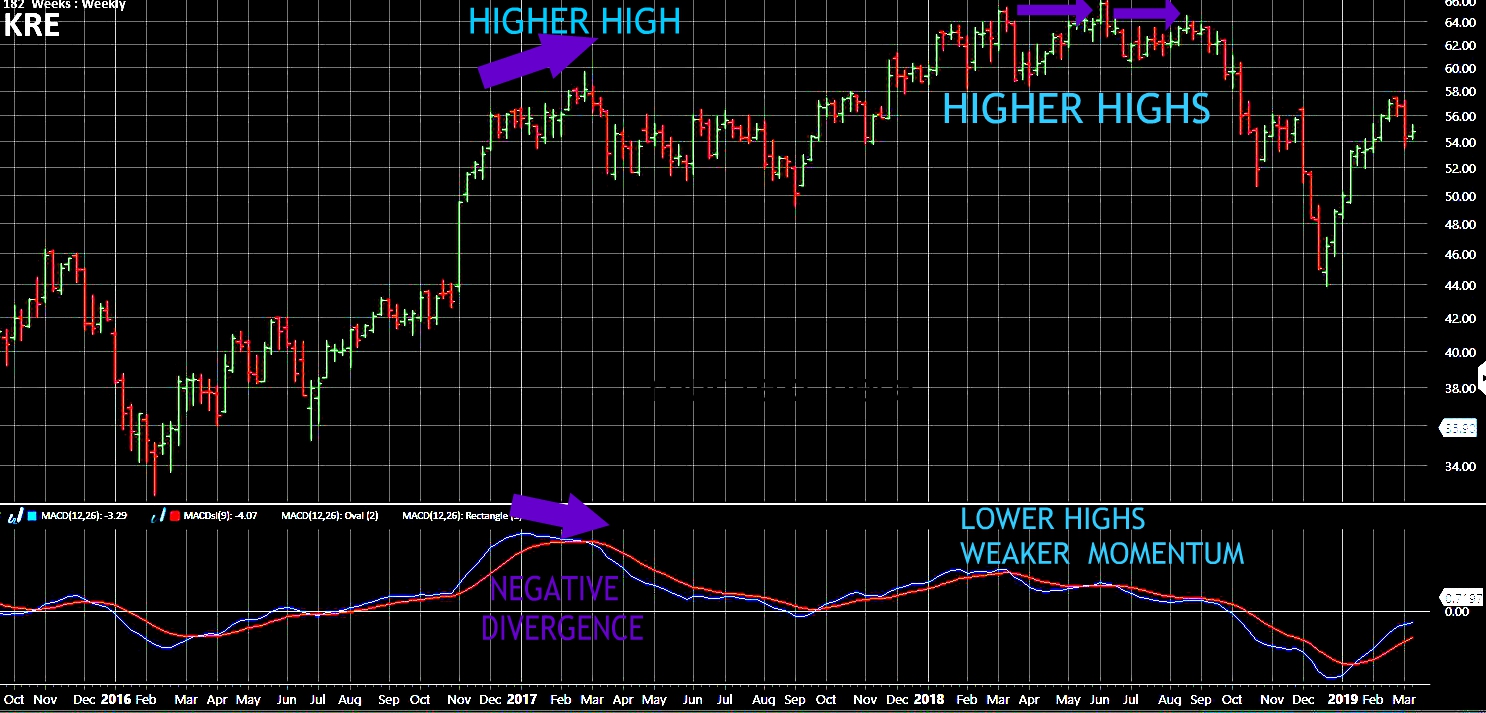
Figure 3: SPDR S&P Regional Bank (KRE) Weekly Price (Top) and 12-26-9 MACD (Bottom)
Source: Schwab StreetSmart Edge 9/21/2015 – 3/11/19
Figure 3: The top part of the chart shows the weekly SPDR Regional Banking (KRE), an exchange-traded-fund (ETF), that is an equally weighted index of common stocks, including leading regional banks or thrifts (savings and loan associations).
In Figure 3, you will see two bearish examples of negative divergences. KRE made a new high in February 2017, (purple arrow on the left). MACD on the lower portion of the chart failed to confirm the high made in KRE, a negative divergence.
On the right-hand side of the chart in 2018, you will see KRE made a higher high, but MACD made lower highs forming a clear negative divergence. KRE then fell over 30%.
A negative divergence forms when price makes a higher high, and MACD forms a lower high. The lower high in the MACD implies less upside momentum, a warning sign of a potential shift in trend.
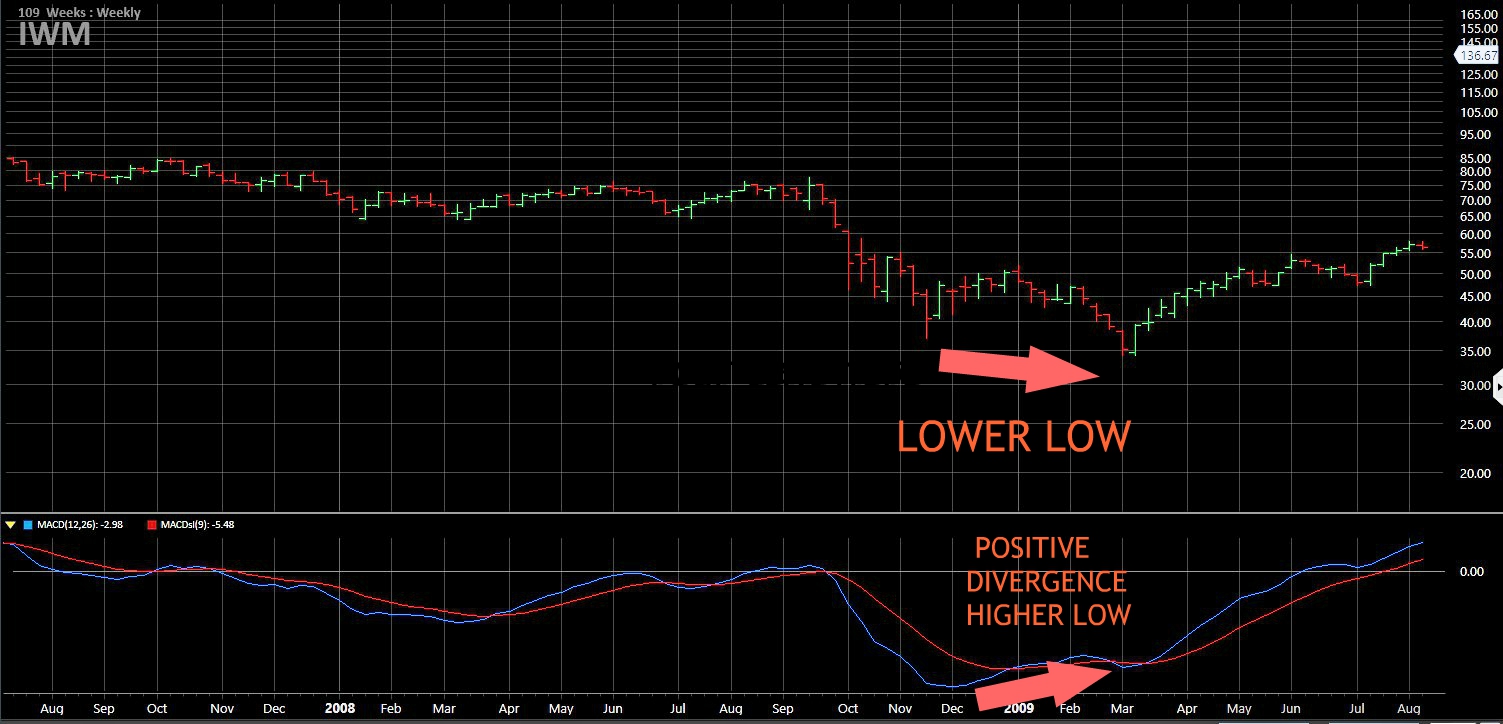
Figure 4: Weekly Russell 2000 (IWM) Price (Top) and 12-26-9 MACD (Bottom)
Source: Schwab StreetSmart Edge 7/24/2008 – 7/31/09
Figure 4: The iShares Russell 2000 Index ETF (IWM) has companies with a market capitalization of between $300 million and $2 billion.
Notice the lower low in price, the first condition you need to identify a divergence. Notice the positive bullish divergence in the lower chart where MACD formed a higher low as the Russell 2000 (IWM) in the top chart made a lower low in price. MACD is clearly showing momentum to the downside (pink arrow) is diminishing. Then MACD turned up, crossing the signal line. Divergences are clues to a pending shift in trend. The bullish divergence is my favorite buy pattern of MACD.
In Sum:
A divergence is where price and MACD move in opposite directions. Often, this leads to a change in the price trend. A positive difference is bullish, where price bottoms make a new low while MACD is above its previous low. A negative divergence is bearish. Price peaks at a new high while MACD makes a high below its previous high.
No technical indicator is perfect. However, MACD is a helpful technical indicator that has stood the test of time that can help you identify overbought and oversold conditions and potential market reversals. When you are focused, disciplined, and follow a sound systematic approach, you can grow and sustain your wealth. If you would like to continue the conversation, schedule a free 30-minute strategy session with me, click here.
Bonnie Gortler
Wealth and Well-Being Coach, Consultant, and Author
If you like this article, then you will love my FREE report, Grow and Sustain Your Wealth. Get more information here.
Disclaimer: Although the information is made with a sincere effort for accuracy, it is not guaranteed that the information provided is a statement of fact. Nor can we guarantee the results of following any of the recommendations. Past performance does not guarantee any future results. Any information mentioned is used for educational purposes to help you develop your trading strategy. Check with your investment advisor before any investment purchases made. Past performance does not guarantee any future results.


Create more wealth in your life
with these simple strategies.
As an added bonus you will also
receive BG’s Updates and Ezine

Discover how to quickly create more well-being in your life with these simple strategies.
As an added bonus you will also
receive BG’s Updates and Ezine

As an added bonus you will receive BG’s Updates and Ezine

All work listed on BonnieGortler.com is licensed under a Creative Commons Attribution - Noncommercial - No Derivative Works 3.0 Unported License.


Free Report:
Grow and Sustain Your Wealth
Discover how to grow your money with these easy, simple steps.


I swing trade forex holding positions for 3-7 days and my stop loss orders are 80-100 pips away from entry price.I use macd settings 3,7,3 for early signals on weekly,daily and 4 hour chart.MACD signal is compared on 2 time frames for early momentum direction/reversal– say 4 hour & daily time frames and if both agree the signal is valid.Regular default settings of macd are too late for present day markets largely ruined by algos & HFT.Please comment on macd settings 3,7,3–merits/pitfalls.These days when forex/stock markets fall,these come down like a rocket.On 1 hour and 15 minute charts default settings are the way to go. Momentum is better predictor of direction of future price than moving average? Thank you.
Hi Prem Nath
Thank you for stopping buy my blog and sharing your thoughts. MACD can be sometimes late when buying, waiting for a cross of the signal line, especially in a strong move after a good bottoming formation. You can speed up or slow down the parameters that fits your trading style.