

10 Simple Tips for Financial Well-Being
07/01/2026
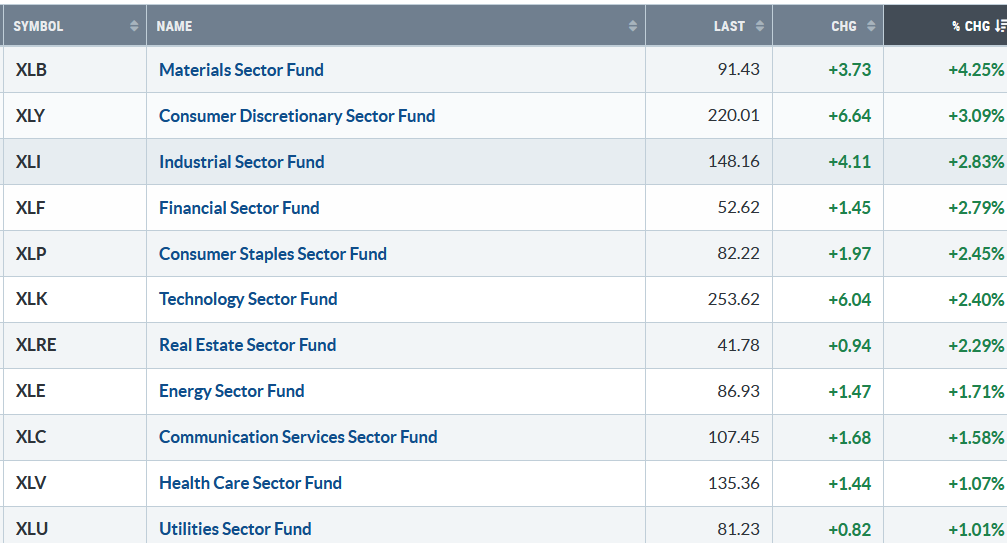
The market rose for the second week, the fourth week of gains in the last six. All eleven S&P SPDR sectors were higher. Materials (XLB) and Consumer Discretionary (XLY) were the strongest sectors, while Health Care (XLV) and Utilities (XLU) were the weakest sectors. The SPDR S&P 500 ETF Trust (SPY) rose by +2.20%.
S&P SPDR Sector ETFs Performance Summary Week ending 07/3/25
070325 weekly SPDR Sector
Source: Stockcharts.com
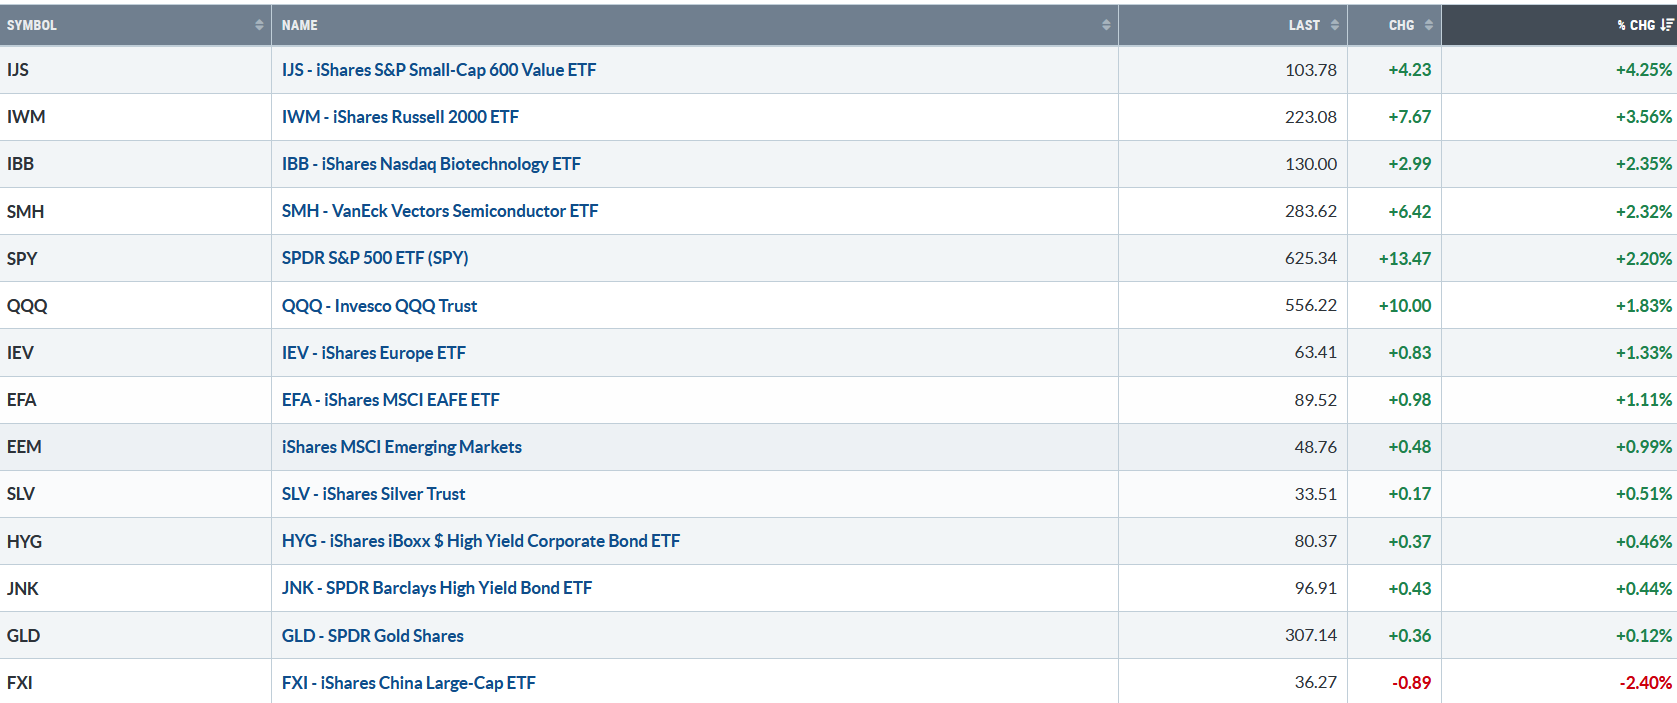
Figure 2: Bonnie’s ETFs Watch List Performance Summary Week ending 07/3/25
070325 ETF Watch List
Source: Stockcharts.com
Small-cap value and Growth stocks came to life, leading the rally while Gold and Silver paused. China was under selling pressure.
CHARTS CHARTS AND MORE CHARTS FOR YOU TO REVIEW. GO HERE.
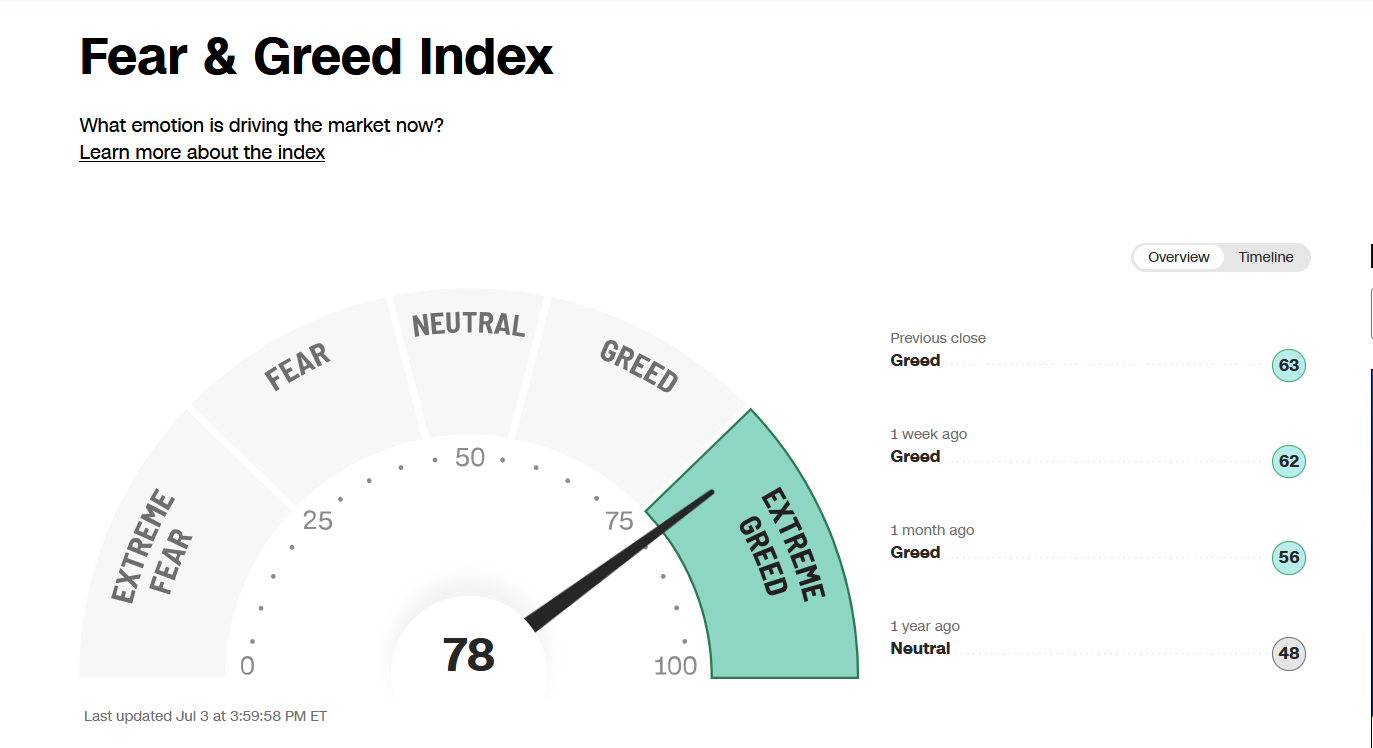
Figure 3: Fear & Greed Index
070325 CNN Fear and Greed Index
Source. CNN.com
Investor sentiment, measured by the Fear and Greed Index (a contrarian indicator), closed at 78, the highest reading since March 24. The reading closed at Extreme Greed, implying a higher risk of a short-term peak developing before a lower-risk new buying opportunity emerges.
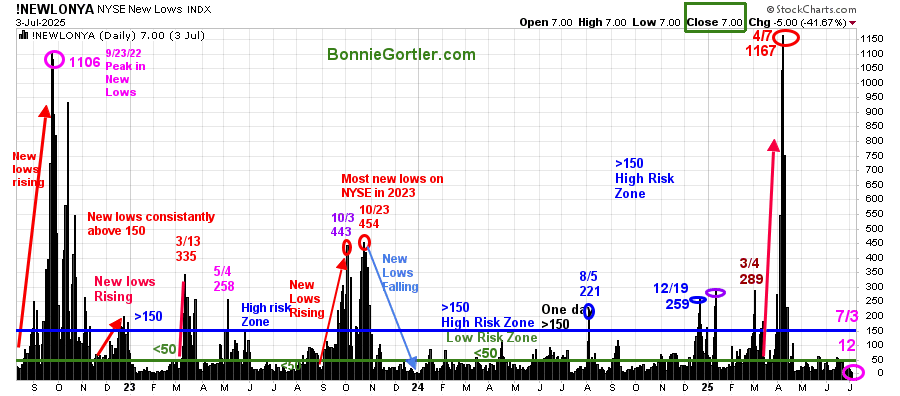
Figure 4: NYSE New Lows
070325 NYSE New Lows
Source: Stockcharts.com
New Lows peaked at 1167 on 4/7/25, then contracted sharply. New Lows closed at 7 last week, in the lowest-risk zone.
It would remain positive in the short term if New Lows stay between 25 and 50, or below, and do not increase above 150. Learn more about the significance of New Lows in my book, Journey to Wealth, published on Amazon. For a chapter preview of Journey To Wealth, you can download a free chapter here.
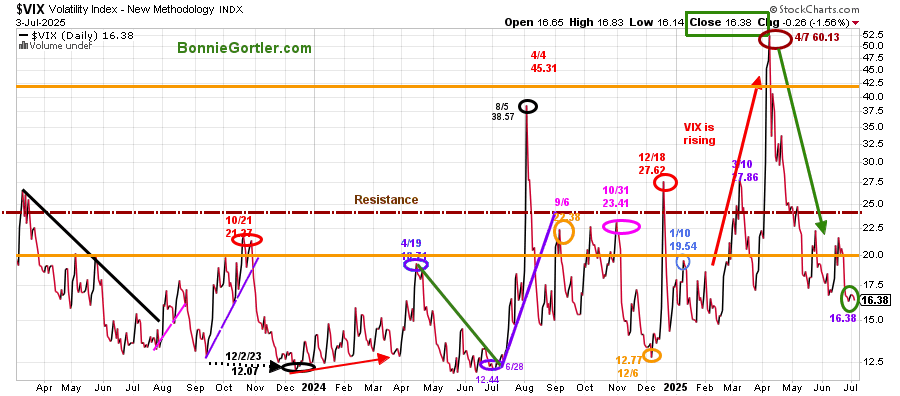
Figure 5: CBOE Volatility Index (VIX)
070325 VIX
Source: Stockcharts.com
The CBOE Volatility Index (VIX), a measure of fear, has continued to trend downward since its peak in April, closing at 16.38 above the December 24 low. A reading of 22.50 would be the first sign that intraday volatility is likely to increase. A close above 25.00 would increase the odds that a short-term correction is underway.
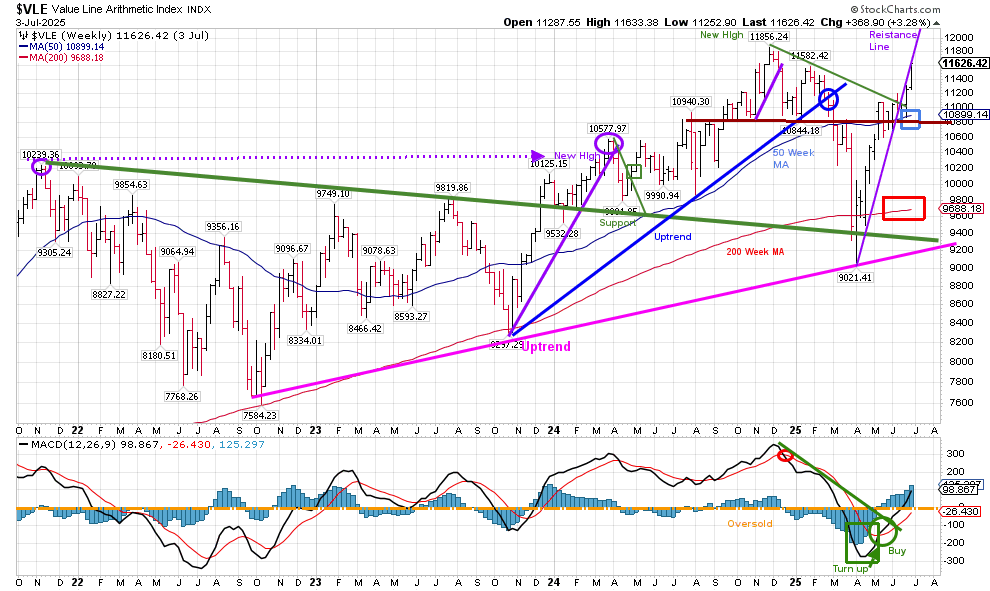
Figure 6: Value Line Arithmetic Average Weekly (Top) and 12-26-9 MACD (Bottom)
070325 VLE Weekly
Source: Stockcharts.com
The Value Line Arithmetic Index ($VLE) is a mix of approximately 1700 stocks.
The VLE intermediate price trend remains up. Support is at 11250,10900, followed by 10600.
Since the low VLA has recovered most of its gains. It’s positive that VLE closed above its 50-week moving average (blue rectangle) and 200-week moving average (red rectangle). However, note that VLE closed at the resistance line and has not yet penetrated it, an area where many past rallies have stalled. A weekly close above the old high at 11856.24 would be positive. On the other hand, failure to make a new high and turn it down would be considered a short-term negative.
I invite you to join my Facebook Group. Learn more about it here: Wealth Through Market Charts.
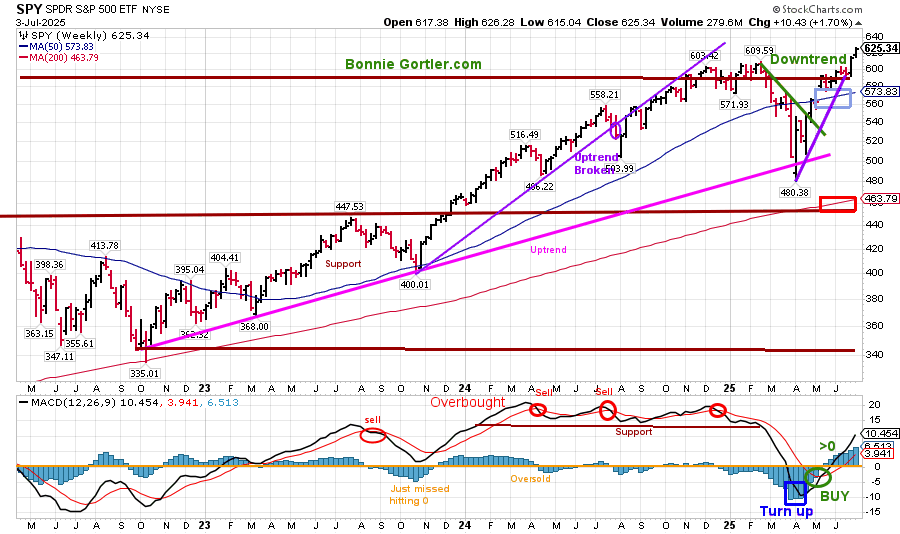
Figure 7: S&P 500 Weekly (SPY) and 12-26-9 MACD (Bottom)
070325 SPY Weekly
Source: Stockcharts.com
The S&P 500 (SPY) remains in an intermediate uptrend. After hitting a low in April, SPY consolidated its gains, broke out, and closed last week at a new all-time high.
MACD (bottom chart) remains on a buy signal, with rising momentum above 0, implying higher prices ahead. The upside projection for SPY 700.00 remains. However, SPY is short-term extended, and a pullback is possible to test the recent breakout of the channel.
A weekly close below 575.00 would negate the upside projection of 700.00.
Discover how to cultivate a powerful wealth-building mindset and effective charting strategies to grow your wealth from the comfort of your own home in my eCourse, Wealth Through Investing Made Simple. Learn more here.
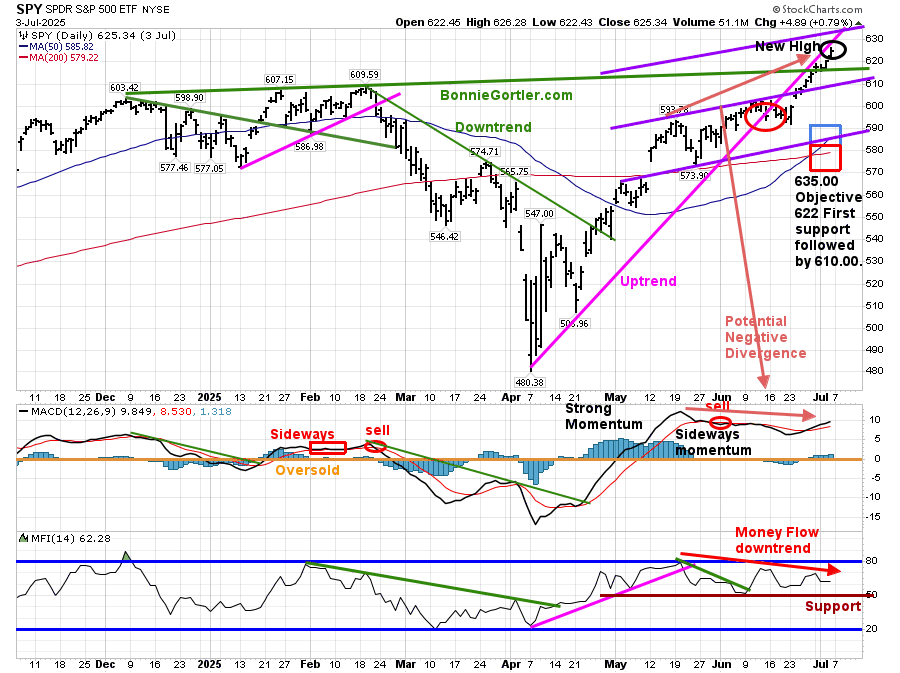
Figure 8: S&P 500 Daily (SPY) Price (Top), 12-26-9 MACD (Bottom)
070425 SPY Daily
Source: Stockcharts.com
The S&P 500 (SPY) closed at a new high on Thursday, July 3, slightly under the rising resistance line. It’s normal for the price to trade near the resistance line. Only in the strongest moves will price penetrate the line. SPY remains above the 50- and 200-day moving averages, which is positive.
Upside objective 635.00. Support is at 622.00, 610.00, 595.00, 585.00, and 565.00.
The MACD (middle chart) remains on a sell signal above 0, as it did not fall below 0 to reset when it turned up.
In Sum:
SPY completed its consolidation pattern and turned up, making a new high. Be alert to the potential positive divergence that has formed but not completed until MACD generates a sell signal before making a higher high than in May. With MACD for the intermediate term on a buy with rising momentum above 0, any pullback in the SPY is likely to remain contained. Time will tell.
Small Cap Strength is positive.
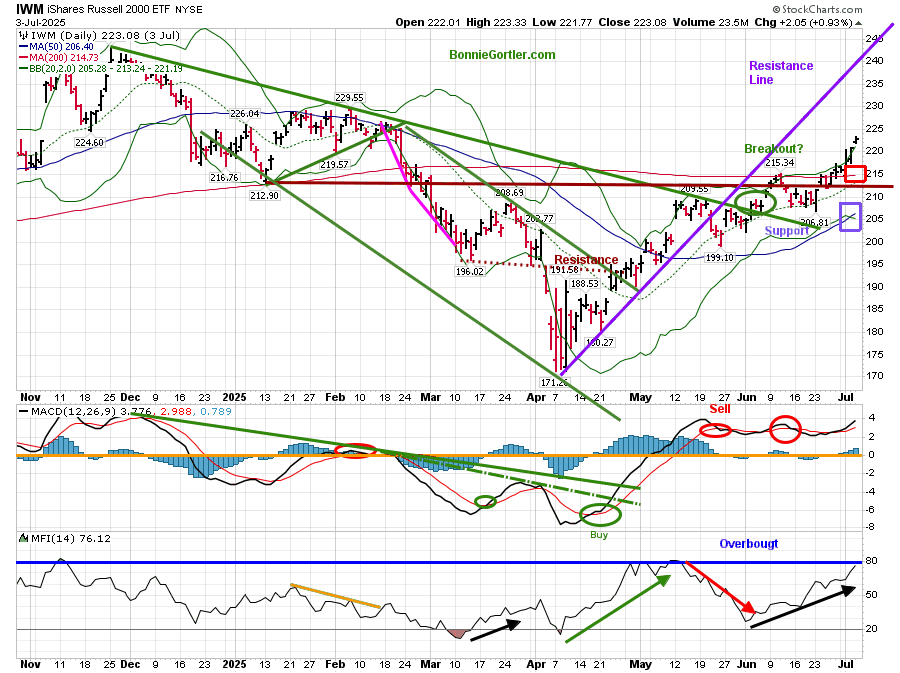
Figure 9: Daily iShares Russell 2000 (IWM) Price (Top),12-26-9 MACD (Middle), and Money Flow (Bottom)
 Source: Stockcharts.com
The iShares Russell 2000 Index ETF (IWM) finished up 3.53% last week, gaining strength vs the S&P 500.
IWM had broken the downtrend since November 2024 (green line) and appears to have successfully tested the breakout. It’s positive for the broad market that IWM closed above the 50-day moving average (blue rectangle) and the 200-day moving average (red rectangle).
Short-term support is at 221.00, followed by 214.00
The MACD (middle chart) remains on a sell signal, above 0, and rising.
The Money Flow (lower chart) reached 80, indicating an overbought condition earlier in May. The Money Flow is rising now, once again near 80, potentially an area where the seller will take control.
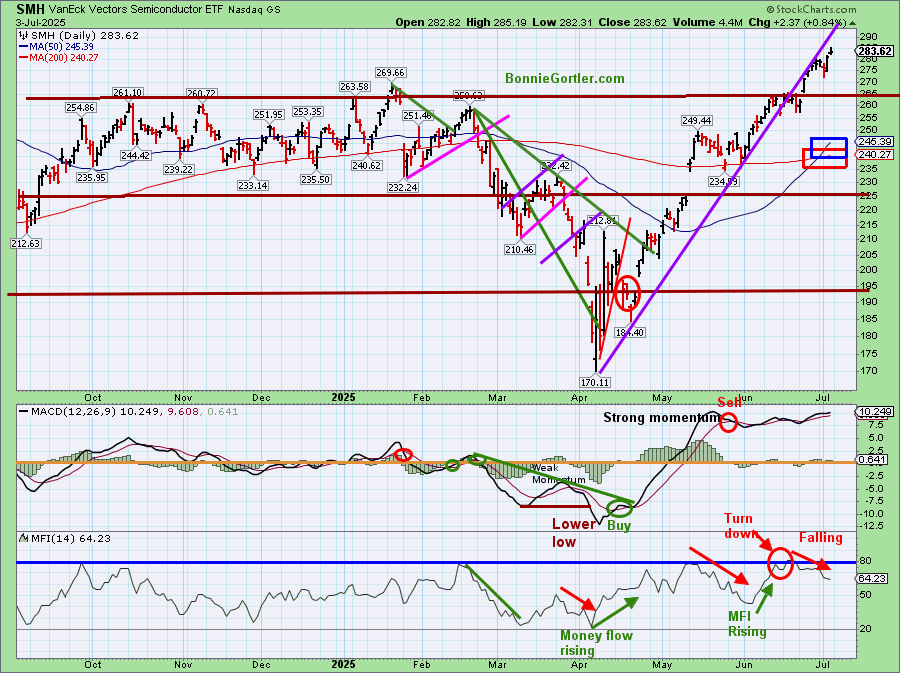
Figure 10: Daily Semiconductors (SMH) (Top), 12-26-9 MACD (Middle), and Money Flow (Bottom)
070325 SMH Daily
Source: Stockcharts.com
The top chart shows the Daily Semiconductor (SMH) ETF, which is concentrated mainly in US-based Mega-Cap Semiconductor companies. SMH tends to be a leading indicator for the market when investors are willing to take on increased risk, and the opposite is true when the market is falling.
SMH rose again last week, trading within a tight range and closing above both the 50-day MA (blue rectangle) and the 200-day MA (red rectangle), indicating underlying strength.
Support is 270.00, 265.00, 245.00, and 240.00, and resistance is at 285.00 with an upside objective of 315.00. A close below 265.00 would negate the upside objective.
The MACD (middle chart) remains on a sell signal, above 0, on sideways momentum.
The Money Flow (lower chart) in June reached 80 (blue line), an overbought condition, and continues to decline, suggesting potential upcoming weakness. Note that the intermediate chart of SMH (not shown) reached 80 on Thursday.
Leadership in Semiconductors would be short-term positive. On the other hand, if SMH begins to lag and underperform, it would be a warning sign of a potential pullback that is likely to start.
Summing Up:
The major averages all closed higher in a shortened holiday week. Market breadth is favorable, Small Caps are showing strength, and intermediate-term momentum patterns are rising. However, in the short term, sentiment is showing extreme greed, daily momentum has slowed, forming potential negative divergences, which suggests caution. Now is a good time to evaluate your portfolio to ensure you are not over-invested in equities, that your stops are in place if you are a short-term trader, and that you are not taking on more risk than necessary. Remember, you never go broke taking a profit. Manage your risk, and your wealth will grow.
If you would like to explore the charts further and get to know each other better, please email me at Bonnie@BonnieGortler.com or visit my calendar to schedule a time Here.
If you enjoy this market update, you will love my free Charting Master Class. Learn more HERE.


Create more wealth in your life
with these simple strategies.
As an added bonus you will also
receive BG’s Updates and Ezine

Discover how to quickly create more well-being in your life with these simple strategies.
As an added bonus you will also
receive BG’s Updates and Ezine

As an added bonus you will receive BG’s Updates and Ezine

All work listed on BonnieGortler.com is licensed under a Creative Commons Attribution - Noncommercial - No Derivative Works 3.0 Unported License.


Free Report:
Grow and Sustain Your Wealth
Discover how to grow your money with these easy, simple steps.

