

10 Simple Tips for Financial Well-Being
07/01/2026
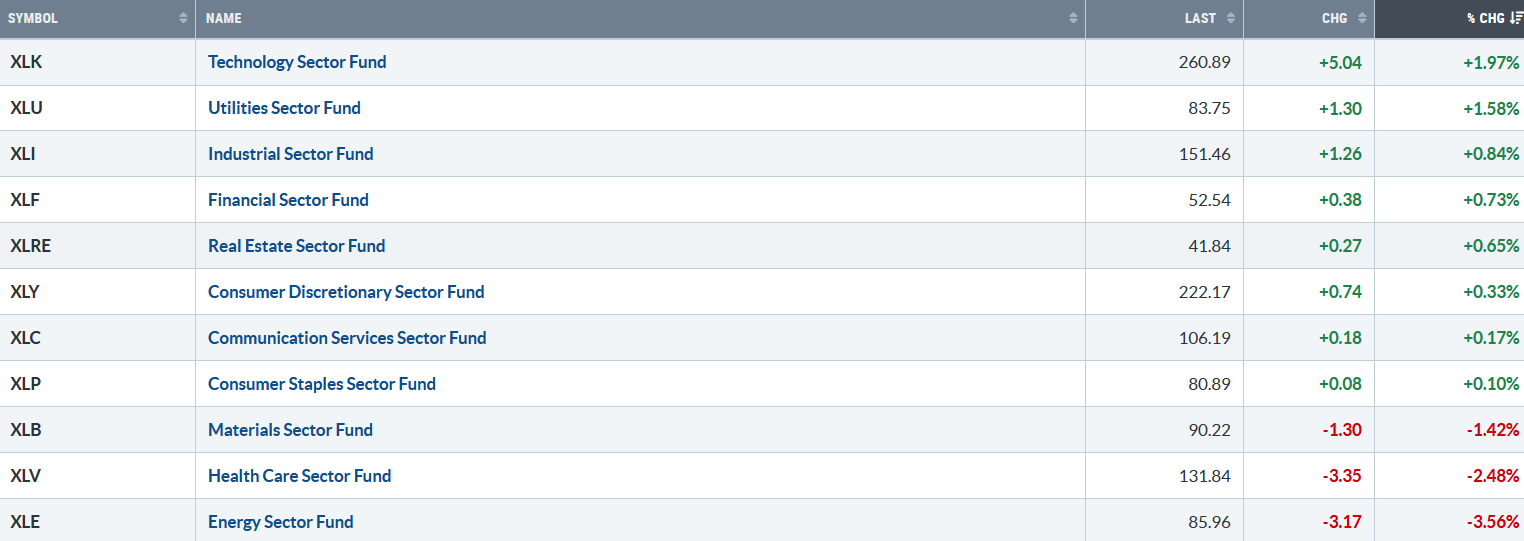
Last week, the earnings season began. The Nasdaq and S&P 500 reached record highs in mostly quiet trading. Eight of the eleven S&P SPDR sectors were higher. Technology (XLK) and Utilities (XLU) were the strongest sectors, while Health Care (XLV) and Energy (XLE) were the weakest sectors. The SPDR S&P 500 ETF Trust (SPY) rose by +0.64%.
S&P SPDR Sector ETFs Performance Summary 07/11/25 – 07/18/25
071825 weekly SPDR Sectors
Source: Stockcharts.com
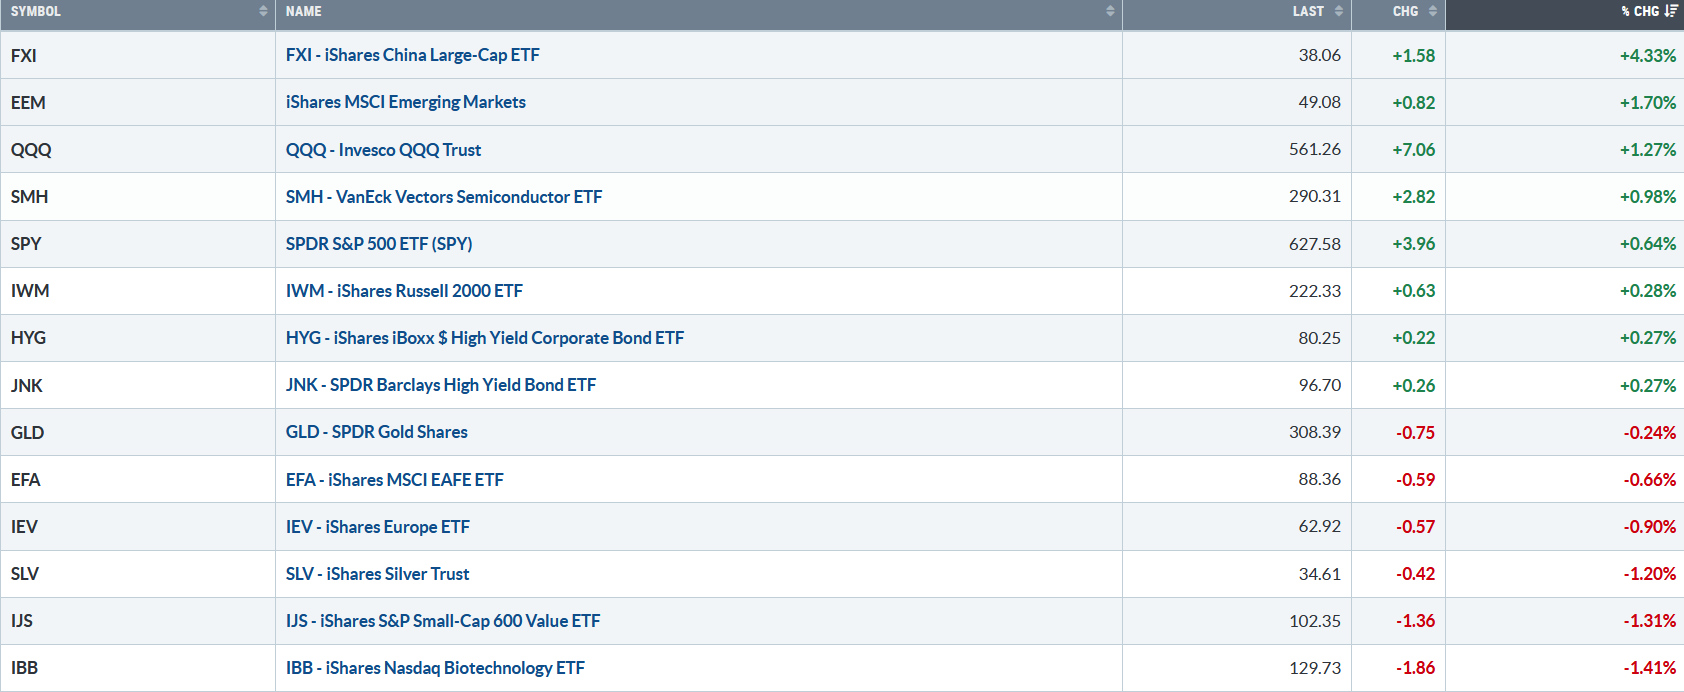
Figure 2: Bonnie’s ETFs Watch List Performance Summary 07/11/25 – 07/18/25
071825 Bonnie’s ETF Watch List
Source: Stockcharts.com
China came to life last week. Emerging Markets, Technology, and Semiconductors showed strength. Silver, Small-Cap Value, and Biotechnology were weak.
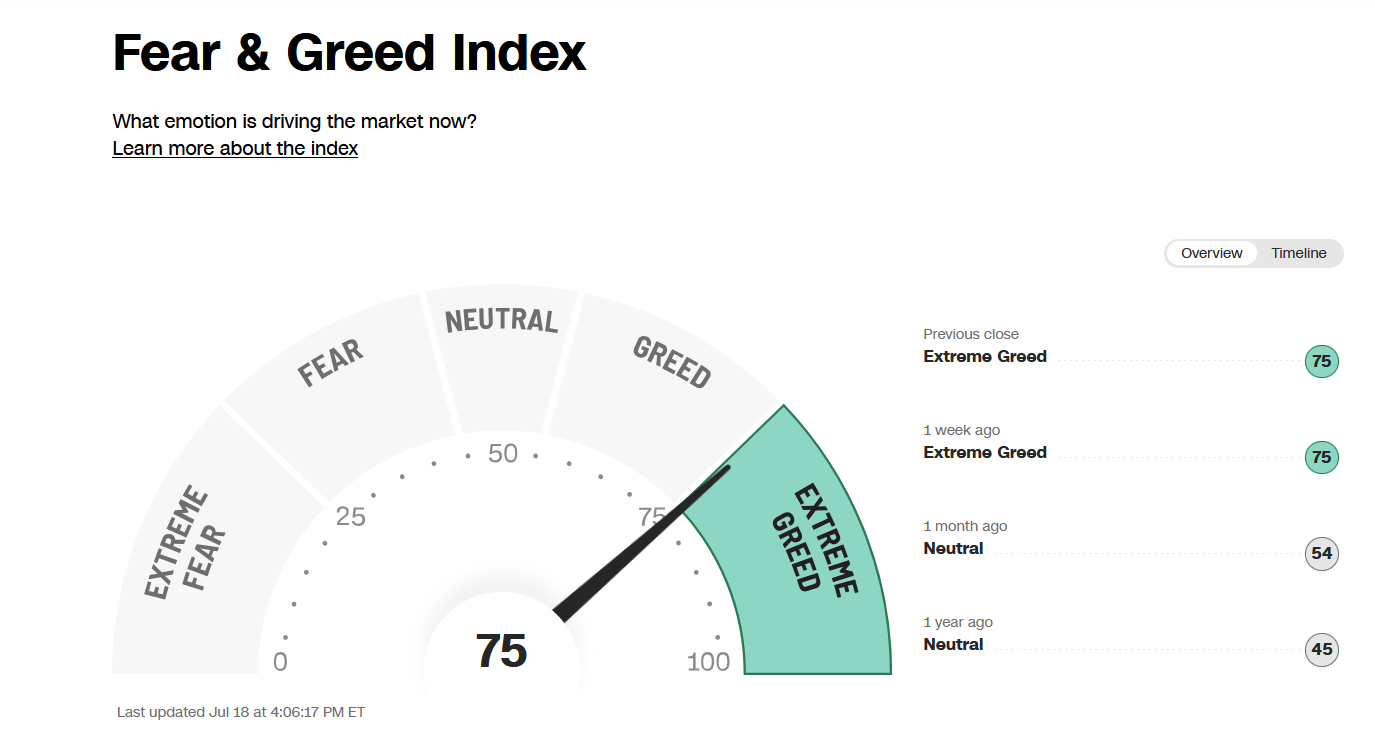
Figure 3: Fear & Greed Index
071825 CNN Fear and Greed Index
Source. CNN.com
Investor sentiment, as measured by the Fear and Greed Index (a contrarian indicator), closed at 75, Extreme Greed, which implies a higher risk of a short-term peak developing before a lower-risk new buying opportunity emerges.
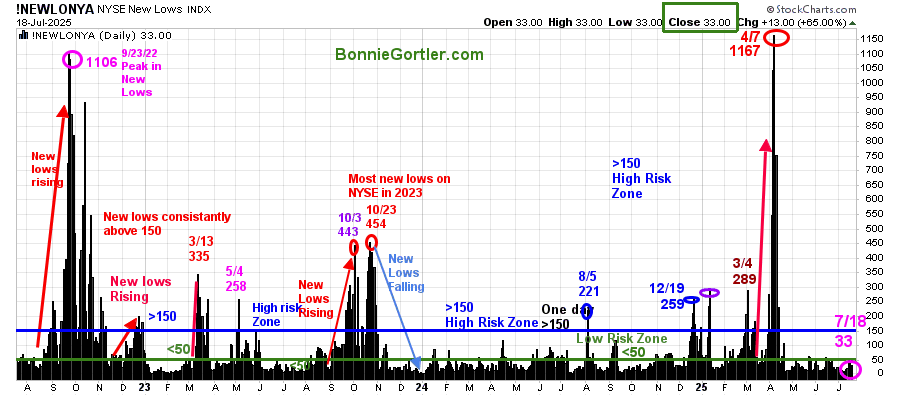
Figure 4: NYSE New Lows
071825 NYSE New Lows
Source: Stockcharts.com
New Lows On The NYSE peaked at 1167 on 4/7/25, then contracted sharply as the market bottomed in April.
New Lows closed at 33 last week, remaining in a low-risk zone. No signs of trouble brewing yet. It would remain positive in the short term if New Lows stay between 25 and 50 and remain below 150. Learn more about the significance of New Lows in my book, Journey to Wealth, published on Amazon. For a chapter preview of Journey To Wealth, you can download a free chapter on my website here.
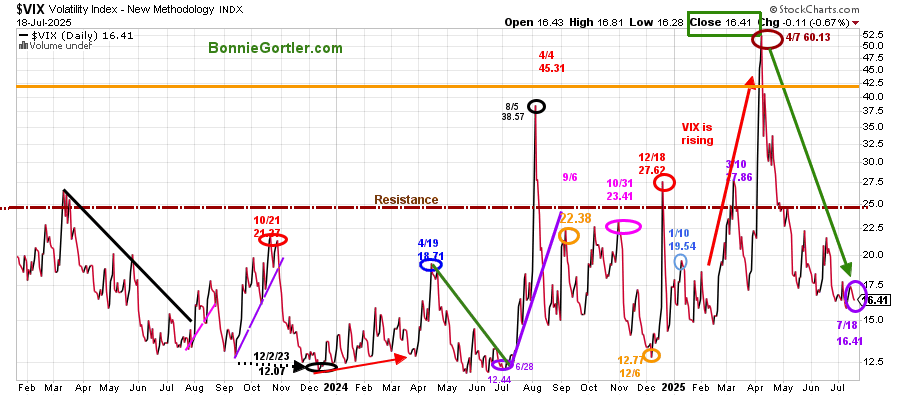
Figure 5: CBOE Volatility Index (VIX)
071825 $VIX Daily
Source: Stockcharts.com
The CBOE Volatility Index (VIX), a measure of fear, has continued its downward trend since its high made in April. VIX closed at 16.41 and remains above the December 2024 low. Historically, the VIX tends to rise during the next several months. A reading above 22.50 would be the first sign that intraday volatility is likely to increase.
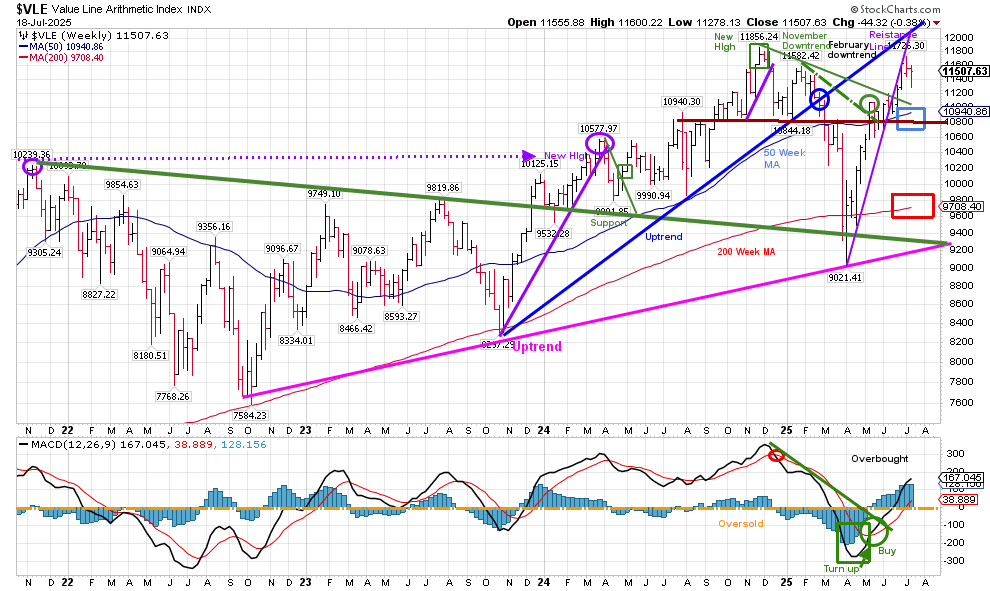
Figure 6: Value Line Arithmetic Average Weekly (Top) and 12-26-9 MACD (Bottom)
071825 $VLE Weekly
Source: Stockcharts.com
The Value Line Arithmetic Index ($VLE) is a mix of approximately 1700 stocks.
The VLE intermediate price trend from October 2022 remains in an uptrend (pink line). Two weeks ago, the April uptrend broke, failing to break through resistance (blue and purple lines), and turned down, not yet confirming the high made in the S&P and Nasdaq. However, it remains positive that VLE closed above its 50-week moving average (blue rectangle) and 200-week moving average (red rectangle).
VLE support is 11250,10800, 9700, and 9200. A weekly close above the old high at 11,856.24 would imply further gains ahead. On the other hand, failure to make a new high and a close below support at 10800 would increase the odds of a correction.
I invite you to join my Charting Facebook Group. Learn more about it here: Wealth Through Market Charts.
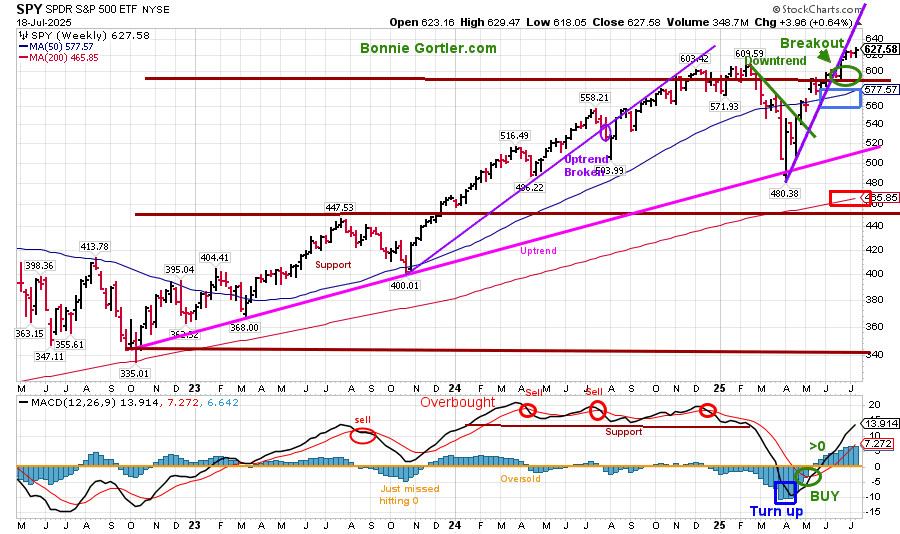
Figure 7: S&P 500 Weekly (SPY) and 12-26-9 MACD (Bottom)
071825 SPY Weekly
Source: Stockcharts.com
The S&P 500 (SPY) remains in an intermediate uptrend from October 2022. After hitting a low in April 2025, SPY consolidated its gains and then broke out of its channel, followed by making a new all-time high.
The MACD (bottom chart) remains on a buy, with rising momentum above 0, indicating an overbought condition where a potential sell signal could occur if SPY weakens.
Summing Up:
The upside projection for SPY at 700.00 remains. A weekly close below 575.00 would negate the intermediate upside projection of 700.00.
Discover how to cultivate a powerful wealth-building mindset and effective charting strategies to grow your wealth from the comfort of your own home in my eCourse, Wealth Through Investing Made Simple. Learn more here.
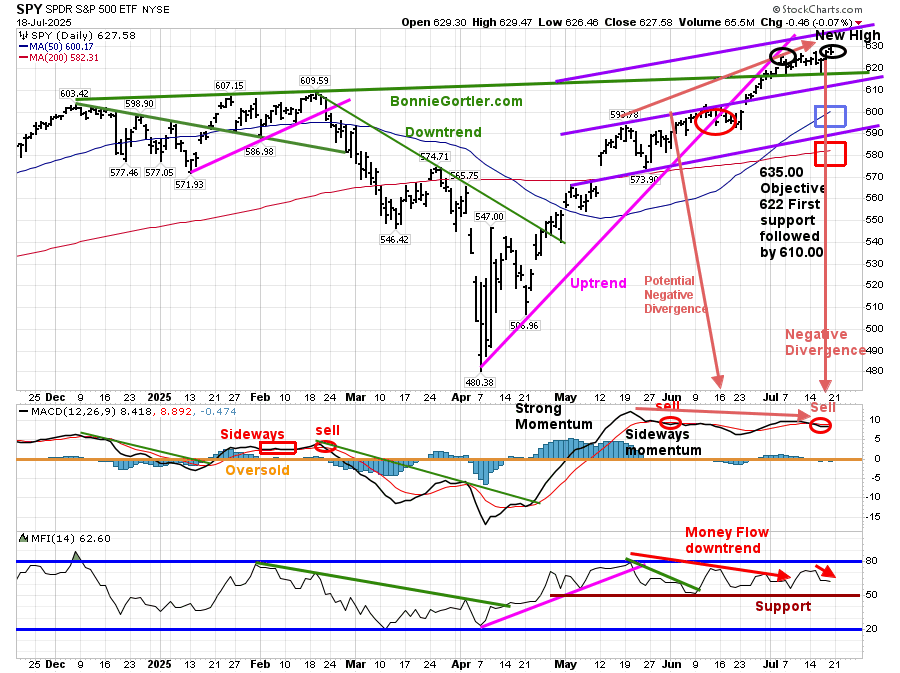
Figure 8: S&P 500 Daily (SPY) Price (Top), 12-26-9 MACD (Middle), and Money Flow (Bottom)
 Source: Stockcharts.com
The S&P 500 (SPY) reached a new record high this week, continuing to close above the 50 – and 200-day moving averages, a sign of strength.
The daily upside objective remains 635.00. Support is at 622.00, 610.00, 595.00, and 585.00.
The MACD (middle chart) gave a repeat sell signal above 0, completing the bearish negative divergence (higher high in price with a lower high in MACD).
Money Flow Index (lower chart) has turned down. A break below 50 support since April would be negative.
Summing Up:
With SPY short-term extended (daily chart) and weakening momentum, a pullback towards 575.00 to test the breakout of the intermediate SPY channel is possible when there’s a pullback in the SPY.
On a side note, it’s concerning that ten of the eleven SPDR Sectors are on MACD daily sells and have weakening momentum.
Russell 2000 Index (Small Caps) momentum weakening.
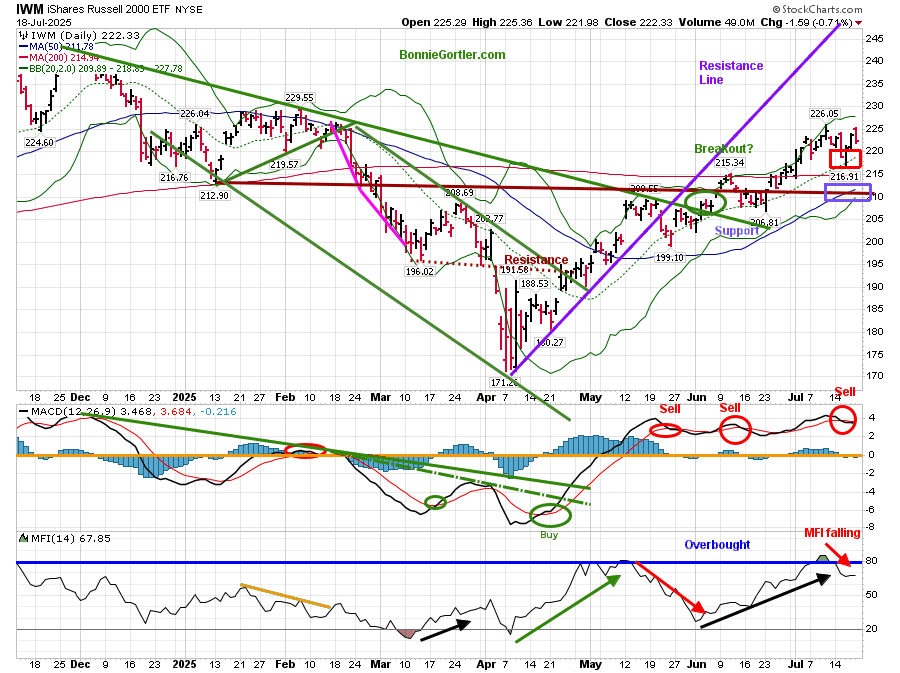
Figure 9: Daily iShares Russell 2000 (IWM) Price (Top),12-26-9 MACD (Middle), and Money Flow (Bottom)
 Source: Stockcharts.com
The iShares Russell 2000 Index ETF (IWM) finished the week up +0.28%, failing to demonstrate strength, which is concerning. IWM had broken the November 24 downtrend (green line) and appeared to have successfully tested the breakout. However, it’s disturbing that there is no significant follow-through. On the other hand, it’s a positive sign that IWM closed above both the 50-day moving average (blue rectangle) and the 200-day moving average (red rectangle).
Short-term support is at 221.00, followed by 214.00. Two closes below 214.00 would imply that the breakout failed and likely indicate weakness in the short term.
The MACD (middle chart) remains on a sell signal, above 0, and falling with a bearish triple top formation.
The Money Flow (lower chart) reached 80, indicating an overbought condition earlier in May, and is declining now. The Money Flow Index falling below 50 would be considered negative.
S&P 600 Small Cap Index market breadth weakening is concerning.
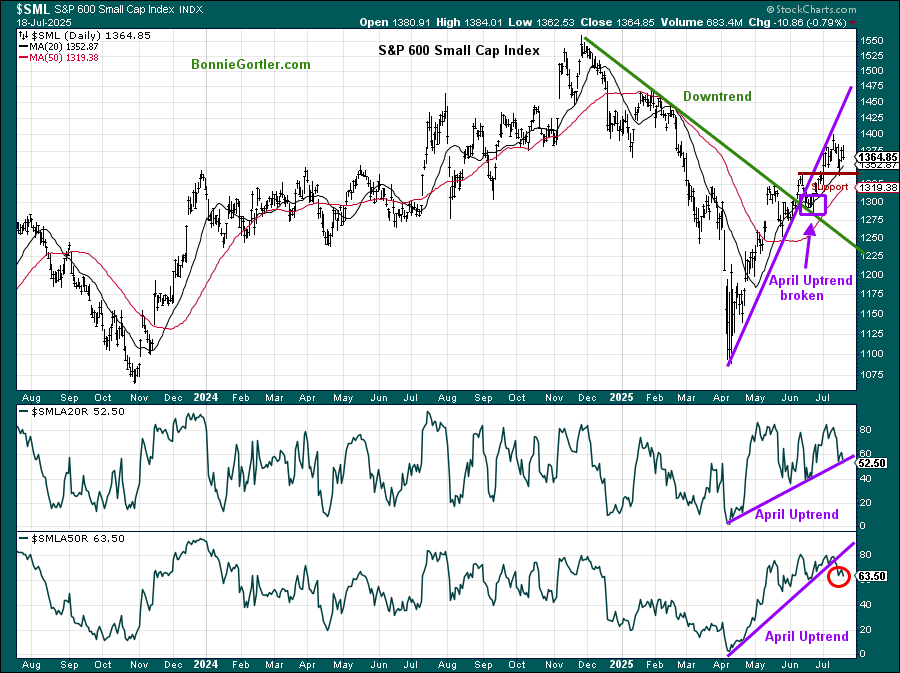
Figure 10: S&P 600 Small Cap Index and Percentage of stocks above the 20-day MA (middle chart and 50-day MA (bottom chart)
071825 S&P 600 percentage stocks above 20 and 50 MA
Source: Stockcharts.com
Internals are weakening on the S&P 600 Small Cap Index.
Notice that the percentage of stocks above the 20-day MA (middle chart) is falling and threatening to break the April uptrend.
The percentage of stocks above the 50-day MA has already broken the uptrend (purple line, red circle, bottom chart).
The S&P 600 Small Cap Index (top chart) needs to hold key support at 1352.00 (brown line).
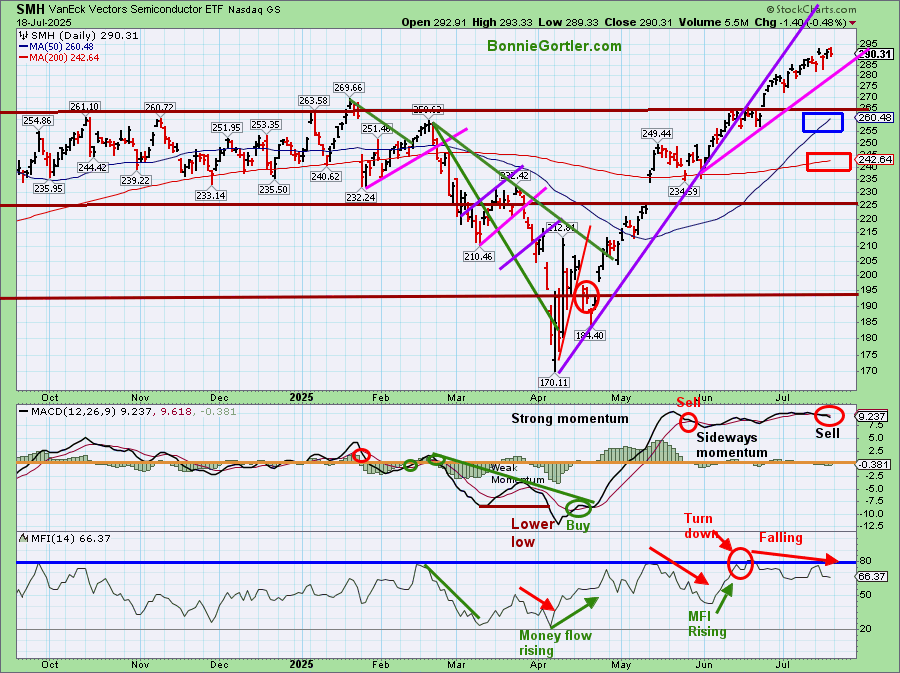
Figure 11: Daily Semiconductors (SMH) (Top), 12-26-9 MACD (Middle), and Money Flow (Bottom)
071825 SMH Daily
Source: Stockcharts.com
The top chart shows the Daily Semiconductor (SMH) ETF, which is concentrated mainly in US-based Mega-Cap Semiconductor companies. SMH tends to be a leading indicator for the market when investors are willing to take on increased risk, and the opposite is true when the market is falling.
SMH rose last week, continuing to trade within a tight range and closing above the rising 50-day MA (blue rectangle) and the 200-day MA (red rectangle), indicating underlying strength.
The June uptrend would break if SMH closes below 280.00. SMH can be highly volatile. The following support levels would be 270.00, 260.00, 245.00, and 240.00. Resistance is at 290.00 with an upside objective of 315.00 remaining. A close below 260.00 would negate the upside objective.
The MACD (middle chart) remains on a sell signal, above 0, and has exhibited sideways momentum, generating a repeat sell signal. This suggests that risk is on the rise and a pullback is likely if price support levels break, which may trigger the stops.
The Money Flow (lower chart) in June reached 80 (blue line), an overbought condition, and continues to decline, suggesting potential upcoming weakness. Note that the intermediate chart of SMH (not shown) is above 80, so be alert to a possible pullback.
If leadership in Semiconductors (SMH) continues, it would have a short-term positive impact. On the other hand, if SMH begins to lag and underperform, it would be a warning sign of a potential pullback that is likely to start.
Summing Up:
All major averages are higher in July, not yet affected by Tariff or earnings concerns. The Dow closed slightly lower for the week, but the S&P 500 and Nasdaq finished higher, with the Nasdaq closing at a record high. The intermediate trend is higher, but short-term indicators are flashing warning signs as the market continues to rise. Sentiment is showing extreme greed, daily momentum has slowed, and negative divergences are confirmed. Additionally, the market breadth and volume patterns I follow have weakened. Historically, seasonality has not been as favorable as it is in the first six months of the year. Evaluate your portfolio immediately to ensure you are not over-invested in equities, that your stops are in place if you are a short-term trader, and that you are not taking on more risk than fits your lifestyle. Manage your risk, and your wealth will grow.
If you would like to get to know each other better and grow your wealth, schedule your Wealth Building Free 30-minute Strategy Session today. Register Here.


Create more wealth in your life
with these simple strategies.
As an added bonus you will also
receive BG’s Updates and Ezine

Discover how to quickly create more well-being in your life with these simple strategies.
As an added bonus you will also
receive BG’s Updates and Ezine

As an added bonus you will receive BG’s Updates and Ezine

All work listed on BonnieGortler.com is licensed under a Creative Commons Attribution - Noncommercial - No Derivative Works 3.0 Unported License.


Free Report:
Grow and Sustain Your Wealth
Discover how to grow your money with these easy, simple steps.

