

Bonnie’s Market Update 5/15/26
05/17/2026
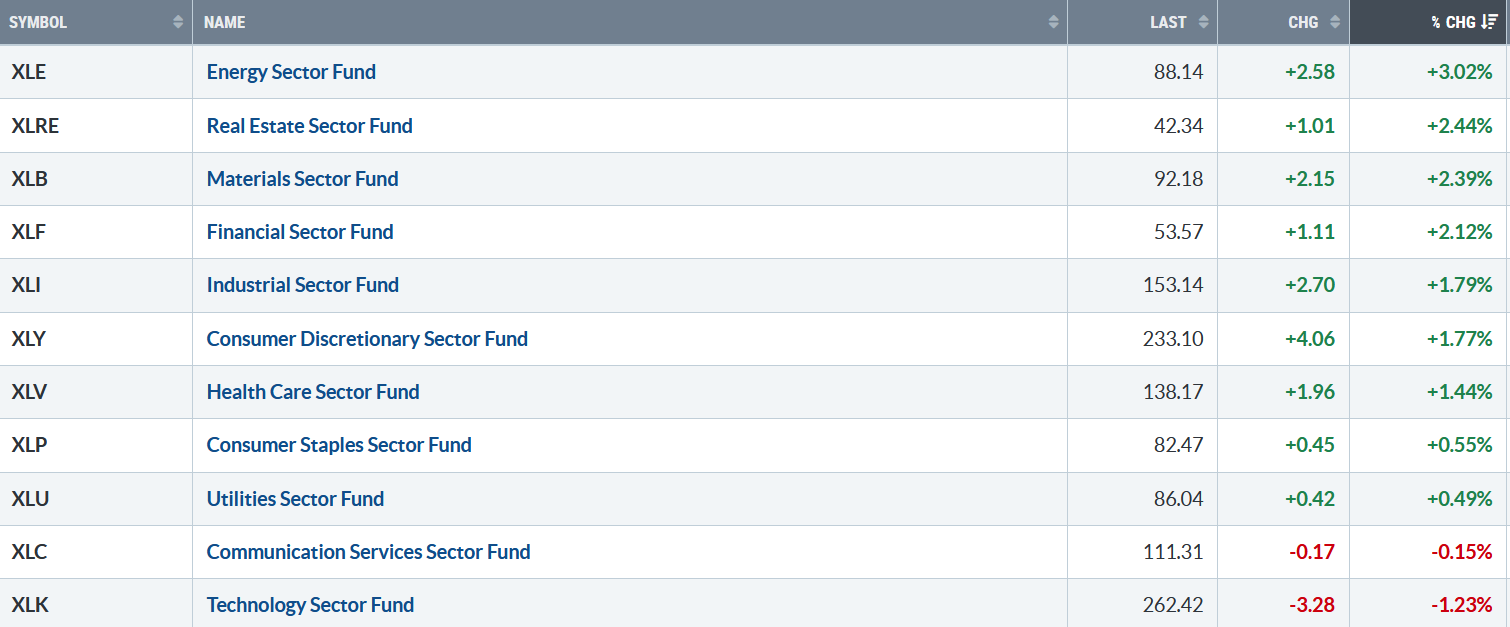
Strong gains after Powell’s speech on Friday. Nine of the eleven S&P SPDR sectors were higher for the week. Energy (XLE) and Real Estate (XLRE) were the strongest, while Consumer Services (XLC) and Technology (XLK) were the weakest sectors. The SPDR S&P 500 ETF Trust (SPY) rose +0.29%.
S&P SPDR Sector ETFs Performance Summary 8/15/25 – 08/22/25
082225 weekly SPDR Sectors
Source: Stockcharts.com
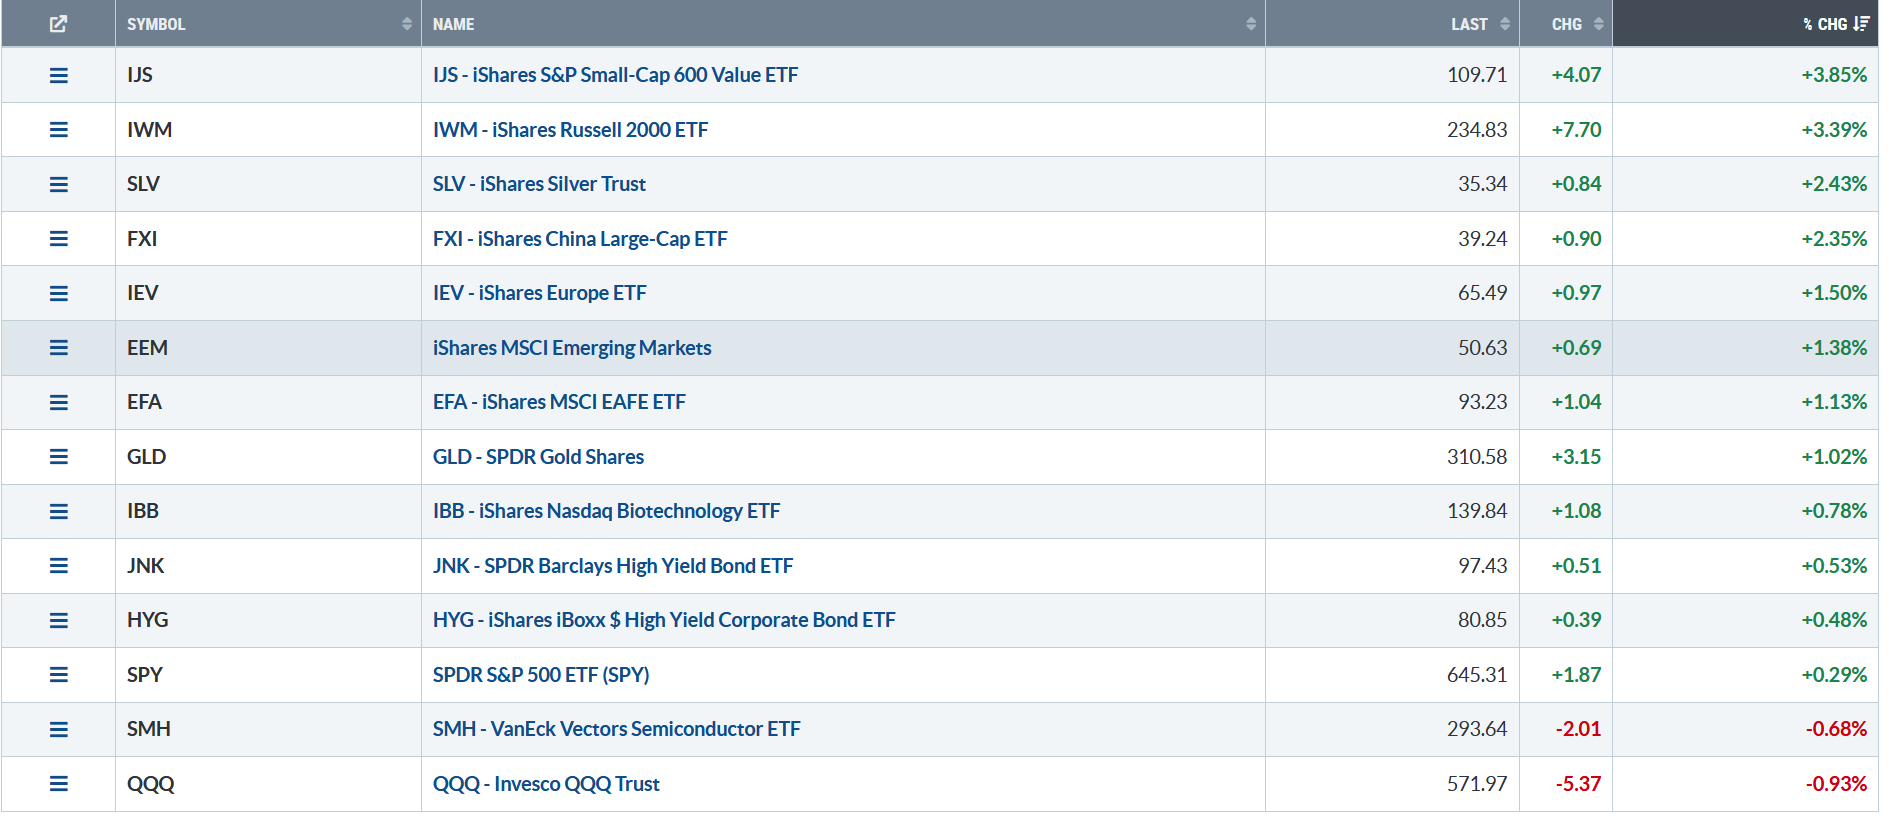
Figure 2: Bonnie’s ETFs Watch List Performance Summary 8/15/25 – 08/22/25
082225 Bonnie’s ETF Watch L
Source: Stockcharts.com
Small Cap Value and Small Cap Growth were hot; international markets were strong, as the dollar weakened, while Semiconductors and Technology were out of favor.
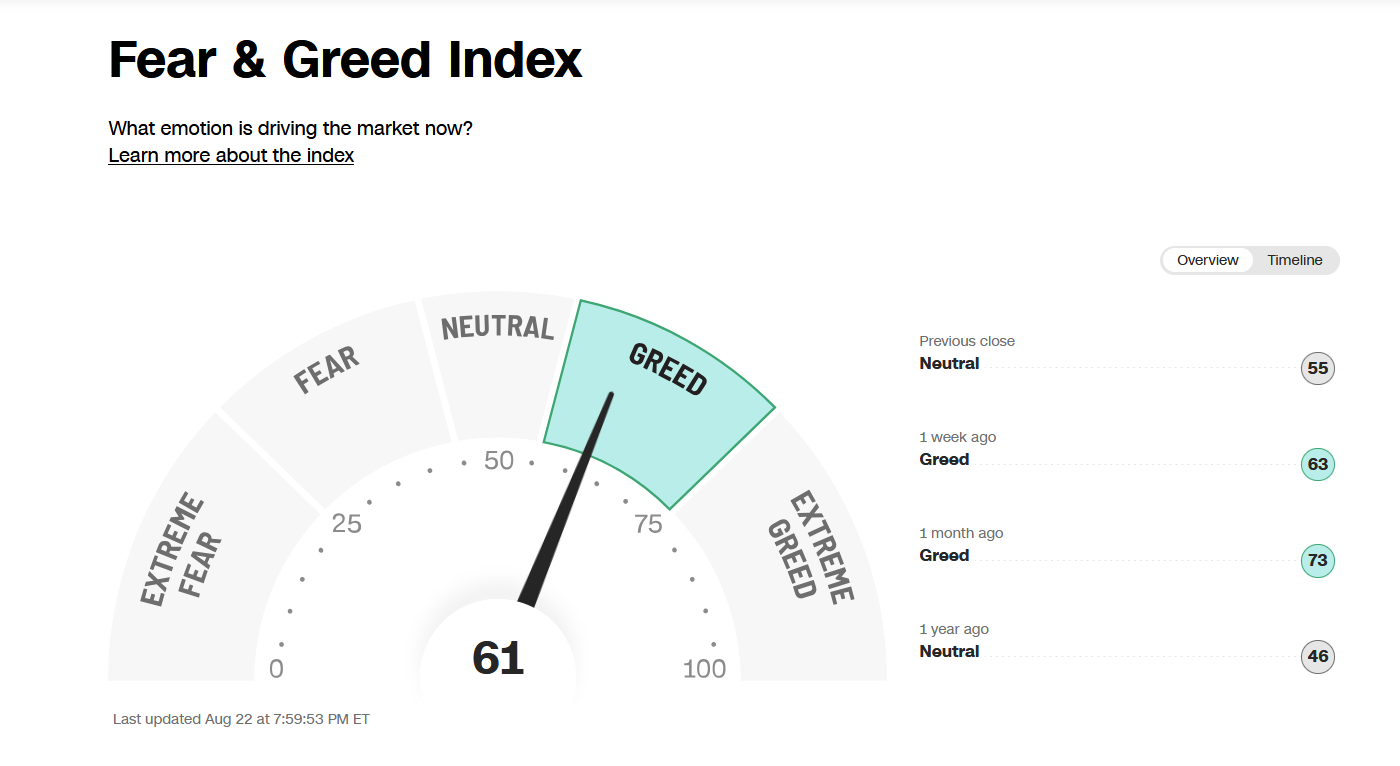
Figure 3: Fear & Greed Index
082225 CNN Fear and Greed
Source. CNN.com
Investor sentiment, as measured by the Fear and Greed Index (a contrarian indicator), fell slightly to 61, remaining in a Greed phase. If it rises to Extreme Greed, it would imply too much optimism and be considered negative in the short run.
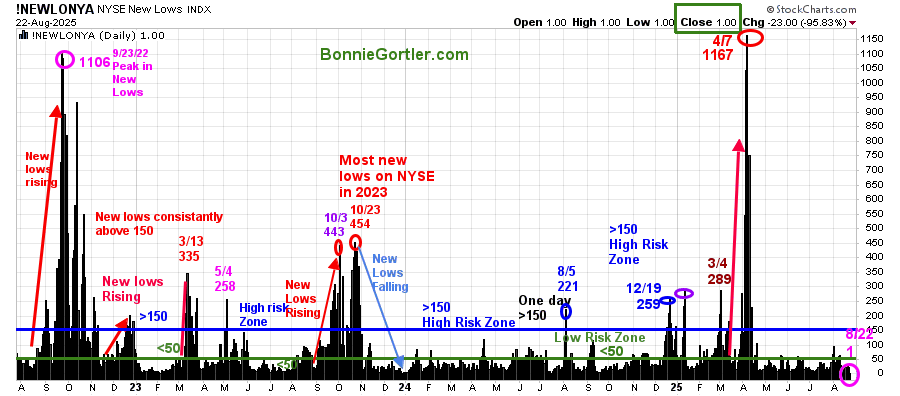
Figure 4: NYSE New Lows
082225 NYSE New Lows
Source: Stockcharts.com
New Lows On The NYSE peaked at 1167 on 4/7/25, then contracted sharply as the market bottomed in April.
New Lows were nonexistent, closing Friday, 8/22 at 1, remaining in the very low-risk zone where prices tend to rise.
It will remain positive in the short term if New Lows stay between 25 and 50. On the other hand, if new lows begin to increase and exceed 150, it would be negative.
Learn more about the significance of New Lows in my book, Journey to Wealth, published on Amazon. For a chapter preview of Journey To Wealth, visit here.
Figure 5: CBOE Volatility Index (VIX)
082225 VIX Daily
Source: Stockcharts.com
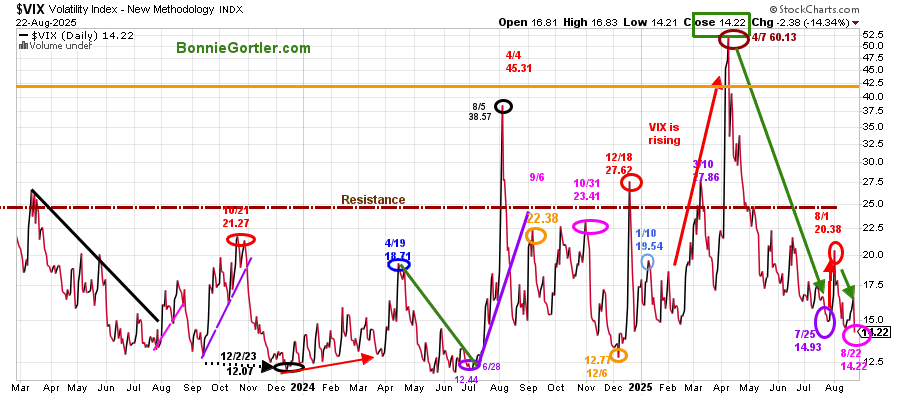
The CBOE Volatility Index (VIX), a measure of fear, peaked on 4/7.
The VIX continued to fall last week, closing at 14.22 after rising to 20.38 on 8/1. A reading above 20.38 would be the first sign that intraday volatility is more likely to increase. Above 25.00 would likely imply that VIX will continue to rise and could jump between 32 and 40 quickly if there is news that rates will not be cut in September.
Learn how to implement a powerful wealth-building mindset and charting strategies to help you grow your wealth in the comfort of your home in my eCourse Wealth Through Investing Made Simple. Learn more here.
Figure 6: S&P 500 Weekly (SPY) and 12-26-9 MACD (Middle), and Money Flow (Bottom)
082225 SPY Weekly
Source: Stockcharts.com
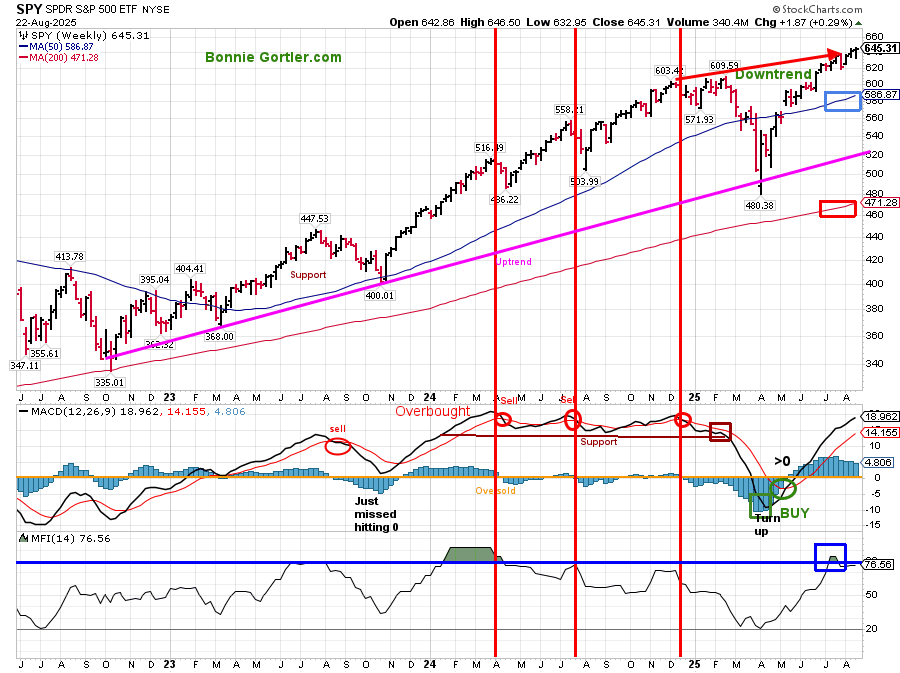
The S&P 500 (SPY) remains in an intermediate uptrend from October 2022.
After hitting a low in April 2025, SPY consolidated its gains and then broke out of its channel, followed by SPY making new all-time highs.
The MACD (middle chart) remains on a buy, above 0, and rising. A weekly close below 632.95 would imply a pullback toward 620.00 and potentially more.
The MFI Index, which peaked at above 80, has turned down, closing at 76.56.
Summing Up:
After hitting the daily projection of 635.00, the SPY continues resilient, with only a minor retracement. The intermediate upside projection of 700.00 is getting closer to being met. A weekly close below 632.95 would negate the intermediate upside projection of 700.00.
Discover how to cultivate a powerful wealth-building mindset and effective charting strategies to grow your wealth from the comfort of your own home in my eCourse, Wealth Through Investing Made Simple. Learn more here.
Figure 7: S&P 500 Daily (SPY) Price (Top), 12-26-9 MACD (Middle), and Money Flow (Bottom)
082225 SPY Daily
Source: Stockcharts.com
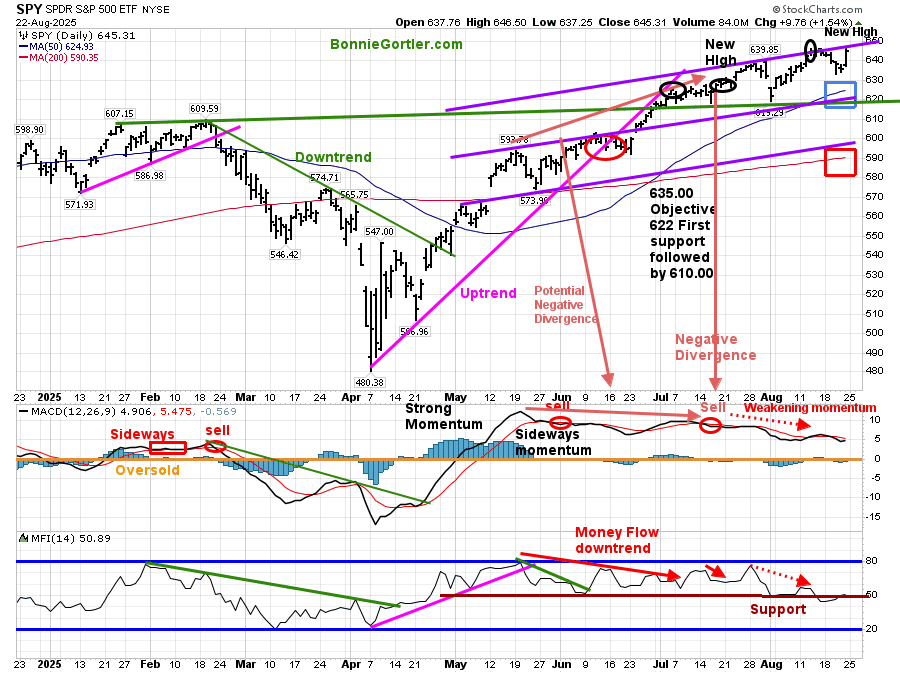
The S&P 500 (SPY) rose slightly on Friday, up +1.54%, to finish the week higher by +0.29% after declining early in the week, holding support. SPY closed above the 50- and 200-day moving averages.
Support is at 633.00, 622.00, 610.00, and 585.00. Two closes above 647.00 would imply further gains towards 670.00, followed by 700.00, the intermediate objective.
MACD (middle chart) remains on a sell signal, above 0, and rising. The negative divergence (a higher high in price with a lower high in MACD) persists. No fresh buy can occur until the MACD falls below 0.
The Money Flow Index (lower chart) broke slightly below 50. A turn down now would be unfavorable.
Summing Up:
The S&P 500 pulled back early in the week but held support as the buyers stepped in yet again. The daily chart shows weakening momentum and declining Money Flow, which remains worrisome. The intermediate trend has a higher objective of 700.00 as long as SPY closes above 633.00.
I invite you to join my Charting Facebook Group. Learn more about it here: Wealth Through Market Charts.
Figure 8: Daily iShares Russell 2000 (IWM) Price (Top),12-26-9 MACD (Middle), and Money Flow (Bottom)
082225 IWM Daily
Source: Stockcharts.com
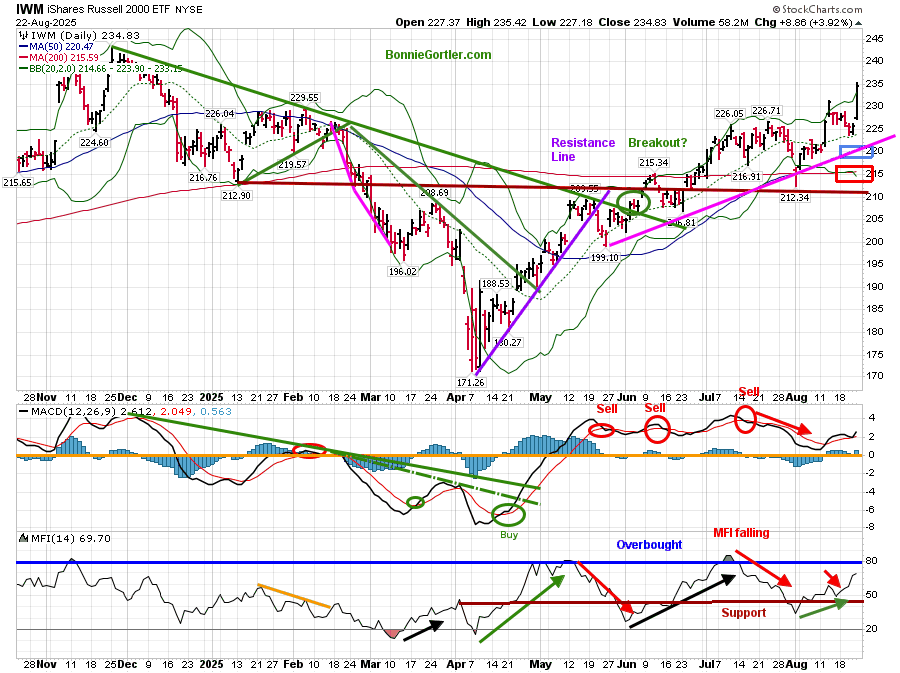
The iShares Russell 2000 Index ETF (IWM) had a strong week, up +3.39% hitting the upper Bollinger Band last week, and closing well above the 50-day moving average (blue rectangle) and the 200-day moving average (red rectangle), implying underlying strength.
Support is at 227.00, 220.00, 214.00, and 210.00. Resistance remains at 243.00.
The MACD (middle chart) remains on a sell signal, above 0, and rising.
The Money Flow (lower chart) reached 80 earlier in May and July, indicating an overbought condition, turned down, but has been trending higher since August.
In case you missed my interview with Ryan Redfern, brought to you by the National Association of Active Investment Managers (NAAIM), you can view it here.
Figure 9: Daily Semiconductors (SMH) (Top), 12-26-9 MACD (Middle), and Money Flow (Bottom)
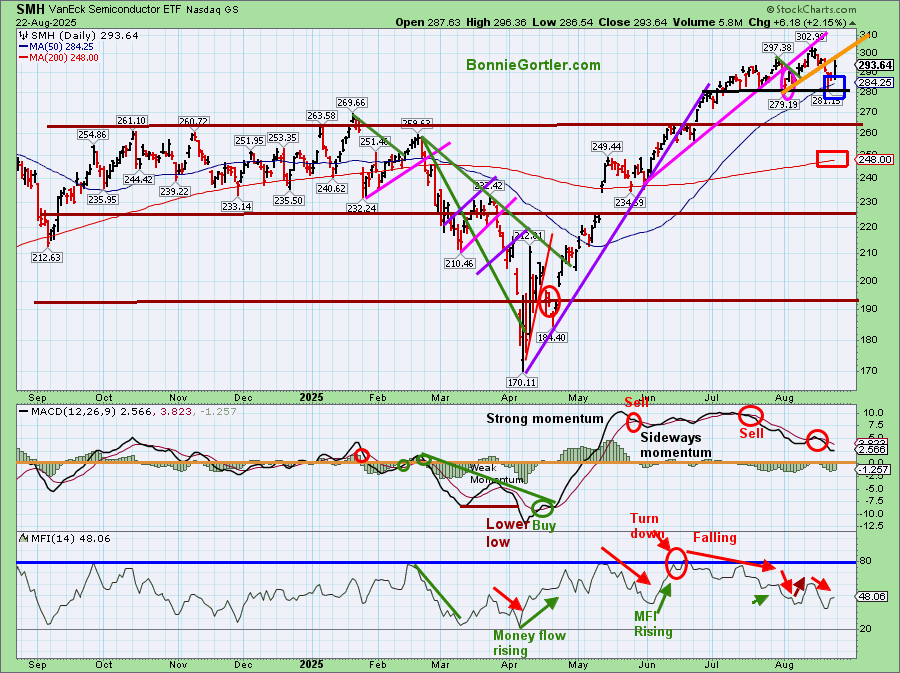
082225 SMH Daily
Source: Stockcharts.com
The top chart shows the Daily Semiconductor (SMH) ETF, which is concentrated mainly in US-based Mega-Cap Semiconductor companies. SMH tends to be a leading indicator for the market when investors are willing to take on increased risk, and the opposite is true when the market is falling.
SMH fell -.68% last week, thanks to Friday’s rise of +2.15% closing above support (mentioned in the 8/15 market update) at 290.00 with a low during the week of 286.54. SMH continues to trade within a tight range, closing above the rising 50-day MA (blue rectangle) and the 200-day MA (red rectangle). The pace of gains has slowed in recent weeks.
Support is at 282.00, 272.00, 265.00, 256.00, and 242.00. Resistance is at 302.00 with an upside objective of 315.00. Two closes below 265.00 would negate the upside objective.
The MACD (middle chart) remains on a sell signal, not yet in position for a fresh buy.
The Money Flow (lower chart) has declined since June, after reaching above 80. Note that the intermediate chart of SMH (not shown) has also hit 80 and is falling.
SMH can be highly volatile. If there is leadership in Semiconductors (SMH), it would have a short-term positive impact. On the other hand, if SMH is weak and closes below 282.00, a pullback is likely to trigger stops and profit-taking. Volatility in Semiconductors could pick up this week as NVIDIA (NVDA) will release earnings after the close on Wednesday.
Figure 10: QQQ Daily Invesco QQQ Trust (QQQ) Price (Top), 12-26-9 MACD (Middle), and Money Flow (Bottom)
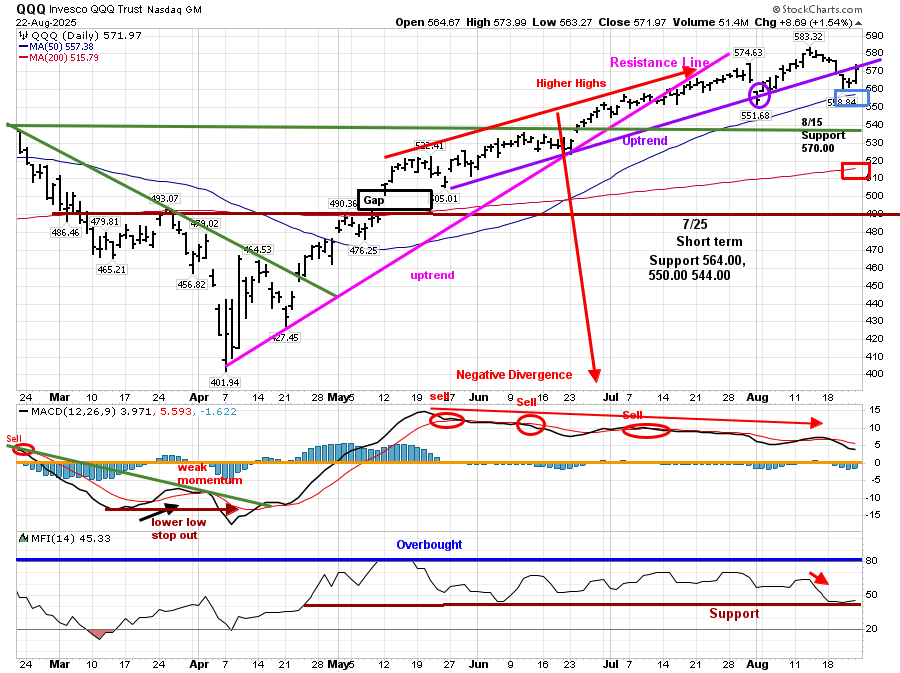
082225 QQQ Daily
Source: Stockcharts.com
The Chart shows the daily Invesco QQQ, an exchange-traded fund based on the Nasdaq 100 Index.
Nasdaq 100 (QQQ) fell -0.93% last week, after hitting its daily objective of 580.00 with a high of 583.32 on 8/13/22. QQQ remains above the 50-day MA (blue rectangle) and the 200-day MA (red rectangle).
Support is at 570.00, 563.00, 550.00, and 540.00. Resistance is at 583.00.
The daily MACD remains on a sell signal above 0, with repeat sell signals on declining momentum, and a negative divergence is looming.
Money Flow continues to make lower highs but is holding support (brown line) from May.
Summing Up:
The Dow rallied to an all-time high on Friday, after Federal Reserve Chair Jerome Powell at the Fed’s Jackson Hole symposium had a dovish tone towards lower interest rates. The market continues to be resilient, and the buy-the-dip mentality persists. Technically, its positive Small Cap stocks are gaining relative strength, a potential rotation into them after being out of favor. Market breadth was impressive as more stocks participated in the rally. New Lows on the New York Stock Exchange are nonexistent. September and October have historically been volatile months. All eyes are on Nvidia earnings on Wednesday after the close. For now, the bulls are in control. It’s wise to evaluate your portfolio and ensure you’re not taking on more risk than fits your lifestyle in case the exuberance fades. Manage your risk, and your wealth will grow.
If you would like to get to know each other better and grow your wealth, schedule your Wealth Building Free 30-minute Strategy Session today. Register Here.


Create more wealth in your life
with these simple strategies.
As an added bonus you will also
receive BG’s Updates and Ezine

Discover how to quickly create more well-being in your life with these simple strategies.
As an added bonus you will also
receive BG’s Updates and Ezine

As an added bonus you will receive BG’s Updates and Ezine

All work listed on BonnieGortler.com is licensed under a Creative Commons Attribution - Noncommercial - No Derivative Works 3.0 Unported License.


Free Report:
Grow and Sustain Your Wealth
Discover how to grow your money with these easy, simple steps.

