

10 Simple Tips for Financial Well-Being
07/01/2026
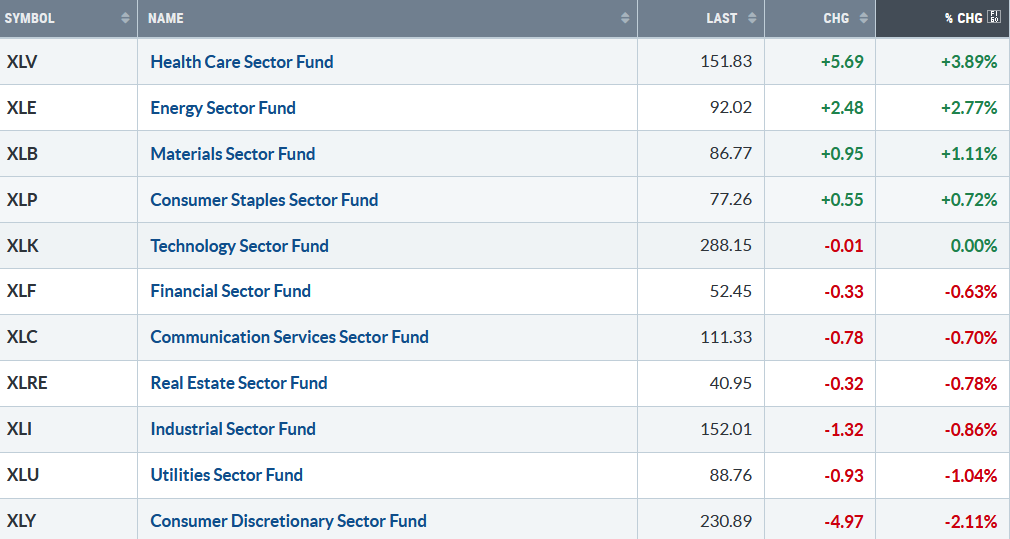
Intraday volatility has picked up in November. Last week, only four of the eleven S&P SPDR sectors were higher. Healthcare (XLV) and Energy (XLE) were the strongest sectors, while Utilities (XLU) and Consumer Discretionary (XLY) were the weakest. The SPDR S&P 500 ETF Trust (SPY) rose +0.14%.
S&P SPDR Sector ETFs Performance Summary 11/7/25 -11/14/25
111425 weekly SPDR Sectors
Source: Stockcharts.com
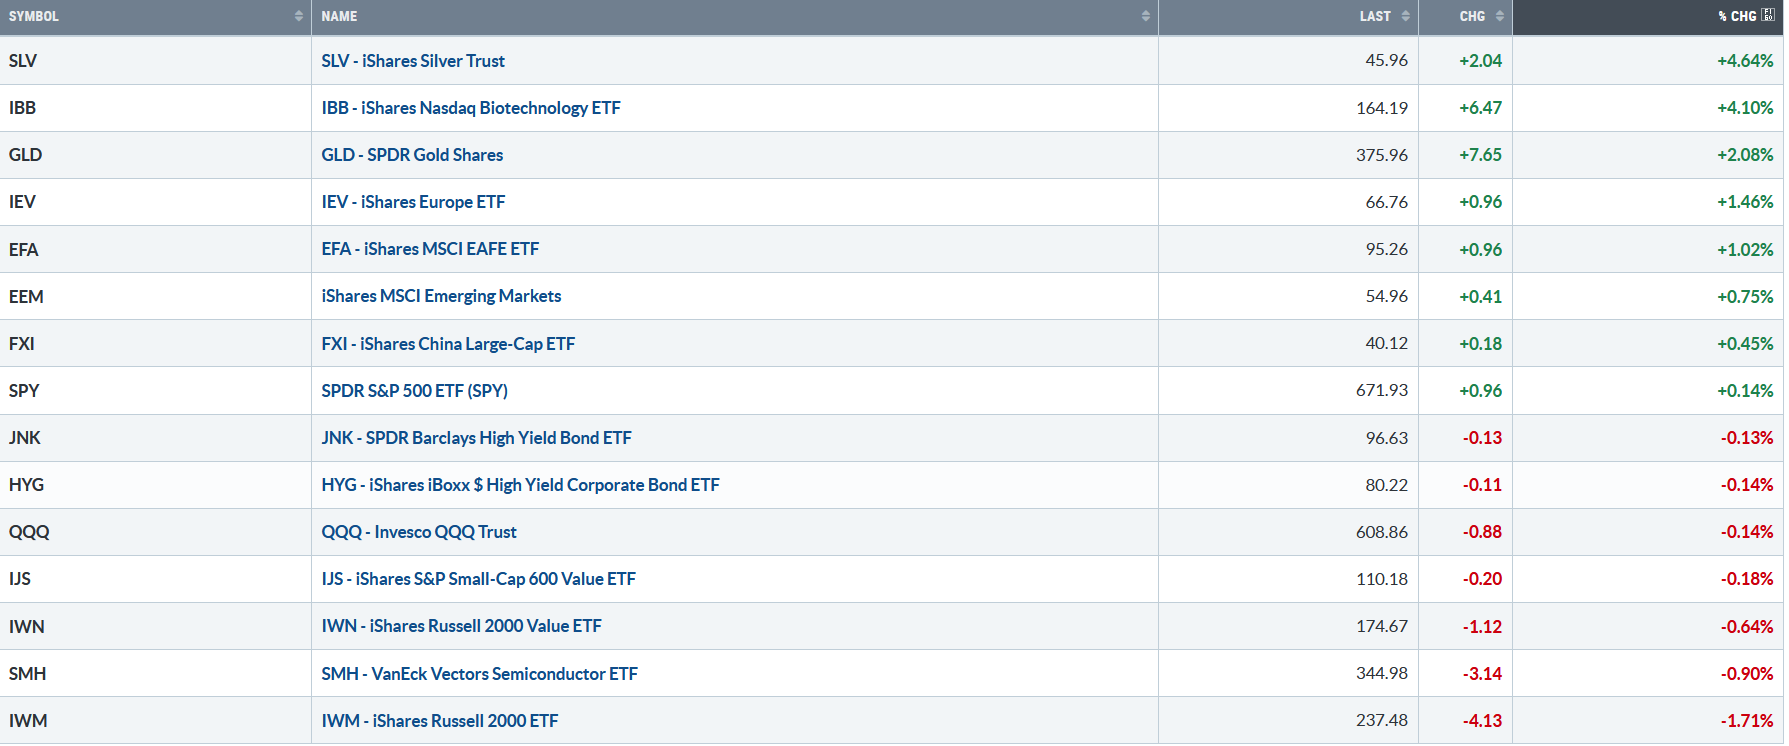
Figure 2: Bonnie’s ETFs Watch List Performance Summary 11/7/25 -11/14/25
111425 Bonnie’s ETF Watch List
Source: Stockcharts.com
Silver, Biotechnology, Gold, and Europe rose, outperforming the S&P 500 last week. Semiconductors and Small Cap Growth were weak.
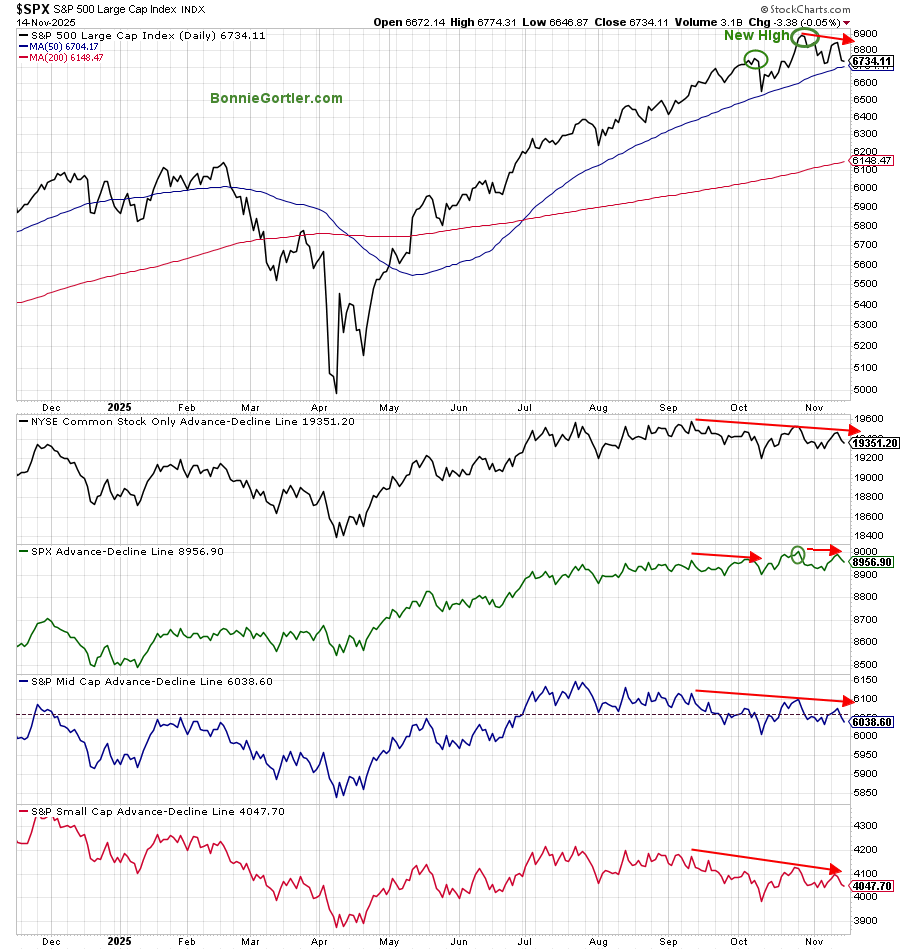
Figure 3: S&P 500 Price and NYSE, SPX, Mid and Small Cap AD Lines
111425 S&P 500 Price and Small Cap AD Lines
Source: Stockcharts.com
The S&P 500 reached a new high (top chart) in October, confirmed by the S&P 500 advance-decline line (third chart), but not yet in November. It’s worrisome that lower highs in breadth exist in the Common Stock New York Stock Exchange (NYSE), the S&P MidCap, and the S&P Small Cap Advance-Decline Line. If there is no confirmation, the rally will continue to narrow, making it harder to make money, and a more significant pullback could occur.
In Sum:
Divergences persist in key Advance-Decline Lines and warrant close monitoring.
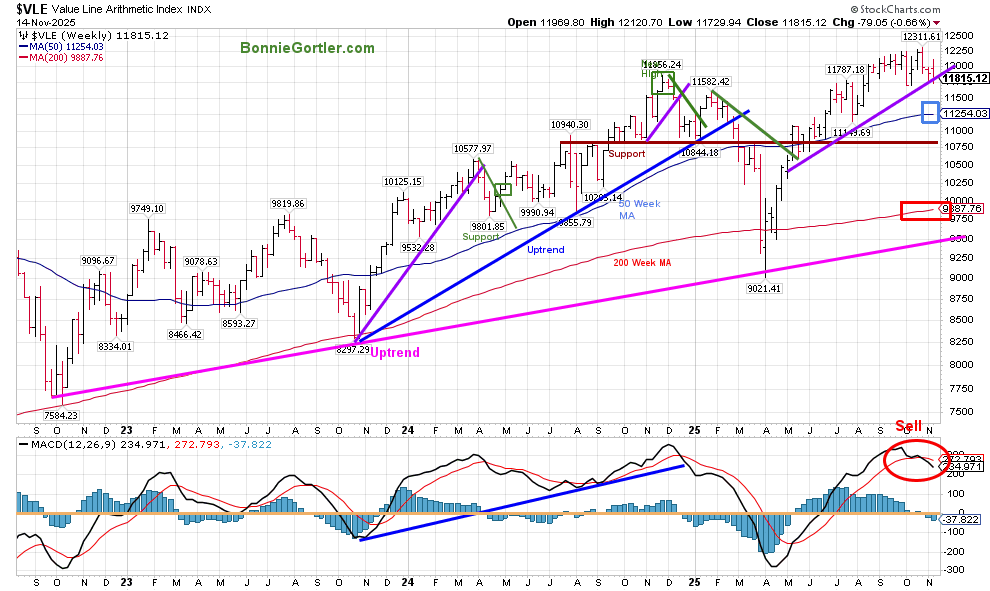
Figure 4: Value Line Arithmetic Average Weekly (Top) and 12-26-9 MACD (Bottom)
111425 VLE Weekly
Source: Stockcharts.com
The Value Line Arithmetic Index ($VLE) is a mix of approximately 1700 stocks.
The VLE intermediate uptrend, which began in October 2022 (pink line), remains in effect. On Friday, the May uptrend (purple line) breached its intraday high. However, VLE turned up intraday and closed above, a positive sign. VLE remains above its rising 50-week MA (blue rectangle) and the 200-week MA (red rectangle), implying underlying strength.
Support is at 11250 and 10750. Resistance is 11850 and 12300.
MACD (lower chart) is on a sell with weakening momentum.
If the VLE falls below support at 11250, expect further weakness in the short term. On the other hand, if the Value Line Arithmetic Average rises and surpasses the high, it would be positive in the short and intermediate terms.
Learn how to implement a powerful wealth-building mindset and charting strategies to help you grow your wealth in the comfort of your home in my eCourse Wealth Through Investing Made Simple. Learn more here.
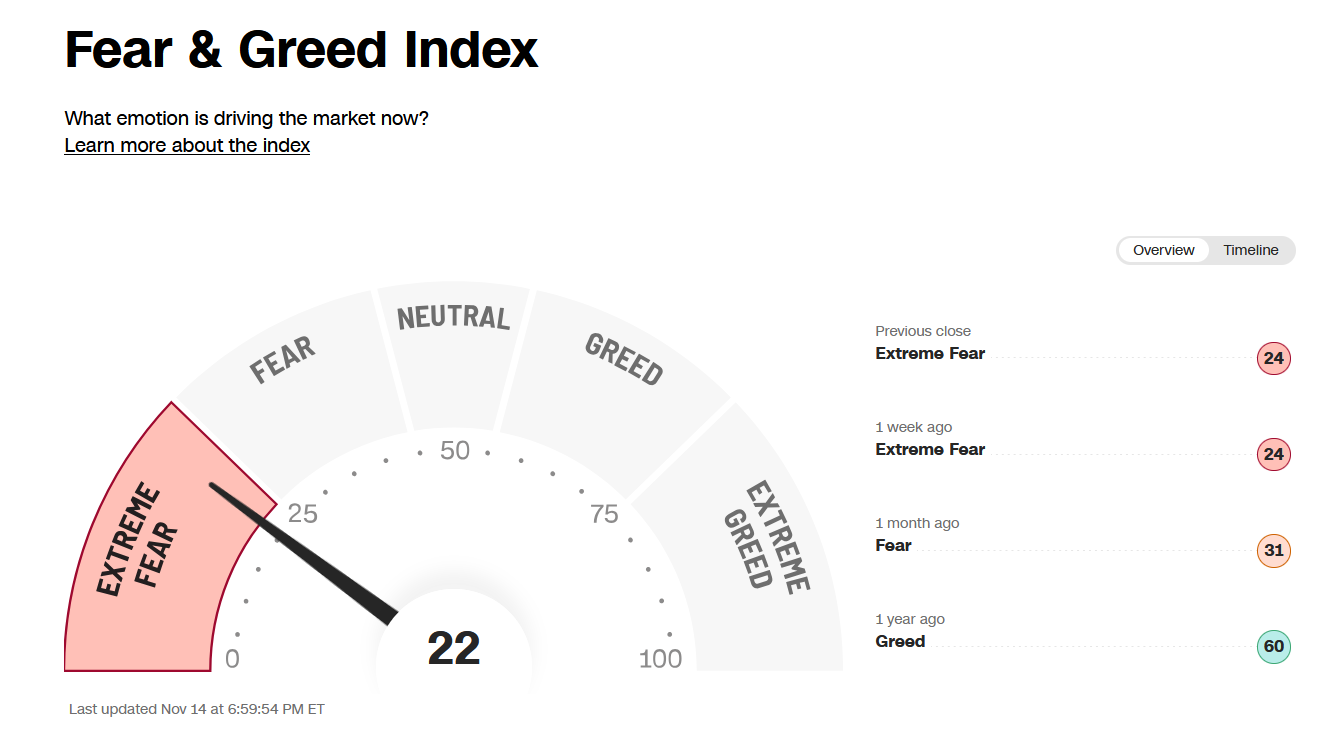
Figure 5: Fear & Greed Index
111425 CNN Fear and Greed
Source. CNN.com
Investor sentiment, as measured by the Fear and Greed Index (a contrarian indicator), closed at 22, Extreme Fear last week, despite the major averages trading near all-time highs. Many times, when in the extreme fear zone, good buying opportunities arise.
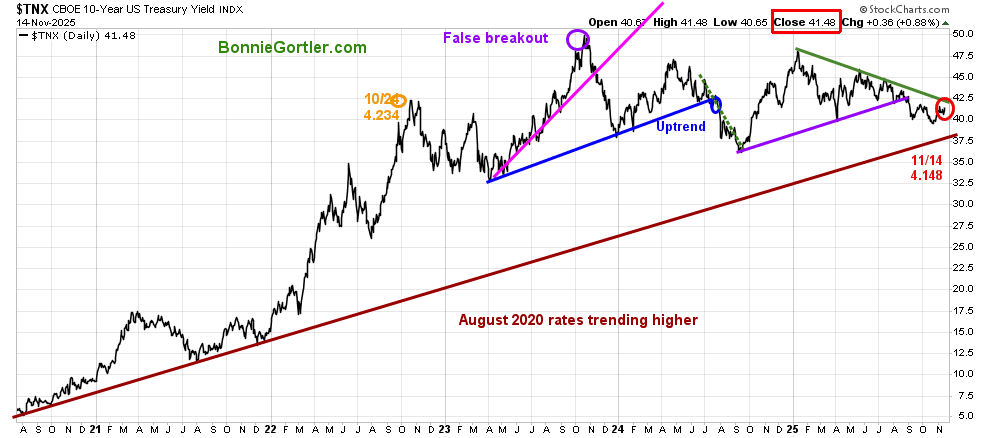
Figure 6: CBOE 10YR U.S. Treasury Yield Daily
111425 CBOE 10YR U.S. Treasury Yield Daily
Source: Stockcharts.com
The 10-year U.S. Treasury Yield rose last week, closing at 4.148%. The long-term uptrend that began in August 2020 remains. Yields falling below 3.750 would be positive, while yields closing above 4.275 would be negative for equities.
Learn how to implement a powerful wealth-building mindset and charting strategies to help you grow your wealth in the comfort of your home in my eCourse Wealth Through Investing Made Simple. New Module 7: Trading Alerts That Build Confidence and Reduce Risk. Learn more here.
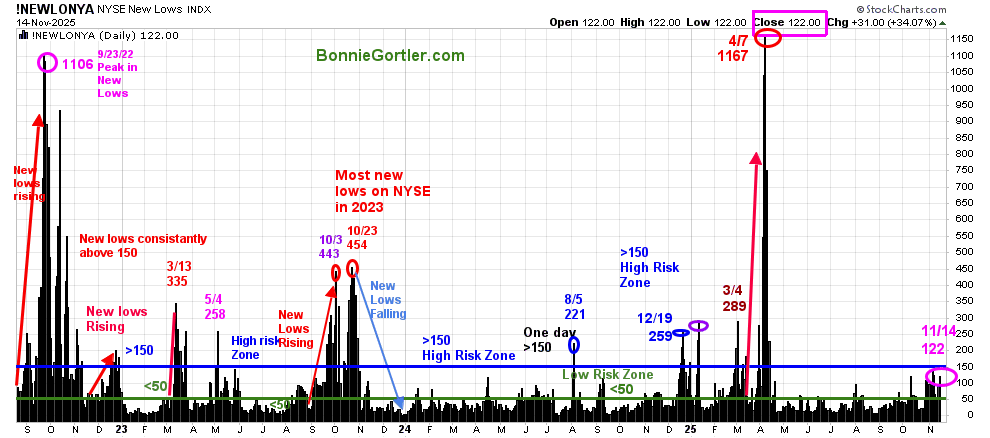
Figure 7: NYSE New Lows
1114 NYSE New Lows
Source: Stockcharts.com
New Lows On The NYSE peaked at 1167 on 4/7/25, then contracted sharply as the market bottomed in April.
New Lows have increased but remain below 150, closing Friday, 11/14, at 122. It would be positive in the short term if New Lows declines between 25 and 50. On the other hand, if new lows continue to increase and exceed 150, it would be a short-term negative, with more volatility and increased risk expected.
Learn more about the significance of New Lows in my book, Journey to Wealth, published on Amazon. For a chapter preview of Journey To Wealth, visit here.
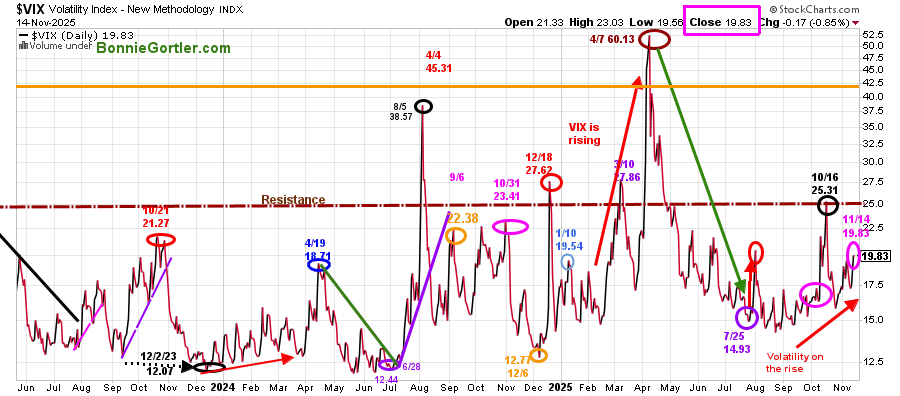
Figure 8: CBOE Volatility Index (VIX)
111425 VIX Daily
Source: Stockcharts.com
The CBOE Volatility Index (VIX), a measure of fear, peaked on April 7.
The VIX has increased over the past few weeks, closing at 19.83. Two closes above 25.00 would imply that the VIX will continue to rise and could jump between 32 and 40 quickly if there is any unexpected news.
Discover how to cultivate a powerful wealth-building mindset and effective charting strategies to grow your wealth from the comfort of your own home in my eCourse, “Wealth Through Investing Made Simple,” including the New Module 7: Trading Alerts That Build Confidence and Reduce Risk. Learn more here.
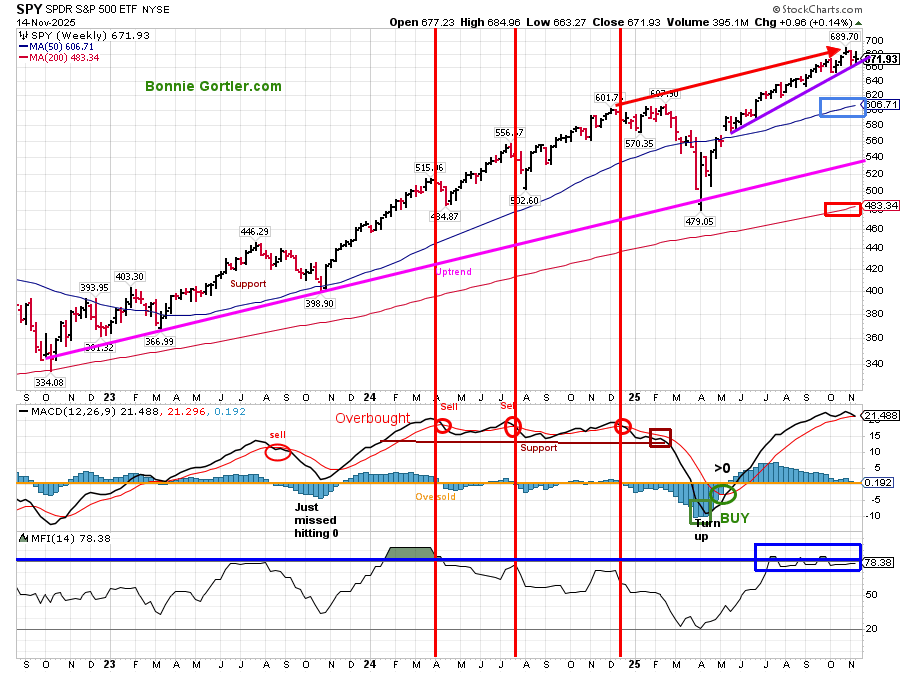
Figure 9: S&P 500 Weekly (SPY) and 12-26-9 MACD (Middle), and Money Flow (Bottom)
111425 SPY weekly
Source: Stockcharts.com
The S&P 500 (SPY) remains in an intermediate uptrend from October 2022. After hitting a low in April 2025, SPY consolidated its gains and then broke out of its channel, followed by SPY continuously making new all-time highs.
Despite the volatility and selling pressure, the S&P 500 closed higher by +0.14%. Keep an eye on the S&P 500’s most significant holdings, which comprise over 30% of the index and include Nvidia, Apple, Alphabet, Microsoft, Amazon, and Meta. Due to the significant weighting, as these stocks perform, the S&P 500 will likely follow.
MACD (middle chart), a momentum indicator, remains on a buy, overbought above 0, and falling with a double top forming.
The MFI Index hit 80 in July and remains overbought, indicating strength. There has not yet been any significant downturn, suggesting that money is not yet shifting out of the S&P 500. If MFI turns lower now, it would be considered a negative development.
Summing Up:
SPY remains resilient, with only minor retracements along the way. The intermediate upside projection remains at 700.00. A weekly close below 663.00 would imply a pullback toward 650.00, 640.00, 620.00, and 600.00. Support levels remain intact, leaving the bulls in control for now, but it could change quickly.
I invite you to join my Charting Facebook Group. Learn more about it here: Wealth Through Market Charts.
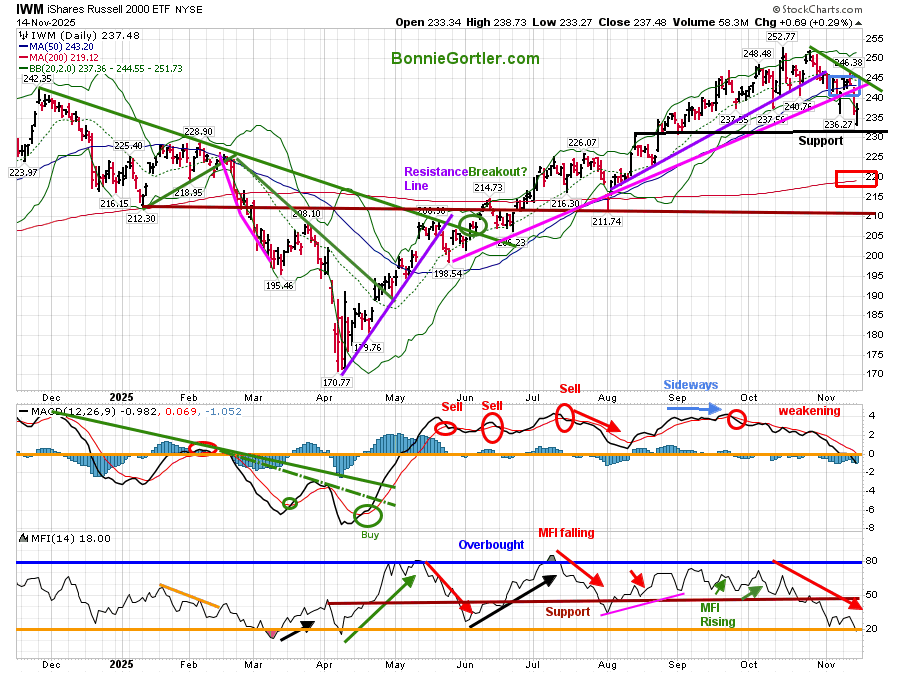
Figure 10: Daily iShares Russell 2000 (IWM) Price (Top),12-26-9 MACD (Middle), and Money Flow (Bottom)
111425 IWM Daily
Source: Stockcharts.com
The iShares Russell 2000 Index ETF (IWM) fell -1.71% for the week.
IWM uptrend from August (purple line) broke in late October, and weakness followed.
IWM closed below the 50-day moving average (blue rectangle) but above the 200-day moving average (red rectangle).
Support is at 232.00, 220.00, and 210.00. Resistance is at 240.00, 245.00, 248.00, and 252.00.
The MACD (middle chart) has been weakening since September and remains on a sell signal, having now reset, falling below 0. Strength in the IWM this week would generate a MACD buy signal.
The Money Flow (lower chart) continues to fall after breaking under support at 50 and is now oversold.
In Sum:
IWM is weaker than the S&P 500, and there is no sign of short-term strength yet. If IWM turns up and closes above 248.00 for two days, it would be short-term positive.
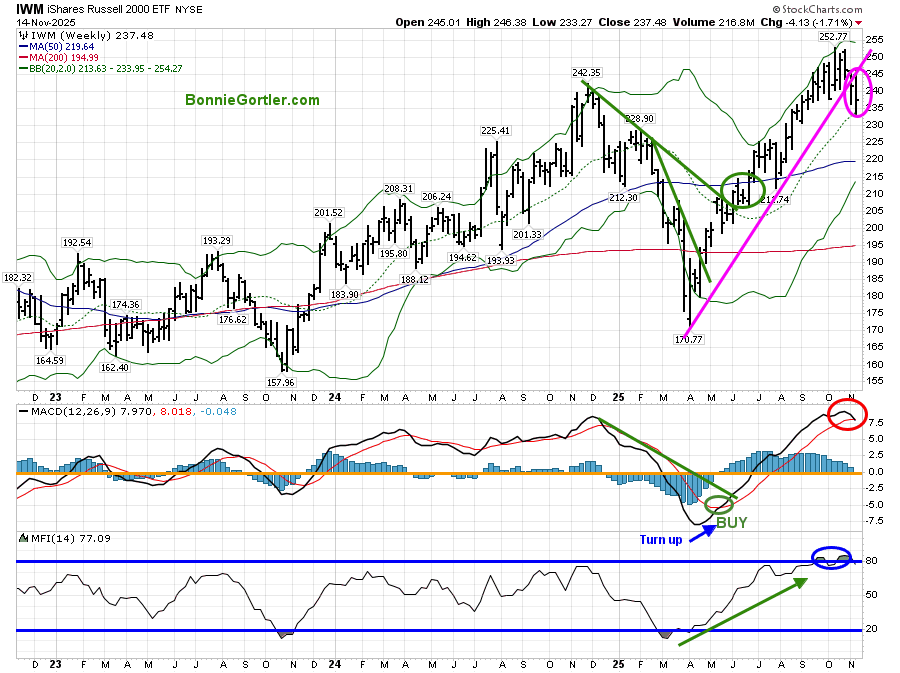
Figure 11: Weekly iShares Russell 2000 (IWM) Price (Top),12-26-9 MACD (Middle), and Money Flow (Bottom)
111425 IWM Daily
Source: Stockcharts.com
The Russell 2000 (IWM) April intermediate price uptrend is no longer intact.
MACD and Money Flow are both extended and have a dangerous pattern.
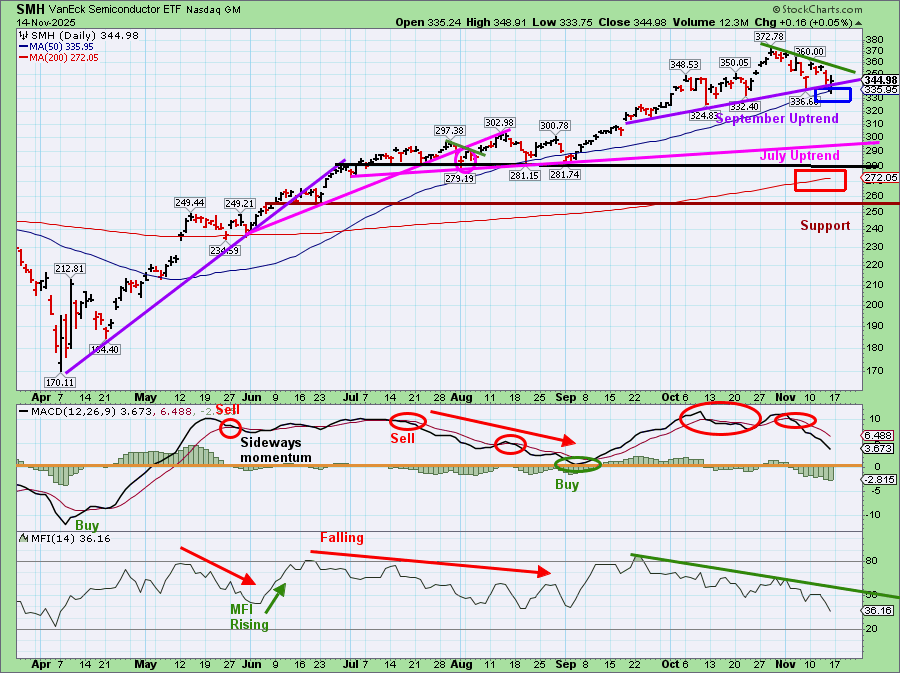
Figure 12: Daily Semiconductors (SMH) (Top), 12-26-9 MACD (Middle), and Money Flow (Bottom)
111425 SMH Daily
Source: Stockcharts.com
The top chart shows the Daily Semiconductor (SMH) ETF, which is concentrated mainly in US-based Mega-Cap Semiconductor companies. SMH can be highly volatile. SMH tends to be a leading indicator for the market when investors are willing to take on increased risk, and the opposite is true when the market is falling.
The September uptrend (purple line) remains after a slight penetration. SMH closed -0.90% last week remains above the 50-day MA (blue rectangle) and the 200-day MA (red rectangle),
Support is at 330.00, 310.00, and 290.00. Resistance is at 350.00, 360.00, and 372.00.
The MACD (middle chart) remains on a sell. The MACD has not yet fallen below 0, positioning it to generate a fresh buy signal.
The Money Flow (lower chart) closed at 36.16, and is falling.
If Semiconductors (SMH) weaken, closing two days below 330.00, it would be short-term negative and likely lead the broad market lower.
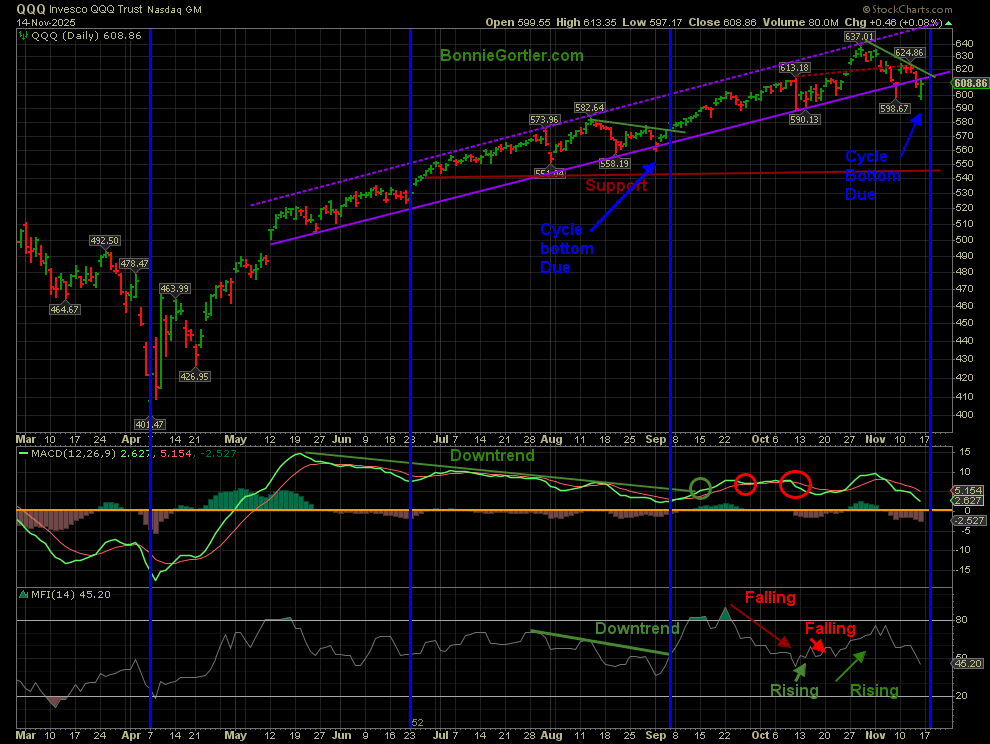
Figure 13: QQQ Daily Invesco QQQ Trust (QQQ) Price (Top), 12-26-9 MACD (Middle), and Money Flow (Bottom)
111425 QQQ Daily
The top chart shows the daily Invesco (QQQ), an exchange-traded fund based on the Nasdaq 100 Index.
Nasdaq 100 (QQQ) closed just under the uptrend (purple solid line), down -0.14 % for the week at 608.86. In September, QQQ bottomed after breaking the uptrend. Cycles are not perfect, yet they can help in anticipating potential turning points and can be a powerful tool when used in conjunction with support or resistance lines. We are again due for a cycle bottom. Two closes below 597.07 would be negative and imply the bottom could be a short-term top, not a bottom. Time will tell.
Support is at 597.00, 590.00, 570.00, 557.00, 551.00, and 540.00.
In summary: A cyclical bottom in the Nasdaq 100 (QQQ) is only a few days away, but it may have occurred early, as indicated by last Friday’s price action. A retest early in the week may occur, but given that Technology leadership has fueled the rally in 2025, it’s too early to say this trend is over.
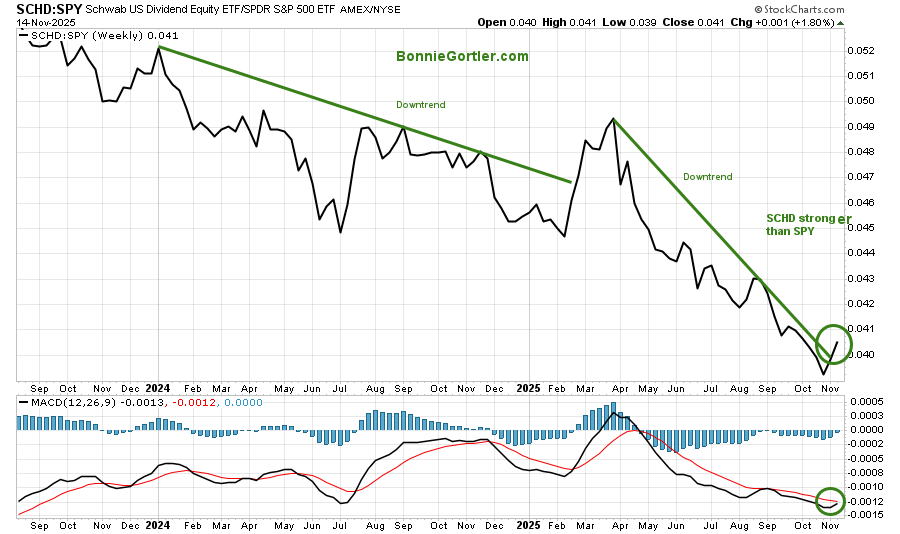
Figure 14: Schwab US Dividend Equity ETF /S&P 500 (SPY)
111625 Schwab US Dividend Equity ETF SCHD/S&P 500 (SPY) Relative Strength Ratio
Source: Stockcharts.com
Defensive sectors have improved since aggressive stocks have been under selling pressure the last few weeks. The Dividend Equity ETF relative strength ratio has turned up and broken the March downtrend relative to the S&P 500. The MACD lower chart is close to generating a buy signal. If a buy is generated, it will confirm the relative strength breakout.
Figure 15: Schwab US Dividend Equity ETF Top Holdings
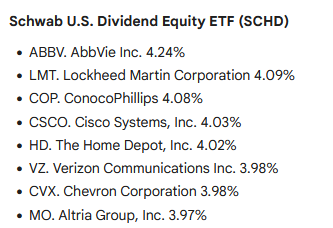
Source: Schwab
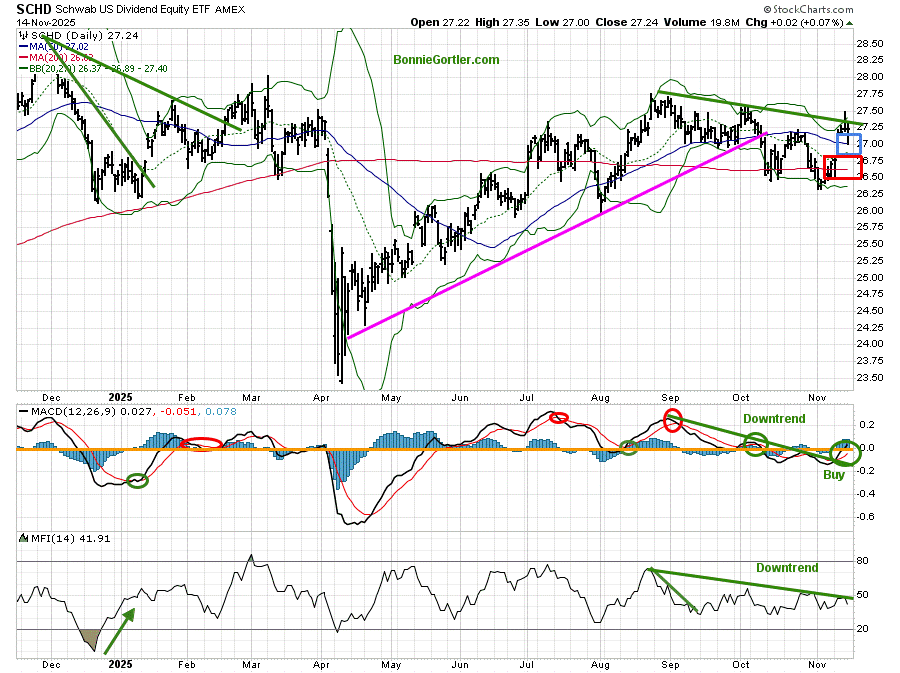
Figure 16: Schwab US Dividend Equity ETF
111425 SCHD Daily
Source: Stockcharts.com
Schwab US Dividend Equity ETF (SCHD) gives exposure to dividend-paying U.S. equities. SCHD has been in a downtrend since September and may be ready to break the downtrend and attract buyers. MACD (middle chart) has generated a buy signal and broken the momentum downtrend. Money Flow has not confirmed, but it is in a position to break its downtrend.
Support is at 26.25, and resistance is at 27.50.
Summing Up:
Major US indices experienced their largest one-day decline in over a month. The major averages continue to hold support despite an increase in intraday volatility. Market breadth has weakened considerably and is flashing warning signals that, if there is no improvement in breadth, it could set the stage for a short-term pullback despite a long-term cycle bottom in the Nasdaq 100 QQQ. The fourth quarter is typically the best of the year. Continue to give the benefit of the doubt to the bulls, but prioritize reviewing your portfolio if support levels do not hold. Manage your risk, and your wealth will grow.
If you would like to get to know each other better, schedule your Free 30-minute Wealth Building Strategy Session today. Register Here.


Create more wealth in your life
with these simple strategies.
As an added bonus you will also
receive BG’s Updates and Ezine

Discover how to quickly create more well-being in your life with these simple strategies.
As an added bonus you will also
receive BG’s Updates and Ezine

As an added bonus you will receive BG’s Updates and Ezine

All work listed on BonnieGortler.com is licensed under a Creative Commons Attribution - Noncommercial - No Derivative Works 3.0 Unported License.


Free Report:
Grow and Sustain Your Wealth
Discover how to grow your money with these easy, simple steps.


3 thoughts on “Bonnie’s Market Update 11/14/25”