

10 Simple Tips for Financial Well-Being
07/01/2026
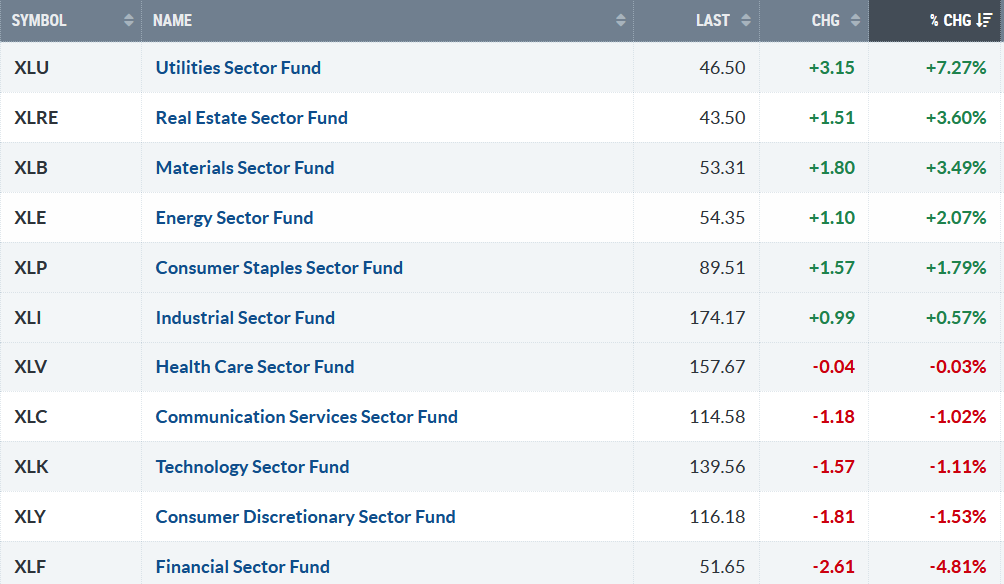
February volatility continues. Six of the eleven S&P SPDR sectors were higher last week. Utilities (XLU) and Real Estate (XLRE) were the strongest, while Consumer Discretionary (XLY) and Financials (XLF) were the weakest. The SPDR S&P 500 ETF Trust (SPY) fell 1.28%.
S&P SPDR Sector ETFs Performance Summary 2/6/26-2/13/26
021326 SPDR Sectors
Source: Stockcharts.com
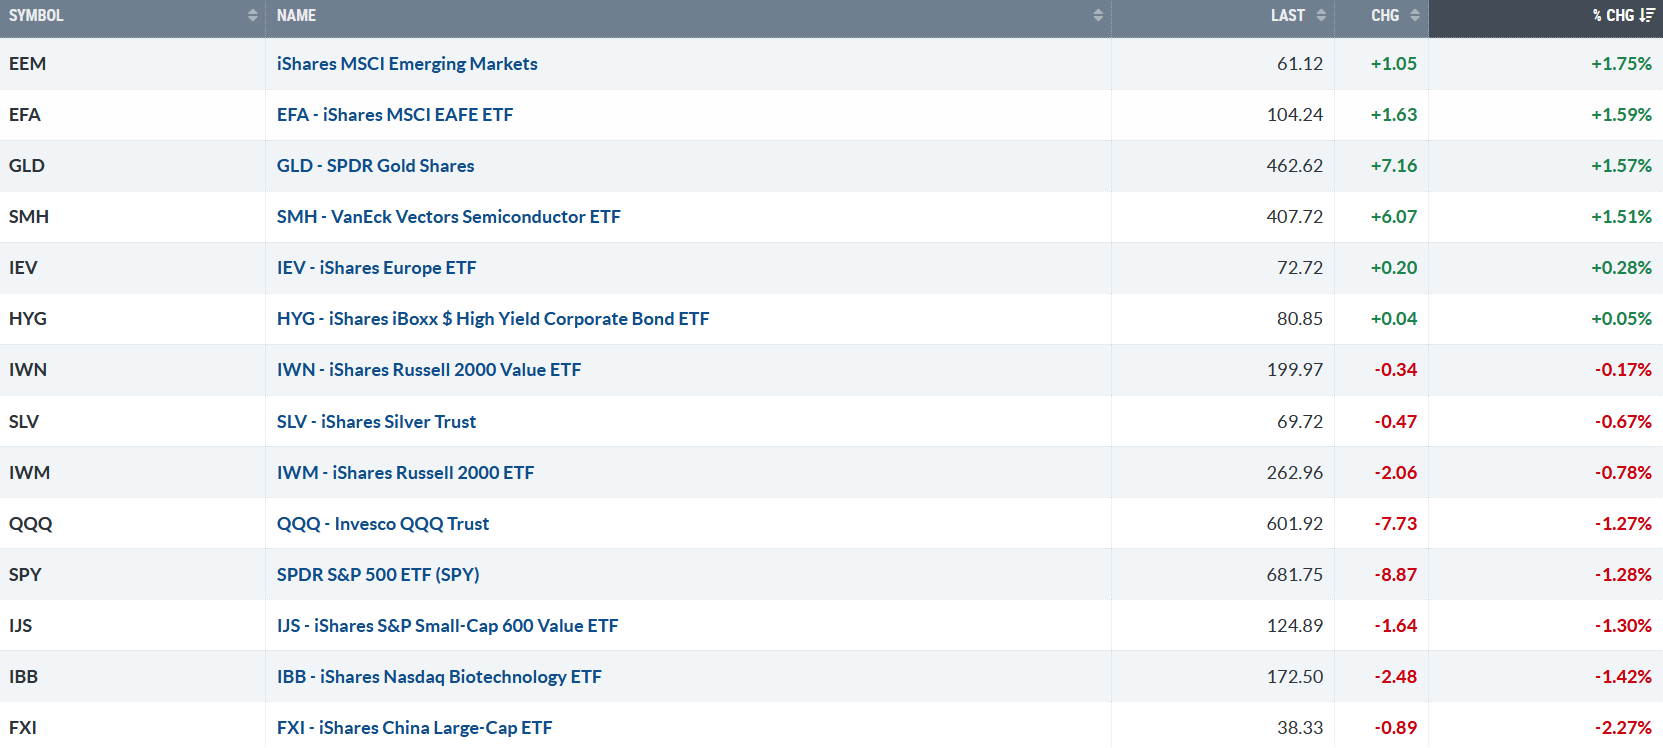
Figure 2: Bonnie’s ETFs Watch List Performance Summary 2/6/26-2/13/26
21326 Bonnie’s ETF Watch List
Source: Stockcharts.com
Emerging markets led, while China lagged. Gold and Semiconductors were positive, while Biotechnology Small Cap Growth and Value moved lower.
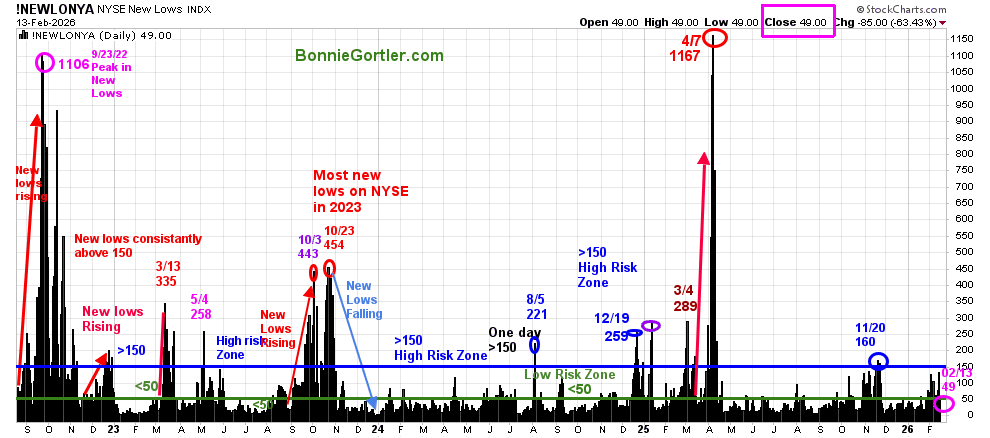
Figure 3: NYSE New Lows
021326 NYSE New Lows
Source: Stockcharts.com
After reaching a high of 127 New Lows on the New York Stock Exchange Index on 2/3/26, they declined to close at 49 on 2/13, a positive sign. It would be positive in the short term if New Lows stayed between 25 and 50. On the other hand, if new lows rise above 150 and continue to increase, it would be a short-term negative.
Learn more about the significance of New Lows in my book, Journey to Wealth, published on Amazon. For a chapter preview of Journey To Wealth, visit here.
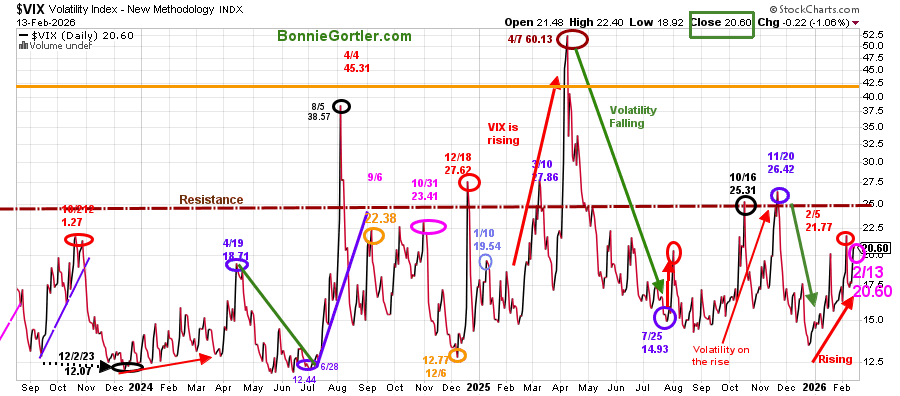
Figure 4: CBOE Volatility Index (VIX)
021326 VIX
Source: Stockcharts.com
The CBOE Volatility Index (VIX), a measure of Fear, peaked on 4/7 at 60.13 in 2025. The VIX has been increasing since December 2025, closing at 20.60. Two closes above 25.00 would further intensify selling pressure and imply a potential quick rise in VIX to 40, possibly higher, as investors become even more cautious.
You will find more of Bonnie’s market charts HERE.
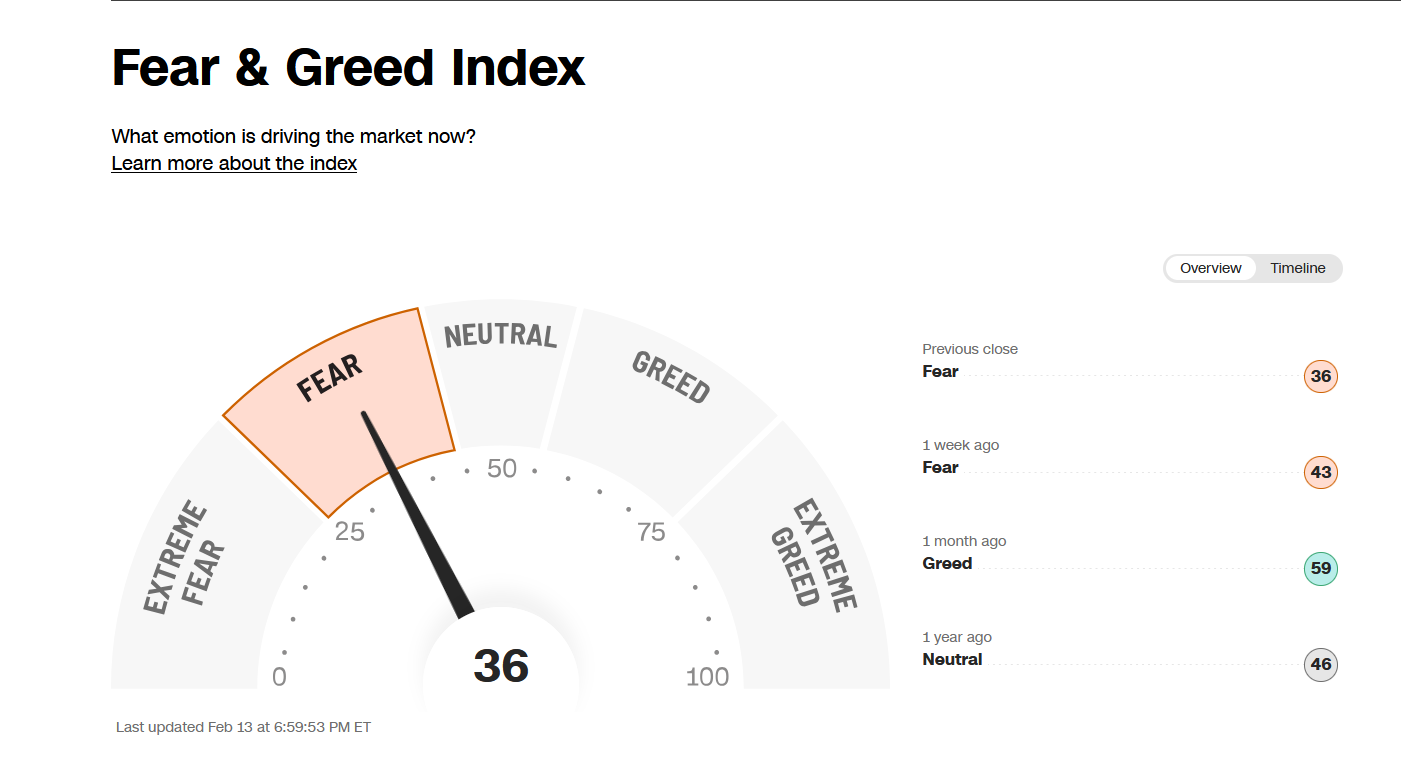
Figure 5: Fear & Greed Index
 Source. CNN.com
With the recent pullback, investor sentiment, as measured by the Fear and Greed Index (a contrarian indicator), declined to 36, a level that signals Fear and may trigger a short-term rally.
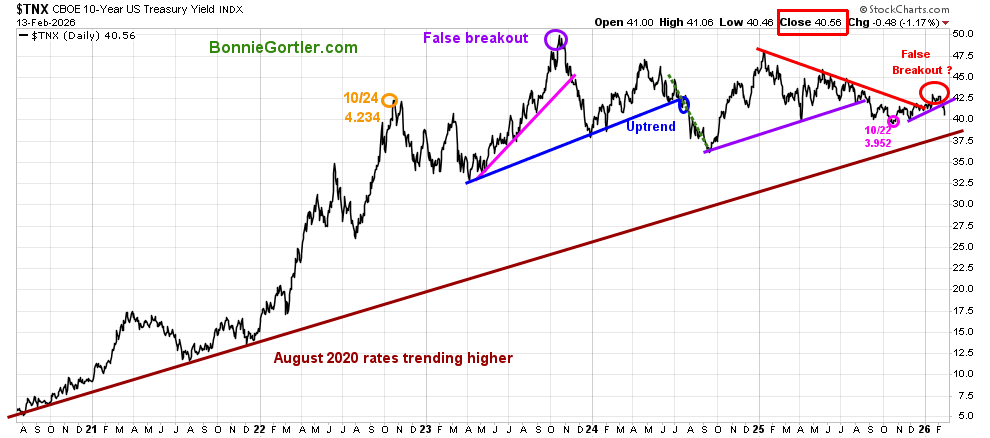
Figure 6: CBOE 10YR U.S. Treasury Yield Daily
021326 $TNX 10-Year US Treasury Yield
Source: Stockcharts.com
The long-term yield uptrend in 10-year U.S. Treasuries, which began in August 2020, persists.
The 10-year U.S. Treasury Yield last week fell to 4.056%, its lowest level since October 2025, when it fell below 4.00%. If yields continue to fall below 3.950%, it will likely support equities. On the other hand, if yields close above 4.30%, it could put pressure on equities in the short term.
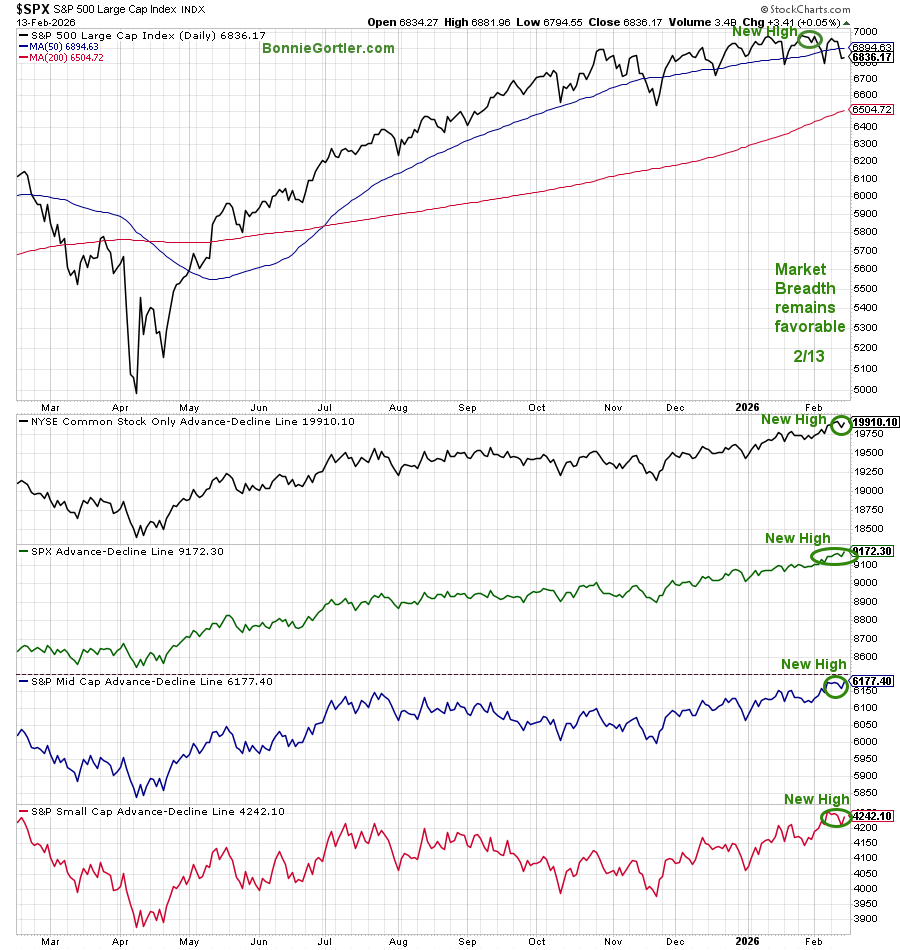
Figure 7: S&P 500 Price and NYSE, SPX, Mid and Small Cap AD Lines
021326 S&P 500 Price and NYSE, SPX, Mid and Small Cap AD Lines
Source: Stockcharts.com
Market breadth remains favorable. The advance-decline line of the NYSE Common Stock Index, the S&P 500, and the S&P Mid and Small Cap indices all made new highs in February, implying higher prices and a market top has not occurred.
Keep a close eye on market breadth to gauge whether the major averages will break out of the trading range. It would be positive for further gains in 2026 if market breadth continues to make new highs with its related averages.
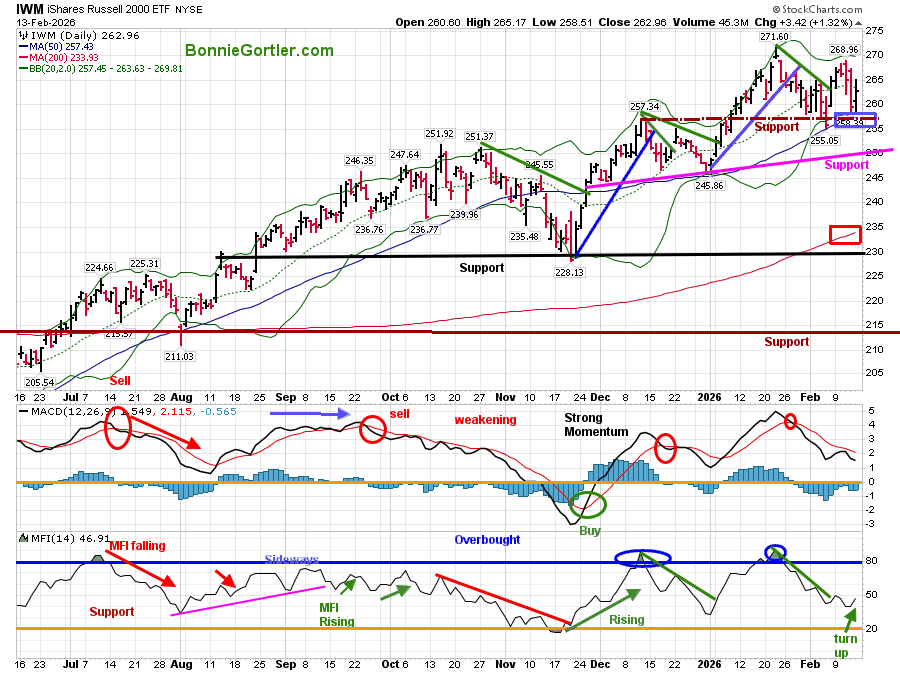
Figure 8: Daily iShares Russell 2000 (IWM) Price (Top),12-26-9 MACD (Middle), and Money Flow (Bottom)
021326 IWM Daily
Source: Stockcharts.com
The Russell 2000 (IWM) closed at 262.95, down -0.78% for the week, after falling short on its attempt to make a new high. IWM held support (brown dotted line) and closed above its 50-day Moving Average (blue rectangle), which is a sign of strength.
The MACD (middle chart) remains on a sell signal, continuing to work off its overbought condition without giving up too much ground. With momentum and positive breadth confirming the IWM price high, another rally is likely before a meaningful pullback.
IWM’s weekly relative strength ratio (chart not shown) continues to rise on an intermediate basis, which is a positive sign. Watch if Small Caps turn up and can show leadership this week, outperforming the S&P 500. If so, it’s likely to fuel the broader market higher. On the other hand, Small Caps lagging the S&P 500 and closing Friday, 2/20/26, below 257.00 would likely be short-term negative, with a retracement to between 245.00 and 250.00.
Learn charting strategies to help your short and intermediate trading in the comfort of your home in my eCourse, Wealth Through Investing Made Simple. New Module 7: Trading Alerts That Build Confidence and Reduce Risk. Learn more here.
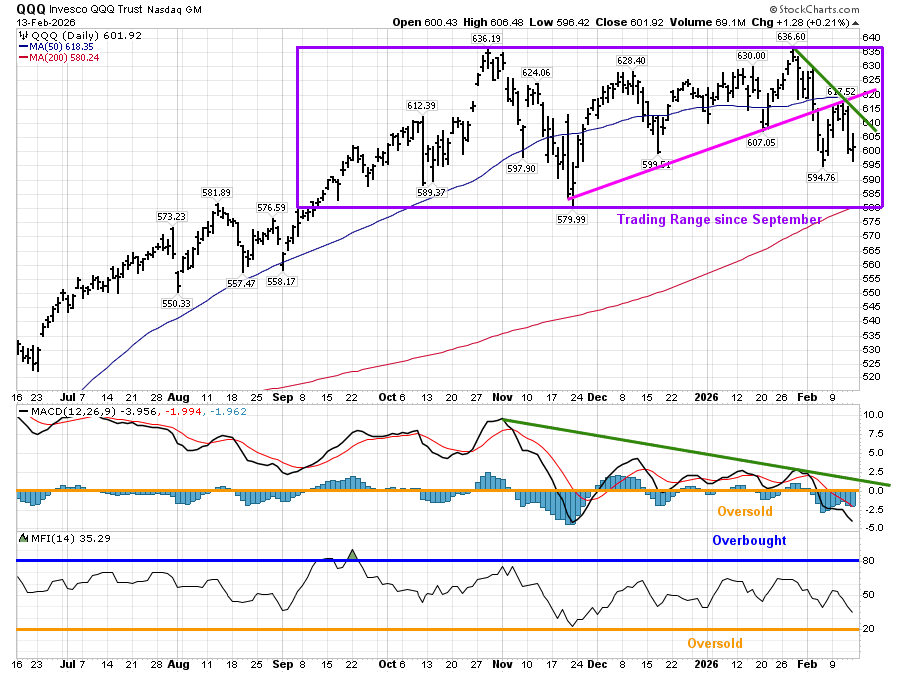
Figure 9: QQQ Daily Invesco QQQ Trust (QQQ) Price (Top),12-26-9 MACD (Middle), and Money Flow (Bottom)
021326 QQQ Daily
Source: Stockcharts.com
The Daily chart shows the Invesco (QQQ), an exchange-traded fund based on the Nasdaq 100 Index. QQQ fell only -1.27% last week despite high volatility and selling pressure in Apple (AAPL), -7.95%; Amazon (AMZN), -6.48%; Meta Platforms (META), -3.28%, and Alphabet (GOOGL). Microsoft (MSFT) selling pressure subsided, only down (-.04%).
QQQ broke the November uptrend (pink line), while the cycle was bottoming (see 1/30/26 Bonnie’s market update), then briefly rallied, stalling at the 50-day MA and where QQQ broke down (pink circle).
Daily Momentum (MACD) and Money Flow (MFI) are both falling, making lower lows, not an encouraging pattern.
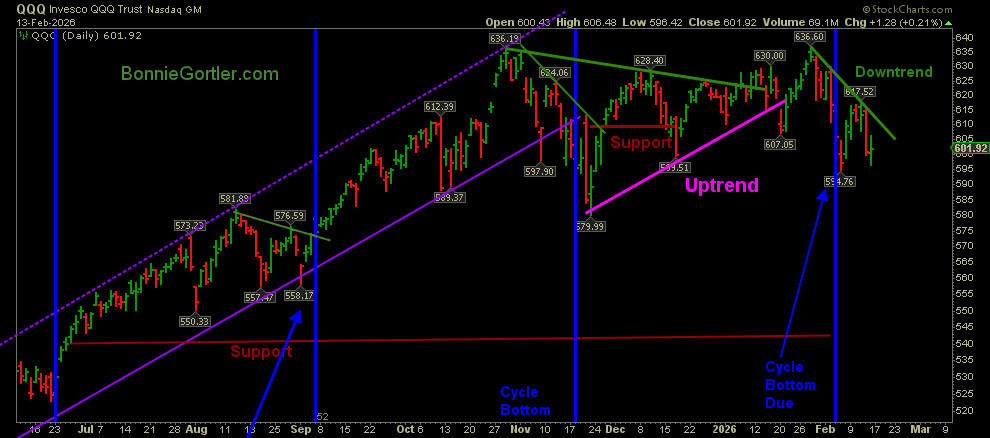
Figure 10: QQQ Daily Invesco QQQ Trust (QQQ) Price
021326 QQQ Daily with cycle bottom
Source: Stockcharts.com
The QQQ cycle bottom (blue line on the right) remains intact, but QQQ is in a downtrend. First support is 594.75, followed by 580.00 (the lower channel), which would break the QQQ September trading range.
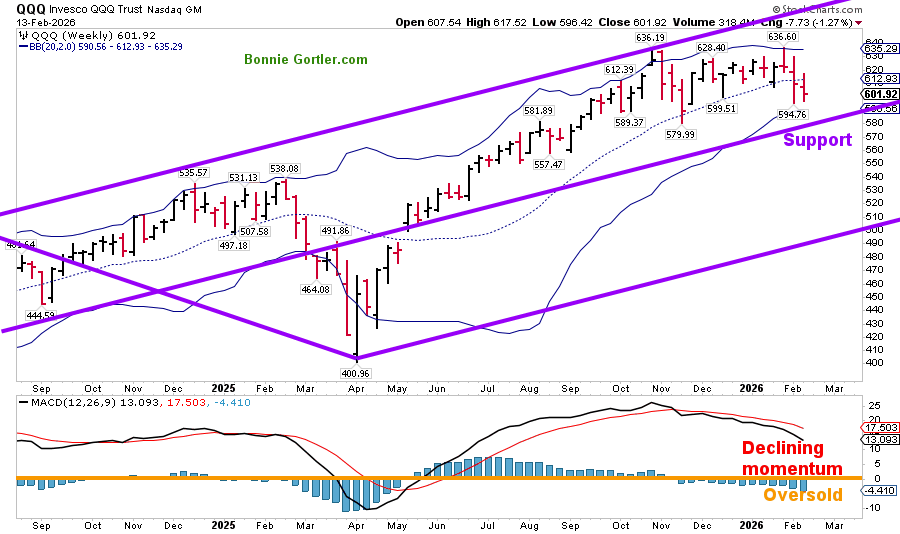
Figure 11: QQQ Weekly Invesco QQQ Trust (QQQ) Price (top) and 12-26-9 MACD Bottom)
021326 QQQ Weekly Andrews Pitchfork
Source: Stockcharts.com
QQQ Intermediate Trend is holding price support at the middle channel, but momentum is still declining, working off its overbought condition, not yet oversold, with a favorable pattern. More time is necessary for an intermediate buy signal to develop.
In sum:
Technology stocks, software, and large-cap tech have been out of favor. Two closes below 580.00.00 would be short-term negative, triggering stops, and imply a more serious decline. On the other hand, two closes above 627.00 would be a short-term positive and signal a resumption of the rally.
Discover how to cultivate a powerful wealth-building mindset and effective charting strategies to grow your wealth from the comfort of your own home in my eCourse, “Wealth Through Investing Made Simple,” including the New Module 7: Trading Alerts That Build Confidence and Reduce Risk. Learn more here.
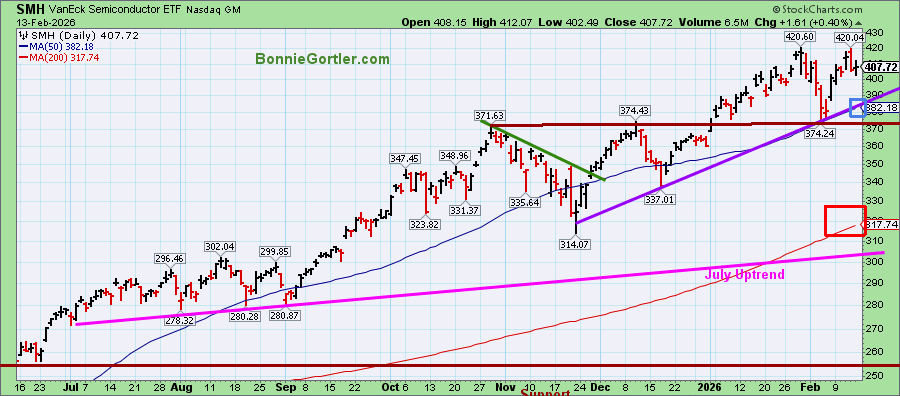
Figure 12: Daily Semiconductors (SMH)
021326 SMH Daily
Source: Stockcharts.com
The top chart shows the Daily Semiconductor (SMH) ETF, which is concentrated mainly in US-based Mega-Cap Semiconductor companies. SMH can be highly volatile. SMH tends to be a leading indicator of the market when investors are willing to take on greater risk, and the opposite is true when the market is falling.
The November 2025 uptrend (purple line) remains a continuing favorable pattern of higher highs and higher lows. SMH remains above both the 50-day MA (blue rectangle) and the 200-day MA (red rectangle), indicating underlying strength.
Support is at 402.00, 389.00, followed by 375.00. Resistance is at 412.00, 416.00, followed by 421.00
If Semiconductors (SMH) were to weaken, closing two days below 375.00, it would be short-term negative and likely lead the broad market lower. For now, the bulls get the benefit of the doubt as the SMH trend is up.
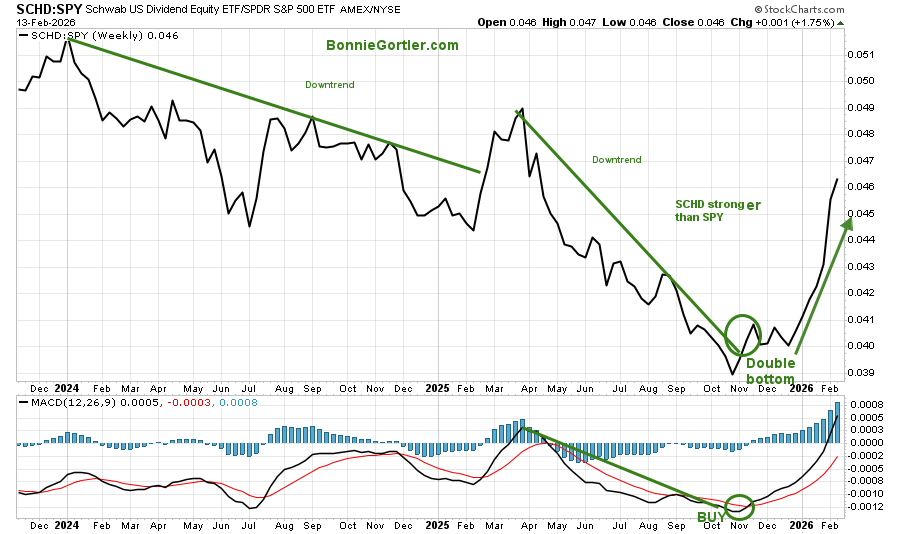
Figure 13: Schwab US Dividend Equity ETF (SCHD) /S&P 500 (SPY) Relative Strength Ratio
021326 SCHD SPY Ratio Weekly
Source: Stockcharts.com
Defensive sectors continue to lead as investors have rotated out of technology and into other areas of the market.
The Dividend Equity ETF’s relative strength ratio, SCHD/SPY, continues to rise (top chart). After breaking the March downtrend relative ratio and forming a double bottom (top chart), the MACD Buy (middle chart) and SCHD show substantial gains.
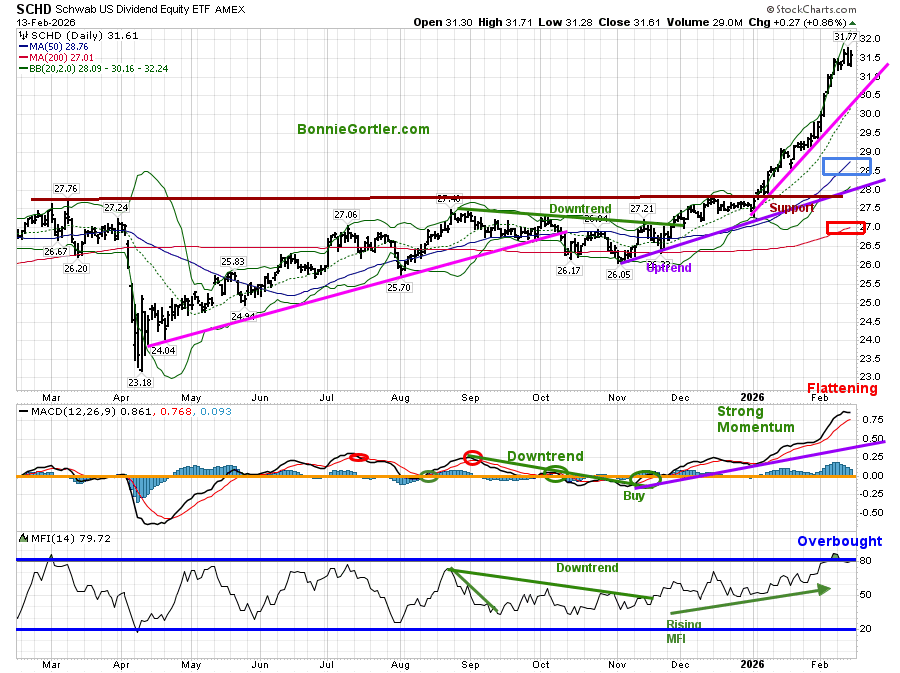
Figure 14: Schwab US Dividend Equity ETF
021326 Daily SCHD
Source: Stockcharts.com
Schwab US Dividend Equity ETF (SCHD) gives exposure to dividend-paying U.S. equities. SCHD broke its September downtrend (green line) and attracted buyers. MACD (middle chart) remains on its November buy signal, rising above 0, but has now flattened after strong momentum. Money Flow has remained in an upward trend since November, hit 80 (overbought), and turned down.
SCHD met its 29.50 objective, as mentioned in the 12/12/25 Market Update. For those of you who purchased SCHD, you reduced your position by 1/3 between 29.56 and 30.08 on 2/2/26. Raise your stop on the balance from 27.50. to 30.50, locking in the profits. Support is 30.50, followed by 28.76. It’s been a good run, and I would not be surprised if a short-term pullback starts sooner rather than later.
Summing Up:
The Dow, S&P 500, and Nasdaq were all lower last week. Intraday volatility has increased. A split market, with selling pressure in Financials and Large Cap technology and software stocks, persists as the rotation continues. Money shifted into Utilities, Consumer Staples, Real Estate, and Energy, which moved higher. It’s positive that weekly market breadth showed more stocks advancing than declining and more new highs than new lows, despite the decline in the major averages. Pay closer attention to the daily movement and what sectors are performing than you normally do. Support levels need to hold now. Technology could spark a rally in the S&P 500 index and Nasdaq 100. Review your portfolio now so you are prepared for any unexpected developments and positioned to capitalize on opportunities as they arise. Manage your risk, and your wealth will grow.
If you would like to talk about charts and get to know each other better, schedule your Free 30-minute Wealth Building Strategy Session today. Register Here.


Create more wealth in your life
with these simple strategies.
As an added bonus you will also
receive BG’s Updates and Ezine

Discover how to quickly create more well-being in your life with these simple strategies.
As an added bonus you will also
receive BG’s Updates and Ezine

As an added bonus you will receive BG’s Updates and Ezine

All work listed on BonnieGortler.com is licensed under a Creative Commons Attribution - Noncommercial - No Derivative Works 3.0 Unported License.


Free Report:
Grow and Sustain Your Wealth
Discover how to grow your money with these easy, simple steps.

