

10 Simple Tips for Financial Well-Being
07/01/2026
After recent significant gains by lagging sectors gave the impression that a potential upside breakout could occur, the Dow, S&P 500, and Nasdaq all finished lower the last week of September, ending the third quarter. The improved character of the market that I had thought occurred quickly changed. Uncertainty about interest rates, questions of an impeachment investigation, recession concerns and trade war worries were too much for the market to digest and sustain further gains. Market breadth stopped improving small and mid-cap stocks weakened, technology stocks stalled and turned down. The major averages fell below their trading ranges established from early September and are now in a short-term downtrend. However, the technical indicators are oversold in the short term. Although October is historically a volatile month for stocks if the major averages begin to stabilize a tradeable rally is possible. The fourth quarter is typically the best of the year. Favorable seasonality begins at the end of the month. If there is further easing by the Federal Reserve and other central banks, better than expected earnings, and good news between China and the United States, the market could surprise to the upside with a strong fourth quarter.
Where do we go from here?
Figure: Invesco Nasdaq 100 Daily (QQQ) Price (Top) and 12-26-9 MACD (Bottom)
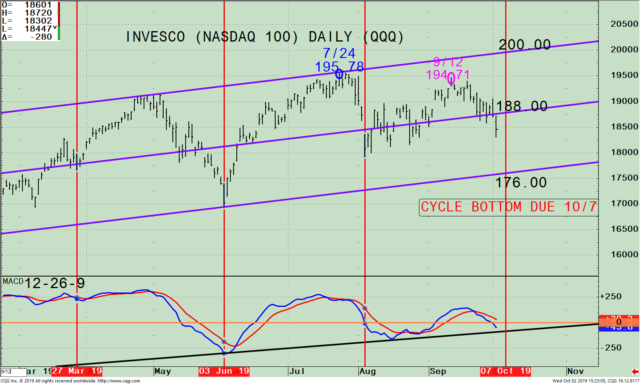
The top part chart shows the daily Invesco (QQQ) an exchange-traded fund based on the Nasdaq 100 Index, and its active trend channel (purple line). QQQ stalled at resistance peaking on 9/12 only a few percent under their all-time high. As the market was falling sharply today, I wanted to see if there was a potential cyclical low due, since I do find market cycles to be helpful. Even though cycles are not perfect, they can help in anticipating potential turning points and can be a powerful tool used with support or resistance lines.
Notice on the chart there are three lows that appear to have the same cycle length approximately 45 days (red vertical lines). I extended the fourth line into the future. This time frame coincides with a key support area just below the one that remains intact. Although QQQ has been volatile the last few months, the 8/15 low of 181.16, the 8/23 low of 181.56 all held on each decline the 8/5 low at 179.20. Notice the cycle is ending and is due to bottom in approximately three trading sessions on 10/7 (the red vertical line on the right). Sometimes cycles can be early, However, the August lows are intact. A close below the August low would imply a possible test of the lower channel at 176.00.
The bottom half of the chart is daily MACD (12, 26, 9), a measure of momentum. MACD is on a sell, oversold, and below 0. The uptrend from June remains intact (black line). A turn up now would form a favorable triple bottom formation supporting the potential for a possible bottom and another chance at making a new all-time high.
Summing Up:
The QQQ has been volatile in the last few months. October historically tends to be a volatile month which is exactly how this month has begun. QQQ for the short term is oversold with support levels intact and above the August low of 179.20. Presently the averages are near their low end of the range where they have been trading the past few months. A cyclical bottom in the Nasdaq 100 (QQQ) may be only a few days away. Technology leadership has fueled the rally in 2019 and it’s too early to say this trend is over.
I would love to hear from you. Please call me at 516-829-6444 or email at bgortler@signalert.com to share your thoughts or ask me any questions you might have.
Sign up for a FREE 3 issue trial of
SYSTEMS AND FORECASTS Click here

If you like this article you will love my Free EBook Grow Your Wealth and Well-Being Ebook
******Article first published in Systems and Forecasts on October 2, 2019
Disclaimer: Although the information is made with a sincere effort for accuracy, it is not guaranteed that the information provided is a statement of fact. Nor can we guarantee the results of following any of the recommendations made herein. Readers are encouraged to meet with their own advisors to consider the suitability of investments for their own particular situations and for determination of their own risk levels. Past performance does not guarantee any future results.


Create more wealth in your life
with these simple strategies.
As an added bonus you will also
receive BG’s Updates and Ezine

Discover how to quickly create more well-being in your life with these simple strategies.
As an added bonus you will also
receive BG’s Updates and Ezine

As an added bonus you will receive BG’s Updates and Ezine

All work listed on BonnieGortler.com is licensed under a Creative Commons Attribution - Noncommercial - No Derivative Works 3.0 Unported License.


Free Report:
Grow and Sustain Your Wealth
Discover how to grow your money with these easy, simple steps.

