

Bonnie’s Market Update 4/19/24
04/21/2024
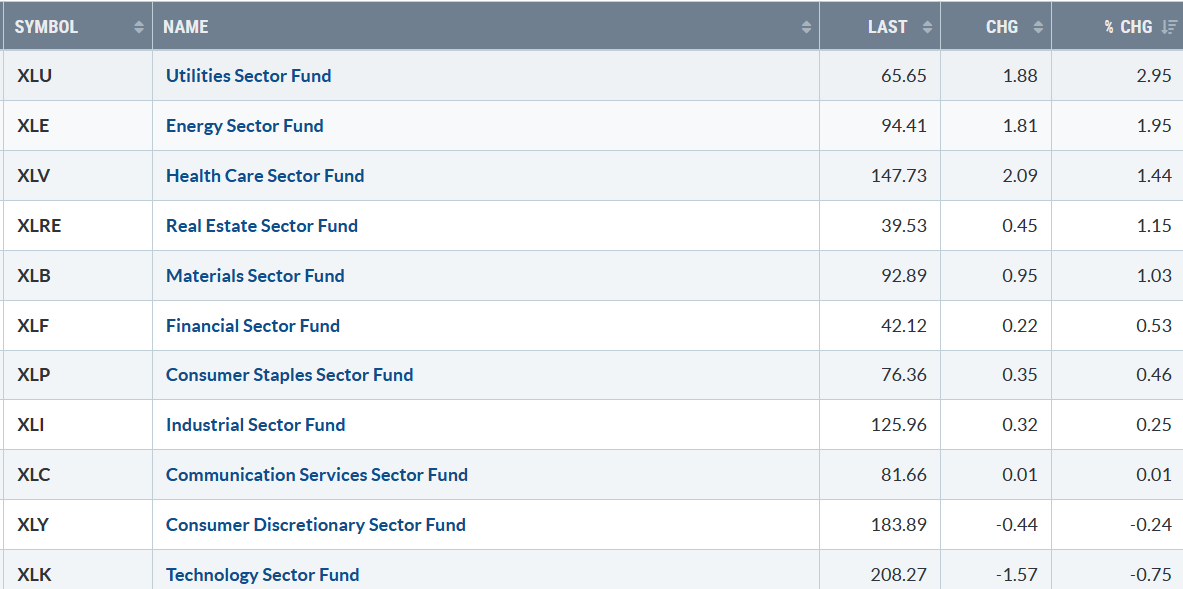
It was a quiet end to the best quarterly performance since 2019. Nine of the eleven S&P SPDR sectors finished higher. Utilities (XLU) and Energy (XLE) were the best sectors, while Consumer Discretionary (XLY) and Technology (XLK) were the weakest. The SPDR S&P 500 ETF Trust (SPY) was up +0.17%.
S&P SPDR Sector ETFs Performance Summary 3/22/24-3/28/24
032824 SPDR Sectors
Source: Stockcharts.com
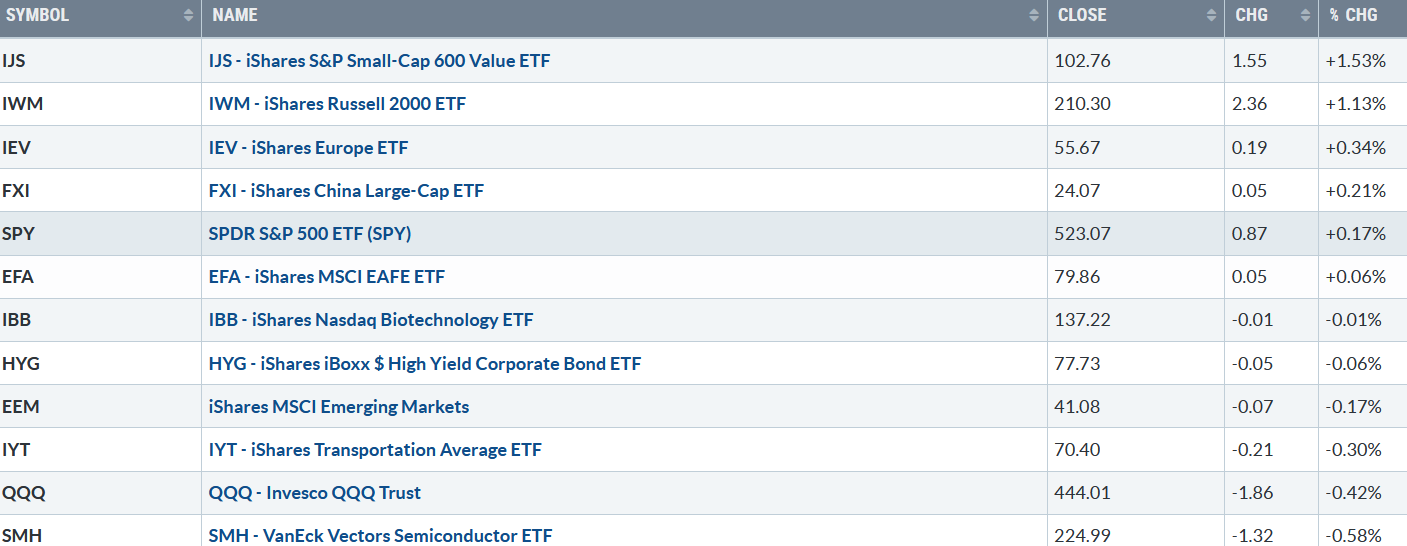
Figure 2: Bonnie’s ETFs Watch List Performance Summary 3/22/24-3/28/24
032824 Bonnie’s ETFs
Source: Stockcharts.com
Small Caps, Value, and Growth led while Semiconductors, Technology, and Transports lagged.
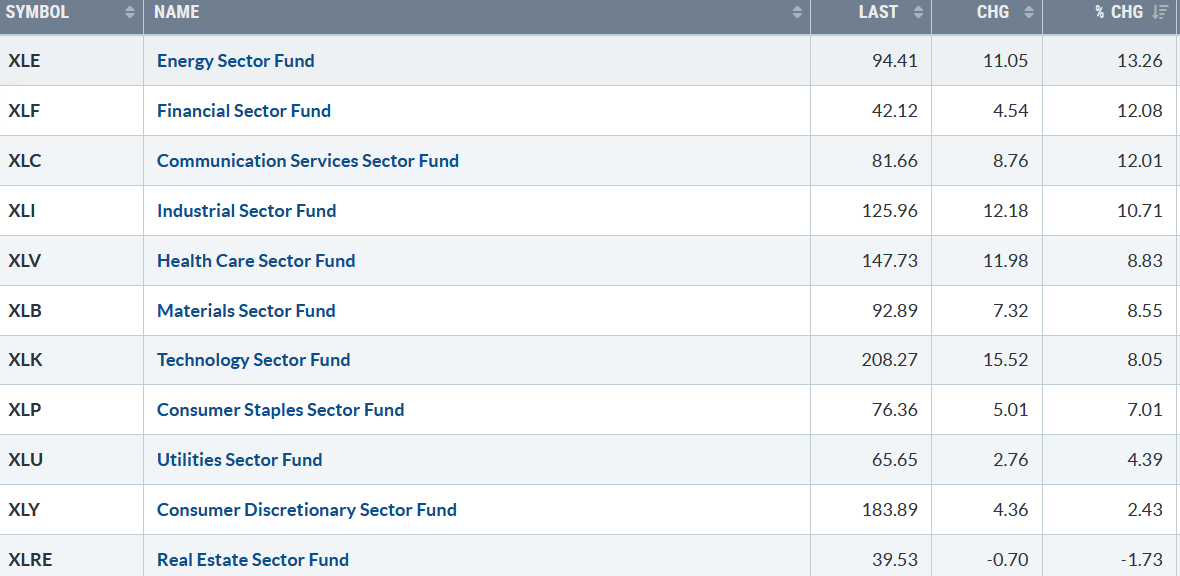
Figure 3:S&P SPDR Sector ETFs YTD Performance Summary 12/31/23-3/28/24
032824 YTD SPDR Sectors Performance
Source: Stockcharts.com
2024 is off to a strong start. Ten of eleven S&P SPDR sectors finished higher for the year, four outperforming the S&P 500. Energy (XLE) and Financials (XLC) were the best sectors, while Consumer Discretionary (XLY) and Real Estate (XLRE) lagged. The SPDR S&P 500 ETF Trust (SPY) gained +10.39%.
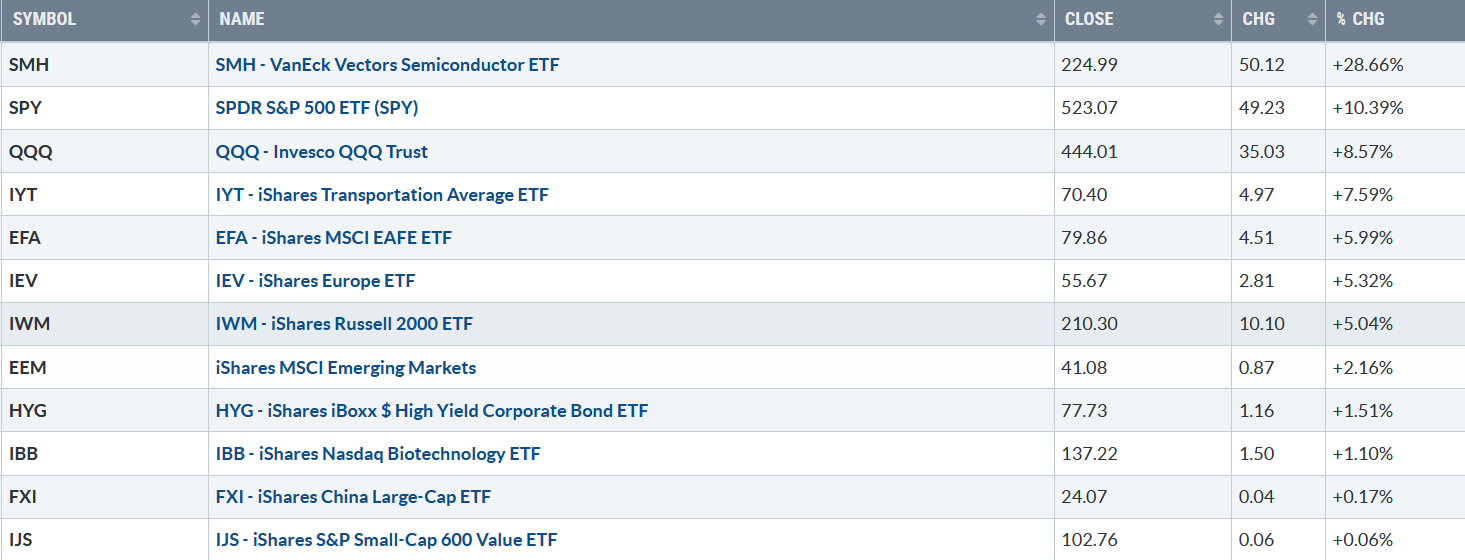
Figure 4: Bonnie’s ETFs Watch List YTD Performance Summary 12/31/23-3/28/24
032824 YTD Bonnie’s ETF Performance
Source: Stockcharts.com
Semiconductors led the way in the first quarter of 2024. As the year progressed, the rise broadened, which bodes well for 2024 if this trend continues and more stocks participate in the advance.
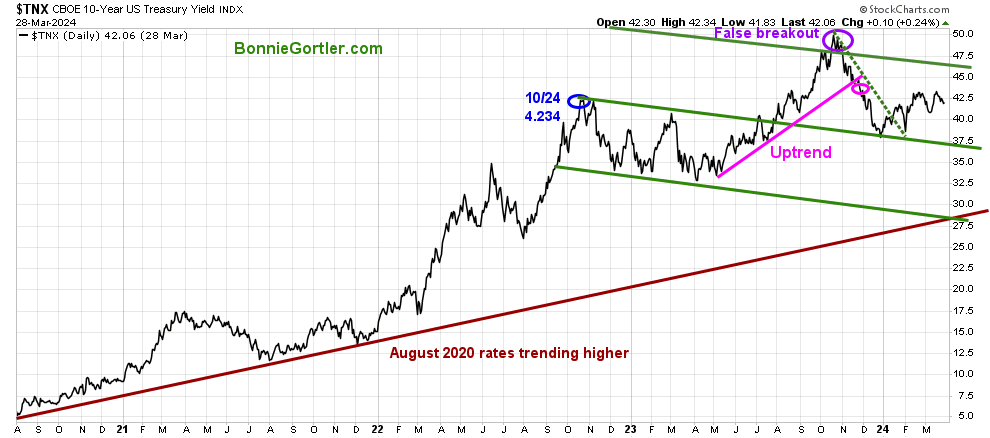
Figure 5: UST 10YR Bond Yields Daily
032824 UST 10 Yr Bond Yields Daily
Source: Stockcharts.com
The 10-year U.S. Treasury fell last week, closing at 4.206%. Falling yields will likely support further gains, yet unexpectedly sharp rising yields could cause selling pressure in U.S. Equities.
The major market averages were all mixed last week. The Dow rose 0.84%, the S&P 500 gained +0.39%, and the Nasdaq was down -0.30%. The Russell 2000 Index led the advance, gaining +2.54%, its second week of solid gains.
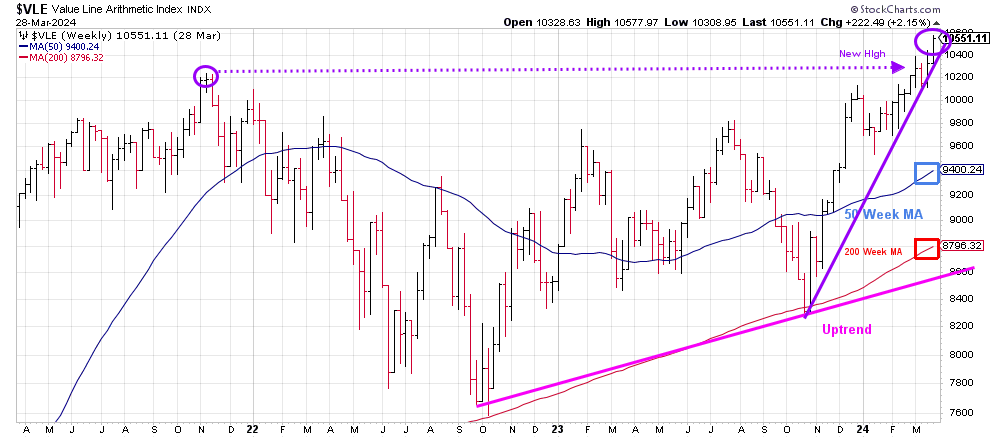
Figure 6: Weekly Value Line Arithmetic Average
032824 VLE Weekly
Source: Stockcharts.com
The top chart is the weekly Chart of the Value Line Arithmetic Index ($VLE), which includes approximately 1700 stocks.
VLE rose +2.15% for the week, reaching a new closing high of 10551.11. It has been in an uptrend (pink line) since October 2022. VLE has trended higher without much of a pullback since November 2023 (purple line).
VLE closed well above the rising 50-week MA (blue rectangle) and 200-week MA, implying underlying strength. The first support is at 10000, followed by 9700 and 9400.
If VLE holds above last week’s low of 10308.95, the short-term outlook will continue to be positive.
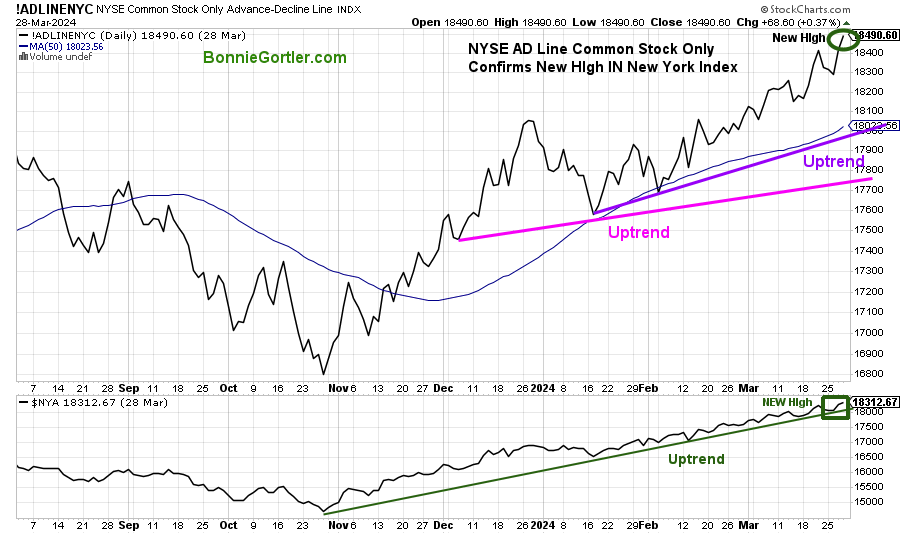
Figure 7: Daily NYSE Common Stock Only Advance-Decline Line
032824 Daily NYSE Common Stock Only Advance-Decline Line
The New York Index continues to make new highs. It is positive that the Daily NYSE AD line (top chart), which includes only common stocks, has confirmed the high in the New York Stock Exchange Index (bottom chart). The final peak has likely not occurred, with the AD line making a higher high.
Weekly market breadth was positive on the New York Stock Exchange Index (NYSE) and for the Nasdaq. The NYSE had 1963 advances and 950 declines, with 522 new highs and 49 new lows. There were 2801 advances and 1748 declines on the Nasdaq, with 452 new highs and 237 new lows.
It would be bullish if New Highs expands and New Lows contracts on the NYSE and NASDAQ.
Do you want to go deeper into charting? Learn more in the comfort of your home today with my Free 33-minute Training, Charting Strategies to Cut Risk and Trade with the Trend. Sign up here.
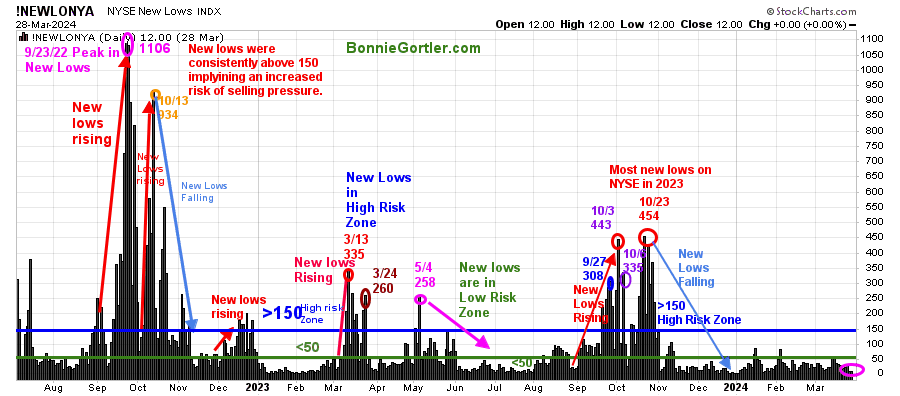
Figure 8: New York Stock Exchange (NYSE) New Lows
032824 NYSE New Lows Daily
Source: Stockcharts.com
Watching New Lows on the New York Stock Exchange is a simple technical tool that helps increase awareness of the direction of an immediate trend.
For most of 2022, new lows warned of a potential sharp pullback, high volatility, and “panic selling,” closing above 150. The peak reading of New Lows in 2022 was on 9/23 at 1106, not exceeded in 2023.
Last week, New lows on the NYSE closed at 12 (pink circle), remaining in the lowest risk zone. In 2024, New Lows stayed below 150, a sign of a healthy market. A rise above 150 would be a warning sign of a market correction.
Learn more about the significance of New Lows in my book, Journey to Wealth, published on Amazon. If you would like a preview, get a free chapter here.
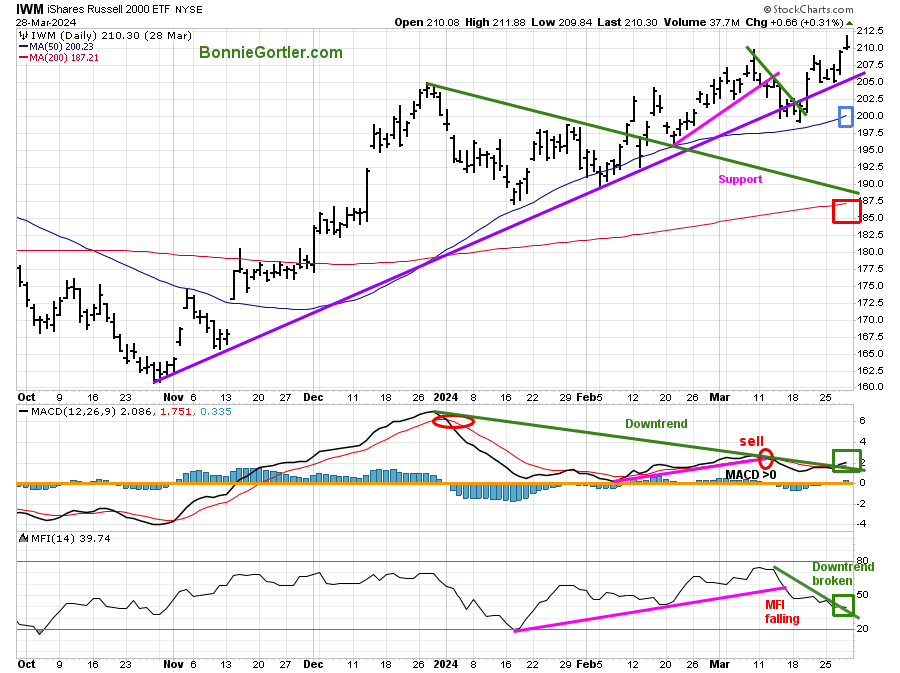
Figure 9: Daily iShares Russell 2000 (IWM) Price (Top) and 12-26-9 MACD (Middle and Money Flow (Bottom)
032824 IWM Daily
Source: Stockcharts.com
The top Chart is the daily iShares Russell 2000 Index ETF (IWM), the benchmark for small-cap stocks, with a 50-Day Moving Average (MA) (blue rectangle) and 200-Day Moving Average (MA) (red rectangle) that traders watch and use to define trends.
IWM gained strength, making a new high last week, gaining +2.55%. IWM remains above both the 50 and 200-day MA. Two closes below the 50-day MA 200.23 (as of this writing) would likely hit sell stops.
Support is at 205.00, 197.50, 190.00, and 187.50. Resistance is at 212.00 and 220.00 (monthly chart not shown).
MACD (middle chart) remains on a sell, above 0 and rising, not falling below 0 to generate a fresh entry. However, the momentum downtrend from December 2023 (green line) broke last week, which is bullish.
Money flow (lower chart) slightly broke the January uptrend (green line), a positive. If money flow continues to rise, it would be short-term bullish.
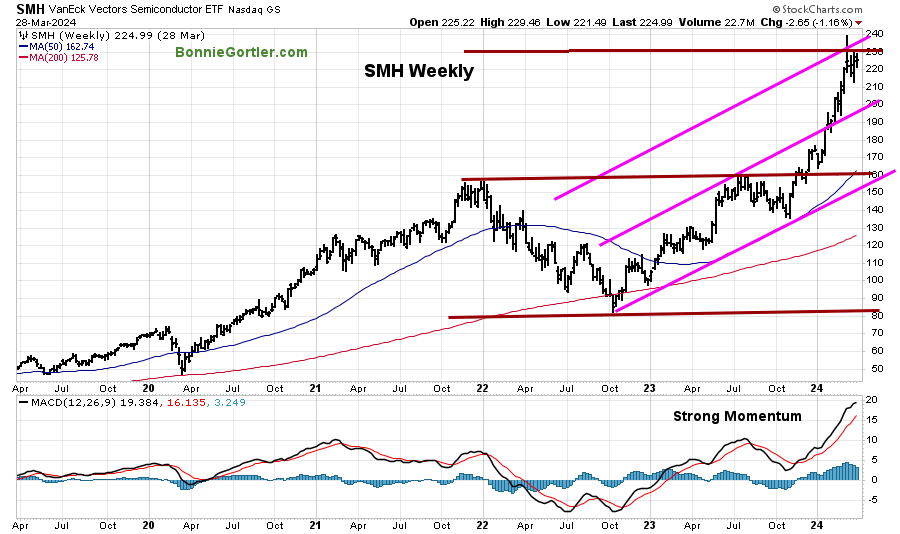
Figure 10: Weekly Semiconductors (SMH) (Top) and 12-26-9 MACD (Bottom)
032824 SMH Weekly
Source: Stockcharts.com
The top chart shows the Weekly Semiconductors (SMH) ETF, concentrated mainly in US-based Mega-Cap Semiconductor companies. SMH tends to be a leading indicator for the market when investors are willing to take on increased risk, and the opposite is true when the market is falling.
The Semiconductor ETF (SMH) pulled back last week but held above 220 support. SMH was down -1.16%, closing at 224.99, remaining slightly below the top of the weekly channel (top brown line) after peaking in on 3/8 at 239.14.
Support is at 220.00, 210.00, 195.00 and 160.00. Resistance is at 230.00.
MACD (bottom chart) shows strong momentum, a higher high implying, likely, the final top has not been made.
If SMH closes above 230.00 for two days, SMH will give new upside objectives towards 255.00 and 290.00. A weekly close below 195.00 would negate the upside objective.
Do you want more knowledge about the stock market? Learn how to implement a powerful wealth-building mindset and simple, reliable strategies to help you grow your wealth. Check out my eCourse Wealth Through Investing Made Simple Here.
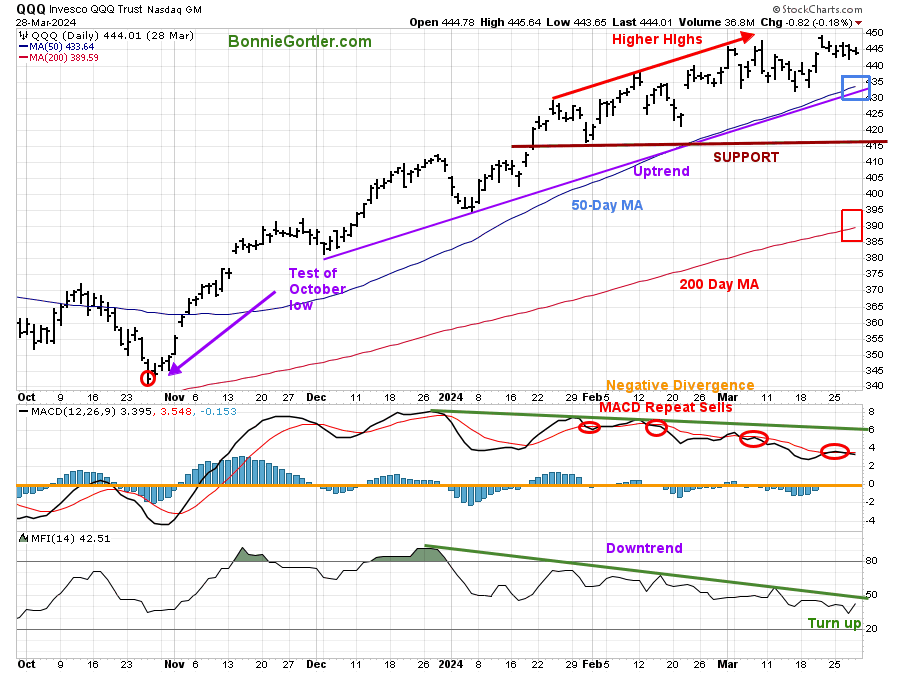
Figure 11: Daily Invesco QQQ Trust (QQQ) Price (Top) and 12-26-9 MACD (Bottom)
032824 QQQ Daily
Source: Stockcharts.com
The Chart shows the daily Invesco QQQ, an exchange-traded fund based on the Nasdaq 100 Index. QQQ made a low in October 2023 (red circle), followed by a successful retest of the low in early January 2024 and the start of an uptrend.
Last week, Nasdaq 100 (QQQ) traded within a tight range in a shortened week, with a high of 447.23 and a low of 441.93, closing at 444.01, down -0.53%. QQQ remains above the rising 50-day Moving Average (blue rectangle) and the 200-day Moving Average (red rectangle), a sign of underlying strength.
Support is at 440.00, 430.00, 416.00, 385.00. Two closes below 440.00 will likely increase selling pressure toward 430.00. Two closes above 448.00 will likely hit buy stops and ignite QQQ to move higher toward 465.00.
The bottom chart, MACD (12, 26, 9), remains on a sell, above 0, rising after giving repeat sell signals and no fresh buy possible with MACD overbought.
Money flow (lower Chart) remains in a downtrend but did turn up last week. A break of the MFI downtrend would be bullish, implying investors’ increased interest in Technology stocks and a potential breakout of the recent consolidation and trading range.
QQQ continues to trend higher as support levels remain intact despite QQQ showing signs of weakening momentum.
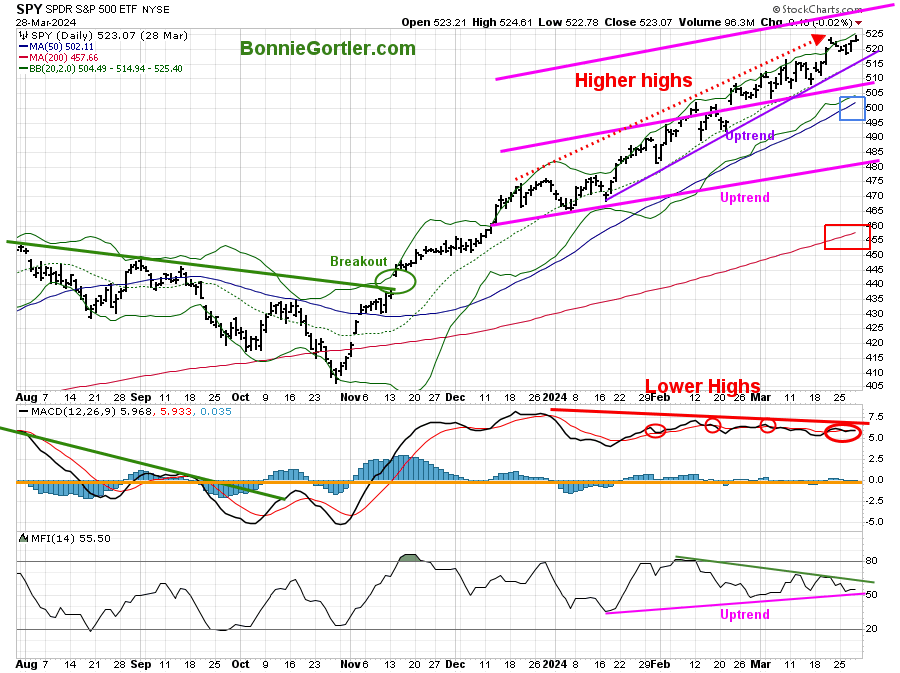
Figure 12: The S&P 500 Index (SPY) Daily (Top) and 12-26-9 MACD (Bottom)
032824 SPY Daily
Source: Stockcharts.com
The S&P 500 (SPY) broke the downtrend in November 2023 (green solid line) and has been in a steady uptrend. The SPY accomplished its upside objective of 510.00 and continues to rise.
The 2024 daily trend for the SPY remains up (purple line). The SPY closed at 523.07, up +0.36 for the week, remaining above the rising 50-day Moving Average (blue rectangle) and the 200-day Moving Average (red rectangle), a sign of strength.
Support is at 515.00, 505.00, 480.00, and 465.00.
MACD (bottom chart) remains on a sell above 0, rising and moving sideways with lower highs. A negative divergence remains. Despite SPY showing signs of weakening momentum, SPY continues in an uptrend with support levels remaining intact. No fresh buy is possible with MACD>0.
It is positive that the S&P 500 Index % of stocks above their 20 and 50-day Moving Average are rising, 83.60% and 85.20%, respectively (chart not shown). If you want a copy of this chart, email me at Bonnie@BonnieGortler.com
It will be a positive in the short term if support at 515.00 holds and SPY closes above last week’s high of 524.61. On the other hand, a close below 515.00 could lead to some short-term selling pressure.
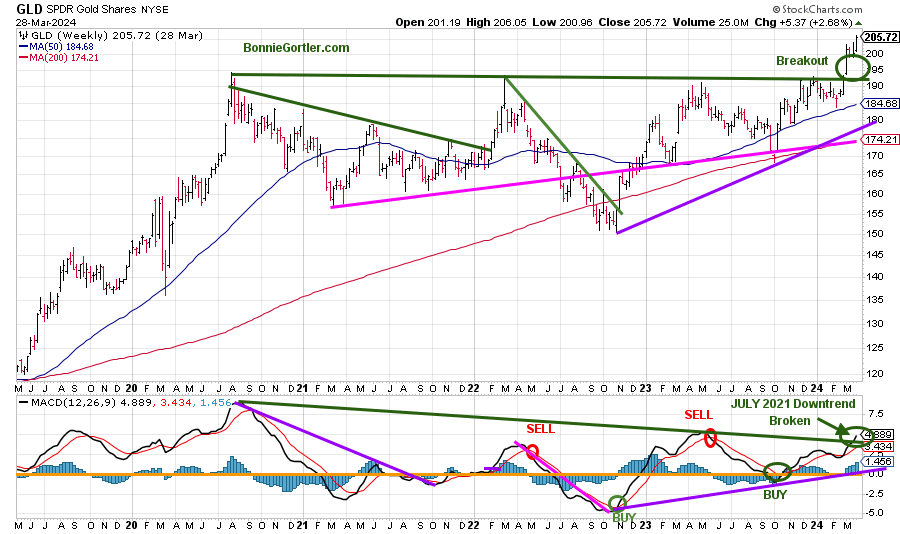
Figure 13: GLD Weekly and 12-26-9 MACD (Bottom)
032824 GLD Weekly
Source: Stockcharts.com
The chart shows the weekly Gold (GLD) ETF. The rally in GLD continued after the breakout (green circle), at its highest level since 2020 (green circle).
MACD (lower chart). Its bullish MACD broke the July 2021 downtrend last week, confirming the price breakout mentioned in Bonnie’s Market Update 3/8/24 review HERE:
The Dow and S&P 500 closed at record highs to end the first quarter. April is historically a positive month for the S&P 500. Support levels remain intact as the major averages traded in a tight range, consolidating the recent gains. The tape action remains positive. If Semiconductor and Small-Cap stocks heat up and support levels hold, higher prices in the major averages will follow without a pullback.
Remember to manage your risk, and your wealth will grow.
Let’s talk about investing one on one. You are invited to schedule your Free 30-minute Wealth and Well-Being Strategy session here or by emailing me at Bonnie@BonnieGortler.com. I would love to schedule a call and connect with you.
Disclaimer: Although the information is made with a sincere effort for accuracy, it is not guaranteed that the information provided is a statement of fact. Nor can we guarantee the results of following any of the recommendations made herein. Readers are encouraged to meet with their own advisors to consider the suitability of investments for their own particular situations and for determination of their own risk levels. Past performance does not guarantee any future results.


Create more wealth in your life
with these simple strategies.
As an added bonus you will also
receive BG’s Updates and Ezine

Discover how to quickly create more well-being in your life with these simple strategies.
As an added bonus you will also
receive BG’s Updates and Ezine

As an added bonus you will receive BG’s Updates and Ezine

All work listed on BonnieGortler.com is licensed under a Creative Commons Attribution - Noncommercial - No Derivative Works 3.0 Unported License.
