

Bonnie’s Market Update 4/12/24
04/14/2024
The rally stalled Friday, but nine of the eleven S&P SPDR sectors finished higher for the week. Utilities (XLU) and Real Estate (XLRE) were the best sectors, while Technology (XLK) and Communication Discretionary (XLY) were the weakest. The SPDR S&P 500 ETF Trust (SPY) was down -0.22%.
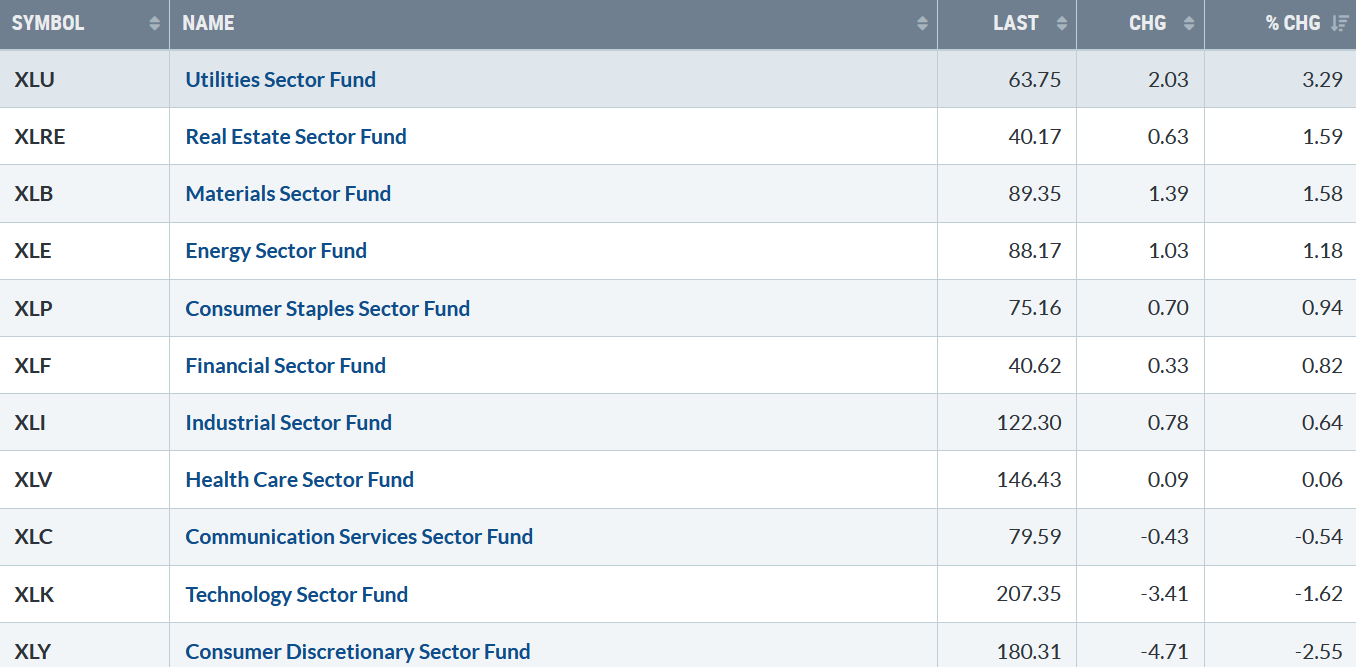
030824 SPDR Sectors
Source: Stockcharts.com
Figure 2: Bonnie’s ETFs Watch List Performance Summary 3/1/24-3/8/24
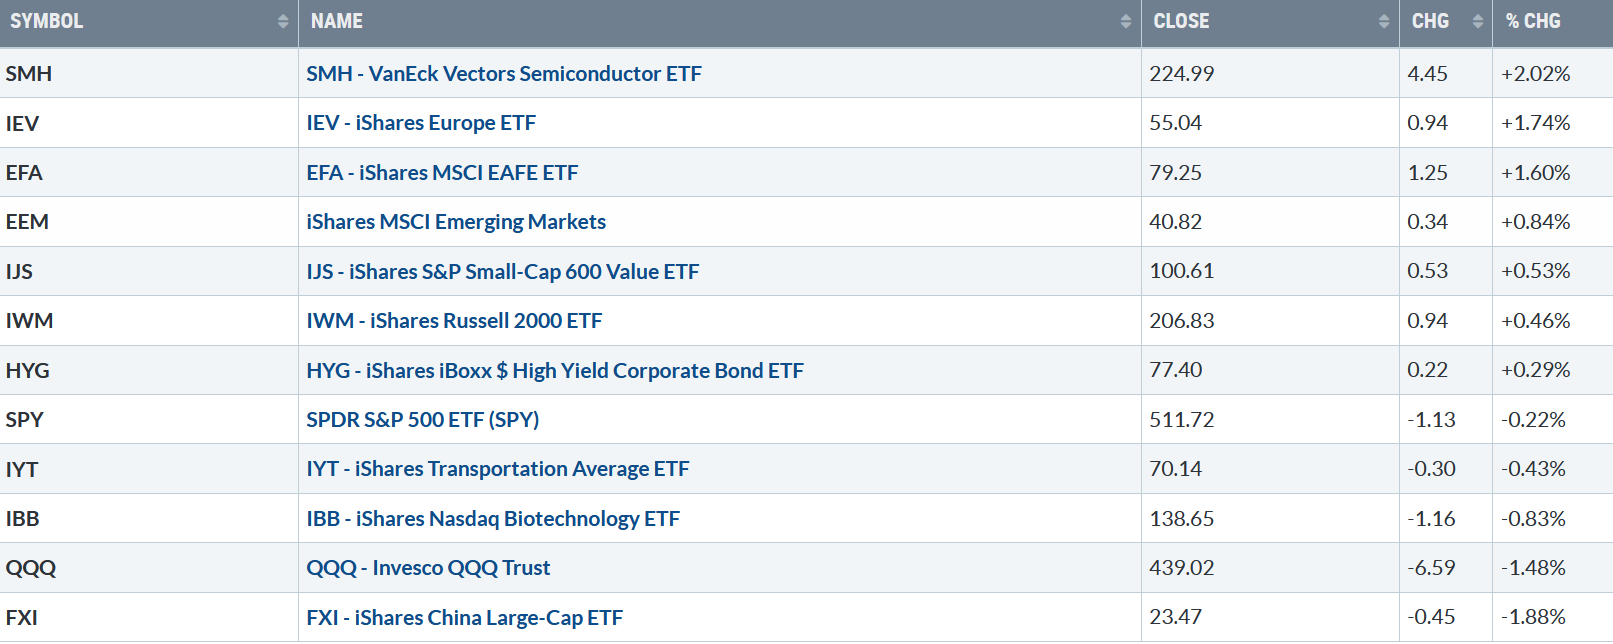
030824 Bonnie’s ETFs
Source: Stockcharts.com
Semiconductors showed gains for the week and are up +28.66% for the year despite reversing lower Friday. Technology and China lagged, but other Europe and Emerging Markets outperformed the U.S.
Do you want more knowledge about the stock market? Learn how to implement a powerful wealth-building mindset and simple, reliable strategies to help you grow your wealth. Check out my eCourse Wealth Through Investing Made Simple Here.
Figure 3: UST 10YR Bond Yields Daily
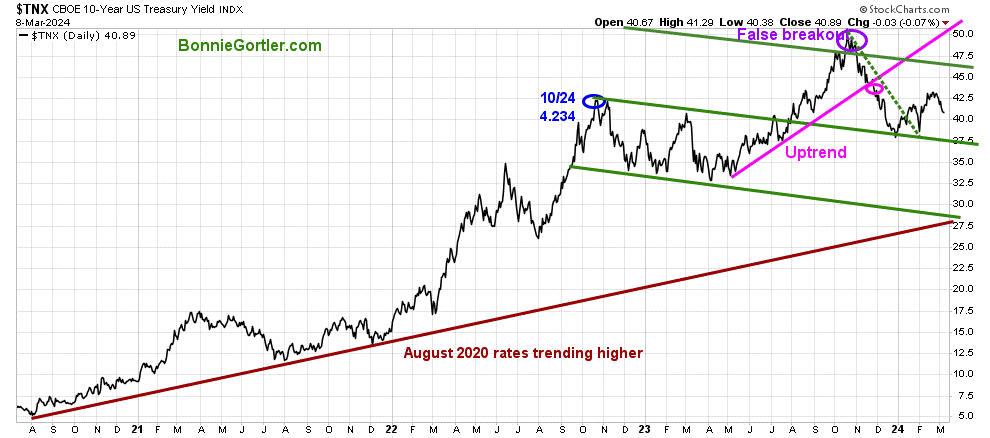
030824 UST 10 Yr Bond Yield
Source: Stockcharts.com
The 10-year U.S. Treasury fell last week, closing at 4.089%. Falling yields are likely to support U.S. Equities, while rising yields could cause selling pressure.
The major market averages retreated last week. The Dow fell -0.93%, the S&P 500 fell -0.26%, while the Nasdaq dropped 1.17%. The Russell 2000 Index bucked the trend up +0.30%.
Figure 4: Fear & Greed Index
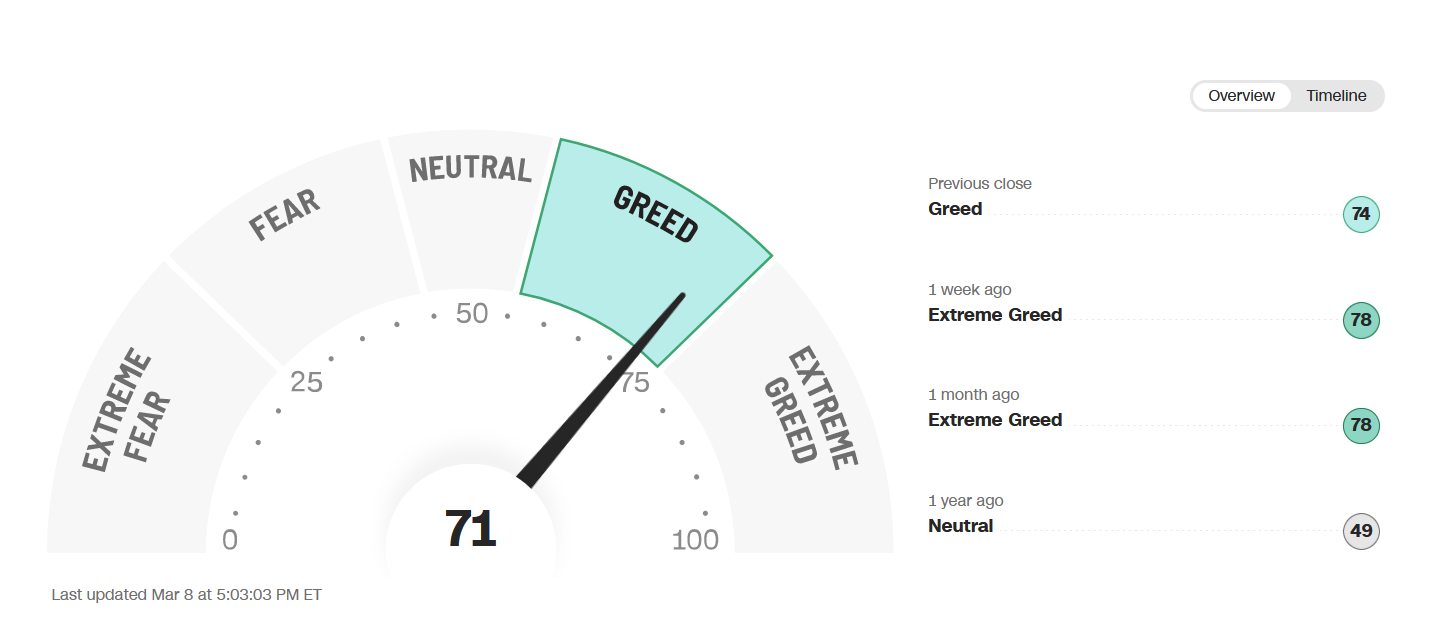
030824 Fear and Greed
Source. CNN.com
Investor sentiment based on the Fear and Greed Index (a contrarian index) measures the market’s mood. The Fear and Greed Index no longer shows extreme greed, closing at 71, but not yet in a low-risk buy area.
Are you interested in learning more about the stock market? Learn how to implement a powerful wealth-building mindset and simple, reliable strategies to help you grow your wealth. Check out my eCourse Wealth Through Investing Made Simple. Get information here.
Figure 5: Weekly Value Line Arithmetic Average
030824 VLE Weekly
Source: Stockcharts.com
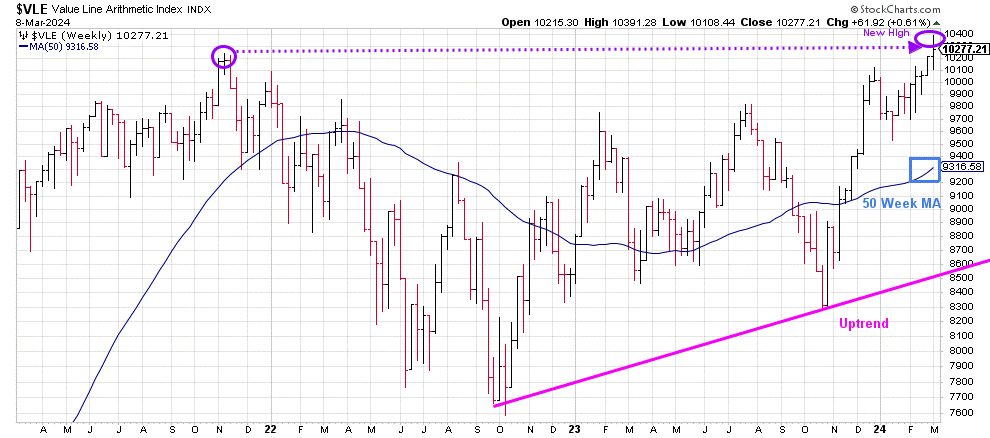
The top chart is the weekly chart of the Value Line Arithmetic Index ($VLE), which includes approximately 1700 stocks.
VLE intermediate trend remains uptrend (pink line) from October 2022.
Its positive VLE rose +0.61% for the week, closing at 10277.21, making a new all-time high. It also closed significantly above the rising 50-week MA (blue rectangle), a sign of underlying strength.
Support is at 10000, 9700, and 9300.
It will be short-term positive if VLE holds above last week’s low of 10108.44. However, selling pressure will likely increase if VLE closes below.
Do you want to go deeper into charting? Learn more in the comfort of your home today with my Free 33-minute Training, Charting Strategies to Cut Risk and Trade with the Trend. Sign up here.
Market Breadth Confirms High made on the New York Index.
Weekly market breadth was positive on the New York Stock Exchange Index (NYSE) but slightly negative for the Nasdaq. The NYSE had 2279 advances and 2369 declines, with 590 new highs and 78 new lows. There were 2667 advances and 1959 declines on the Nasdaq, with 663 new highs and 288 new lows.
Figure 6: Daily NYSE Common Stock Only Advance-Decline Line
030824 Daily NYSE Common
Source: Stockcharts.com
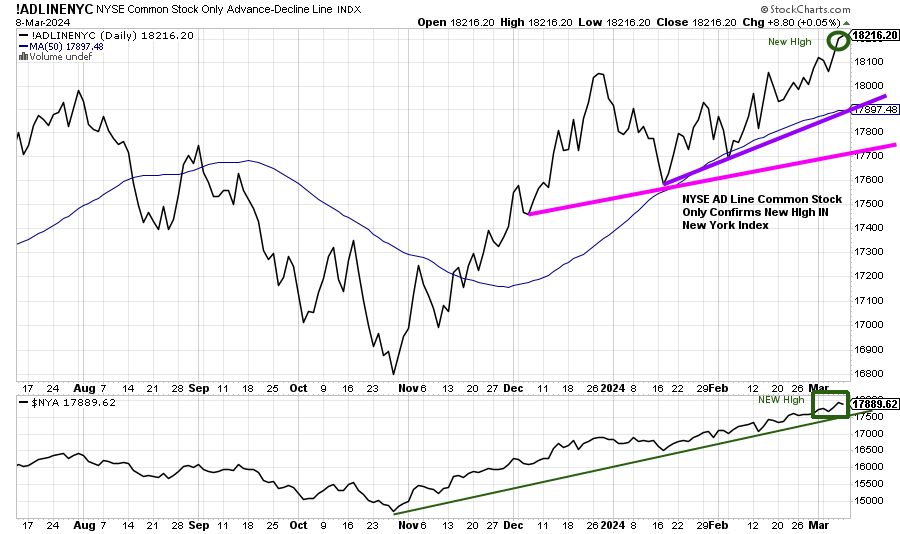
It is positive that the Daily NYSE AD line (top chart), which includes only common stocks, has confirmed the recent high in the New York Stock Exchange Index (bottom chart). The final peak has likely not occurred, with the AD line making a higher high.
Figure 7: Nasdaq Advance Decline Line Daily (Top) and Nasdaq (Bottom)
30824 Daily Nasdaq Cumulative Advance-Decline Line
Source: Stockcharts.com
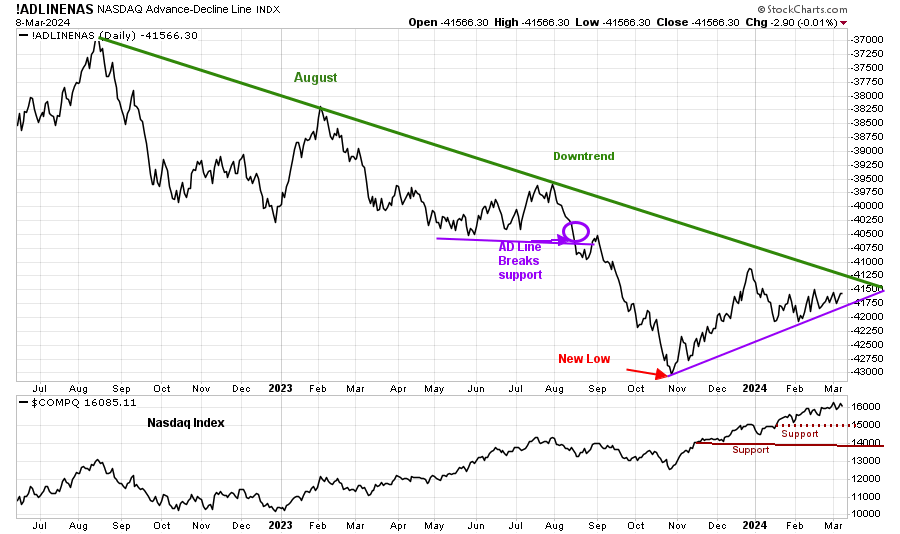
The top chart is the Nasdaq Daily Advance-Decline Line, a technical indicator that plots the difference between the number of advancing and declining stocks.
The uptrend from October remains in effect (purple line).
If the downtrend from August 2022 (solid green line) is penetrated, it would be bullish for the longer term, implying a broadening of the Nasdaq rally. On the other hand, if the Nasdaq breaks the downtrend from the October low first, it will be harder to make money in the short term.
Figure 8: Daily New York Stock Exchange (NYSE) New Lows
030824 NYSE New Lows
Source: Stockcharts.com
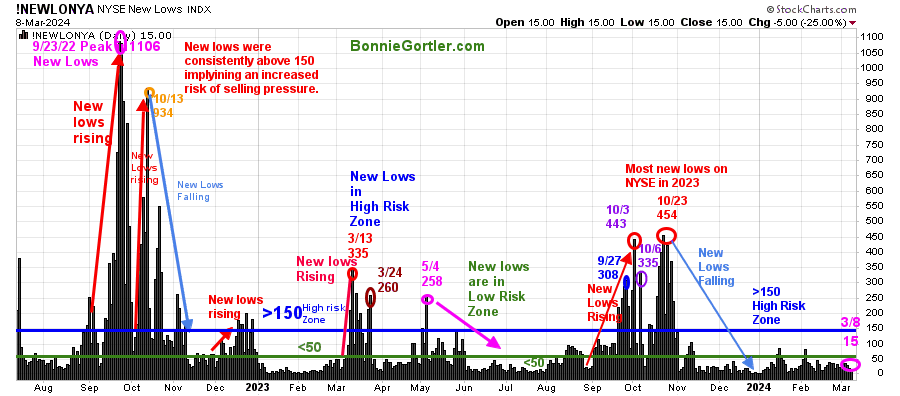
Watching New Lows on the New York Stock Exchange is a simple technical tool that helps increase awareness of the direction of an immediate trend.
For most of 2022, new lows warned of a potential sharp pullback, high volatility, and “panic selling,” closing above 150. The peak reading of New Lows in 2022 was on 9/23 at 1106, not exceeded in 2023.
Last week, New lows on the NYSE closed at 15 (pink circle), in the lowest-risk zone. It would remain positive and imply low risk if New Lows remain less than 50. On the other hand, an increase above 150 would be a warning sign of a market correction.
Learn more about the significance of New Lows in my book, Journey to Wealth, published on Amazon. If you would like a preview, get a free chapter here.
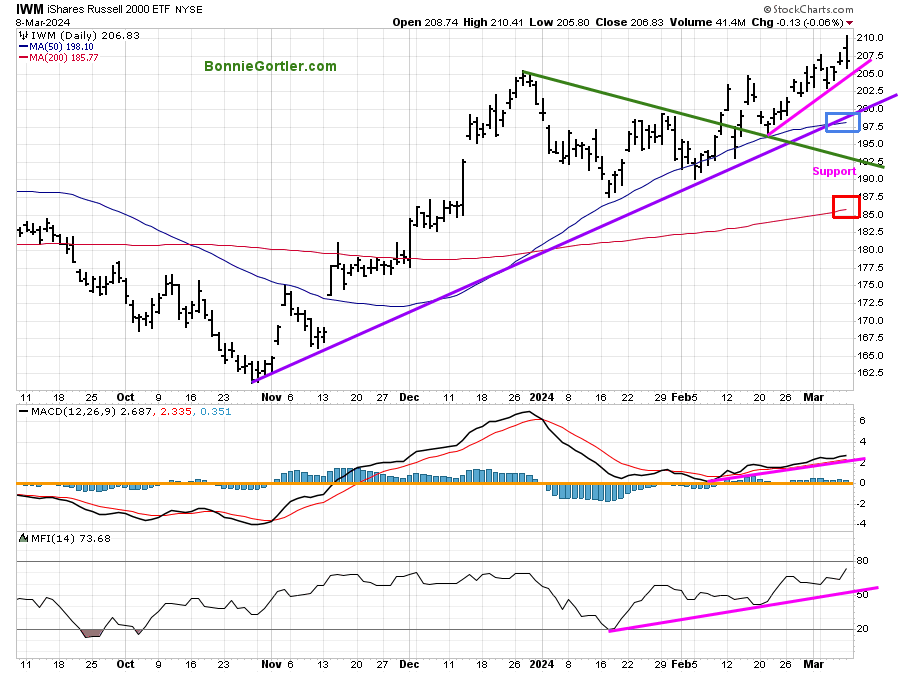
Figure 9: Daily iShares Russell 2000 (IWM) Price (Top) and 12-26-9 MACD (Middle and Money Flow (Bottom)
030824 IWM Daily
Source: Stockcharts.com
The top chart is the daily iShares Russell 2000 Index ETF (IWM), the benchmark for small-cap stocks. It has a 50-day Moving Average (MA) (blue rectangle) and a 200-Day Moving Average (MA) (red rectangle) that traders watch and use to define trends.
The short-term trend remains up. IWM closed above both the 50 and 200-day MA. A close below both moving averages would likely hit stops.
IWM was stronger than the major averages, up +0.41%, closing at 206.83 last week.
Support is at 205.00, 202.50, 197.50, and 185.00. Resistance is at 210.00, followed by 220.00.
MACD (middle chart) remains on a buy, above 0, and rising in an uptrend.
Money flow (lower chart) continues to rise, hitting its highest level in 2024, which is short-term bullish.
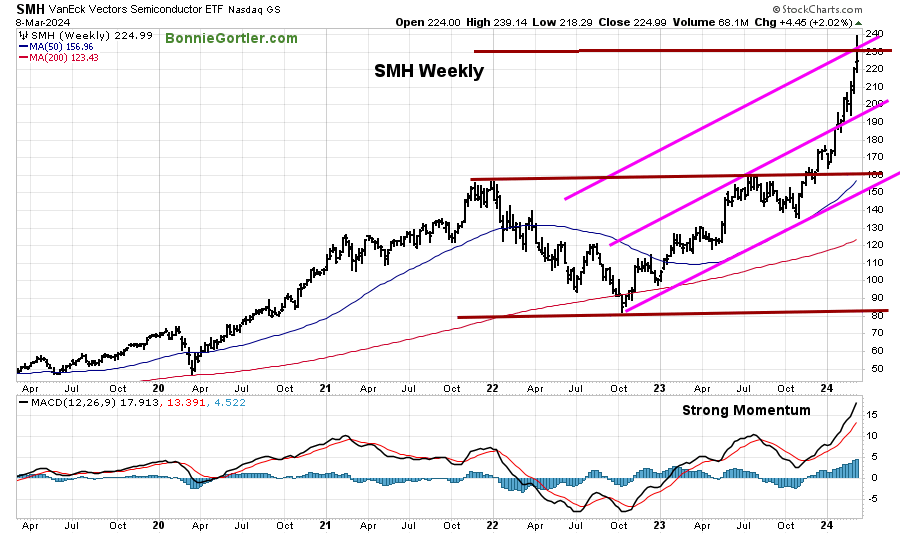
Figure 10: Weekly Semiconductors (SMH) (Top) and 12-26-9 MACD (Bottom)
030824 SMH Weekly
Source: Stockcharts.com
The top chart shows the Weekly Semiconductors (SMH) ETF, concentrated mainly in US-based Mega-Cap Semiconductor companies. SMH tends to be a leading indicator for the market when investors are willing to take on increased risk, and the opposite is true when the market is falling.
The Semiconductor ETF (SMH) rose +2.02% last week, closing at 224.99. However, SMH had a nasty reversal on Friday, peaking at 239.14, falling -3.92%, and closing at the day’s low after hitting the top of the weekly channel (top brown line).
Support is at 220.00, 195.00 and 160.00.
MACD (middle chart) shows strong momentum after giving false sell signals as SMH surged higher. Despite the likelihood of another test of the highs, I recommend patience before making new purchases in Semiconductor stocks to ensure a blow-off top has not occurred.
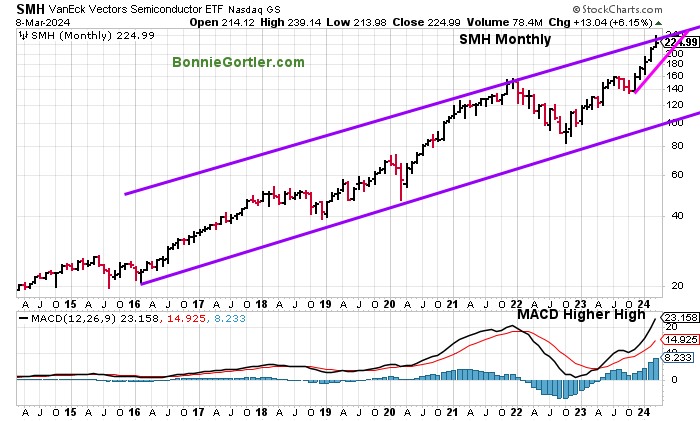
Figure 11: Monthly Semiconductors (SMH) (Top) and 12-26-9 MACD (Bottom)
030824 SMH Monthly
Source: Stockcharts.com
The top chart shows the Monthly Semiconductors (SMH) ETF hitting the top channel.
Like the weekly chart, MACD made a higher high, confirming the high made in SMH. There is a risk of higher volatility over the next several weeks to months as traders and investors lock in recent gains.
Are you interested in learning more about the stock market? Learn how to implement a powerful wealth-building mindset and simple, reliable strategies to help you grow your wealth in my eCourse Wealth Through Investing Made Simple. Get more information here:
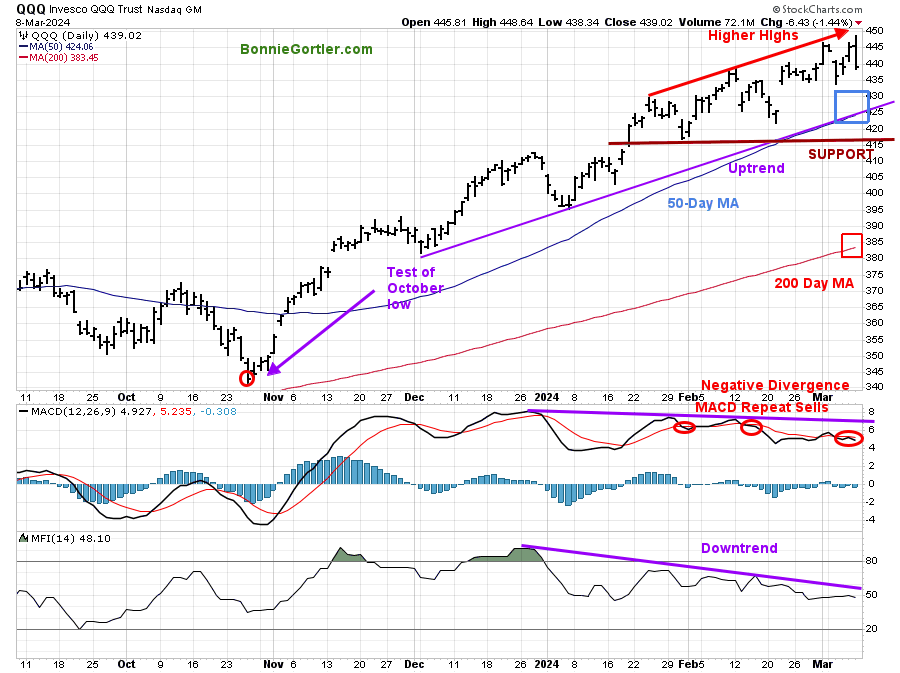
Figure 12: Daily Invesco QQQ Trust (QQQ) Price (Top) and 12-26-9 MACD (Bottom)
030824 QQQ Daily
Source: Stockcharts.com
The chart shows the daily Invesco QQQ, an exchange-traded fund based on the Nasdaq 100 Index. QQQ made a low in October 2023 (red circle), followed by a successful retest of the low in early January 2024 and the start of an uptrend.
Last week, Nasdaq 100 (QQQ) closed at 439.02, -1.48% closing near its low on Friday. QQQ remains above the rising 50-day Moving Average (blue rectangle) and the 200-day Moving Average (red rectangle), a sign of underlying strength. QQQ upside objective of 470.00 remains.
Support is at 425.00, 416.00, 385.00. Two closes below 425.00 will likely lead to short-term selling pressure.
The bottom chart, MACD (12, 26, 9), remains on a sell, above 0, overbought, and falling, continuing to give repeat sell signals with a negative divergence, higher high in QQQ but lower low in MACD.
Money flow (lower chart) remains in a downtrend and falling.
For short-term direction, look at QQQs top holdings: MSFT, AAPL, NVDA, AMZN, and META.
Figure 13: QQQ Top Holdings as of 3/7/24
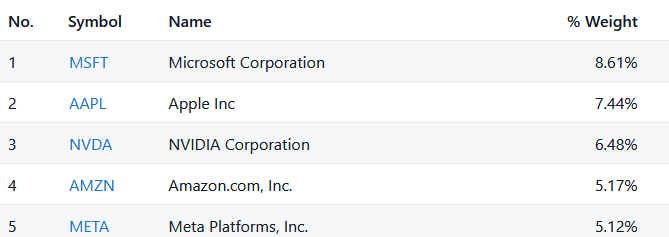
030724 QQQ top Holdings
Source: stockanalysis.com
Figure 14: AAPL Weekly and 12-26-9 MACD (Bottom)
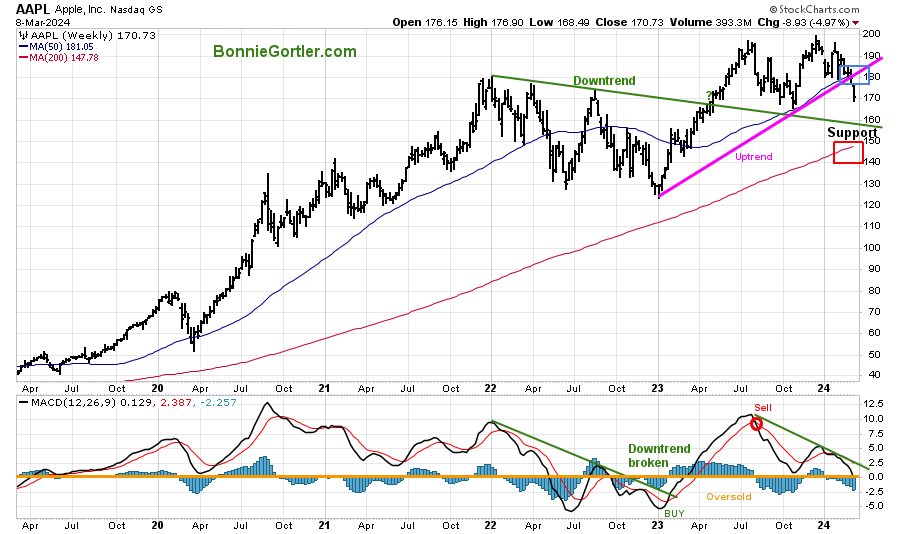
030824 AAPL Weekly
Source: Stockcharts.com
The chart shows Weekly Apple (APPL) for the past five years. AAPL is one of the top holdings in QQQ and in over 300 ETFs.
AAPL, down -11.21% in 2024, continues to accelerate lower after breaking the 2023 weekly uptrend (pink line). AAPL closed below the 50-week moving average, implying underlying weakness.
The bottom chart, MACD (12, 26, 9), remains on a sell, in a downtrend. The risk remains of further decline, and more time is necessary for a safer bottom formation to develop.
Figure 15: The S&P 500 Index (SPY) Daily (Top) and 12-26-9 MACD (Bottom)
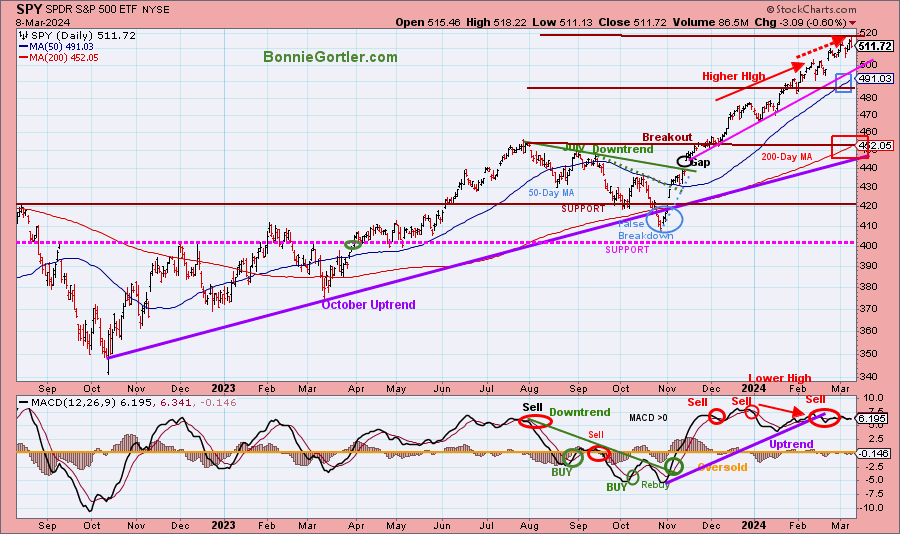
030824 SPY Daily
The S&P 500 (SPY) had a false breakdown (blue circle) in October after being in an uptrend (purple line). Two downtrends were in effect and broken to the upside in September (green dotted line) and August (green solid line).
The daily trend for the SPY remains up. The SPY accomplished its upside objective of 510.00. The SPY closed at 511.72, down -0.22% for the week, remaining above the rising 50-day Moving Average (blue rectangle) and the 200-day Moving Average (red rectangle), a sign of strength.
Support is at 505.00, 491.00, 480.00, 465.00 and 452.00.
MACD (bottom chart) remains on a sell above 0, moving sideways, and is no longer in an uptrend from November.
SPY finished down on the week for only the third time in 2024.
It will be a positive in the short term if support at 505.00 holds and SPY closes above last week’s high of 518.22. On the other hand, a close below 505.00 could lead to a sharp, quick decline.
Intermediate Breakout in Gold
Figure 16: GLD Weekly and 12-26-9 MACD (Bottom)
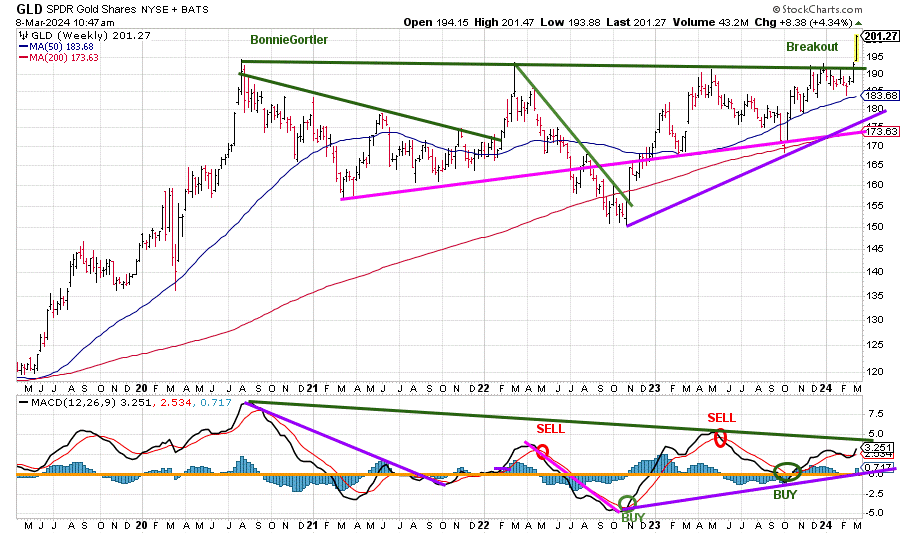
030824 GLD Gold
Source: Stockcharts.com
The chart shows the weekly Gold (GLD) ETF. GLD appears to have broken out, closing at its highest level since 2020. MACD (lower chart). It would be favorable if the July 2021 downtrend in MACD breaks, confirming the price breakout.
Summing Up:
The S&P 500 finished down last week for only the third time in 2024 after a massive run-up since October. Stocks that have been big gainers in 2024 reversed Friday off their highs and could be under selling pressure early next week as investors take profits. The primary trend is up. The market may take a breather in the short term to digest recent gains, but there is the likelihood of another test of the high. I recommend creating a plan before you act, being disciplined and patient, waiting for your setup, and not chasing the shiny stocks for quick profits.
Remember to manage your risk, and your wealth will grow.
Let’s talk investing. You are invited to schedule your Free 30-minute Wealth and Well-Being Strategy session here or by emailing me at Bonnie@BonnieGortler.com. I would love to schedule a call and connect with you.
Disclaimer: Although the information is made with a sincere effort for accuracy, it is not guaranteed that the information provided is a statement of fact. Nor can we guarantee the results of following any of the recommendations made herein. Readers are encouraged to meet with their own advisors to consider the suitability of investments for their own particular situations and for determination of their own risk levels. Past performance does not guarantee any future results.


Create more wealth in your life
with these simple strategies.
As an added bonus you will also
receive BG’s Updates and Ezine

Discover how to quickly create more well-being in your life with these simple strategies.
As an added bonus you will also
receive BG’s Updates and Ezine

As an added bonus you will receive BG’s Updates and Ezine

All work listed on BonnieGortler.com is licensed under a Creative Commons Attribution - Noncommercial - No Derivative Works 3.0 Unported License.

One thought on “Bonnie’s Market Update 3/8/24”