

10 Simple Tips for Financial Well-Being
07/01/2026
Investors were more cautious last week as only three of the eleven S&P SPDR sectors were higher. Consumer Staples (XLP) and Utilities (XLU) defensive sectors were the strongest, while Real Estate (XLRE and Consumer Discretionary) (XLY) were the weakest. The SPDR S&P 500 ETF Trust (SPY) gained +0.62%.
S&P SPDR Sector ETFs Performance Summary
11/11/22 – 11/18/22
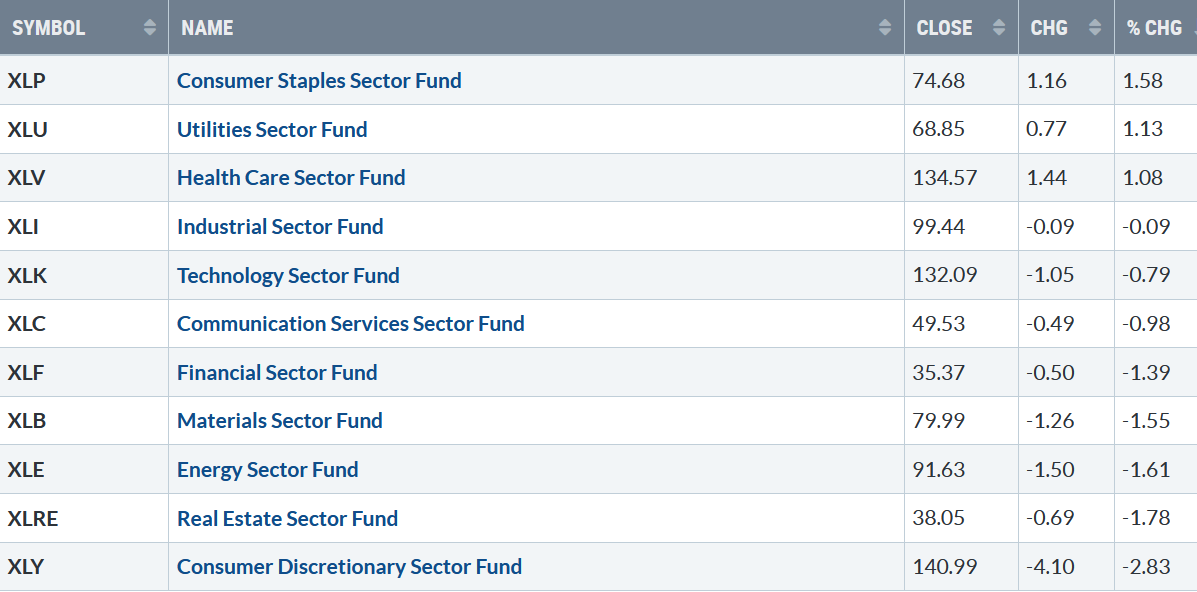
111822 Sectors WeekSource: Stockcharts.com
Figure 2: Bonnie’s Mix of ETFs
Performance Summary 11/11/22 – 11/18/22
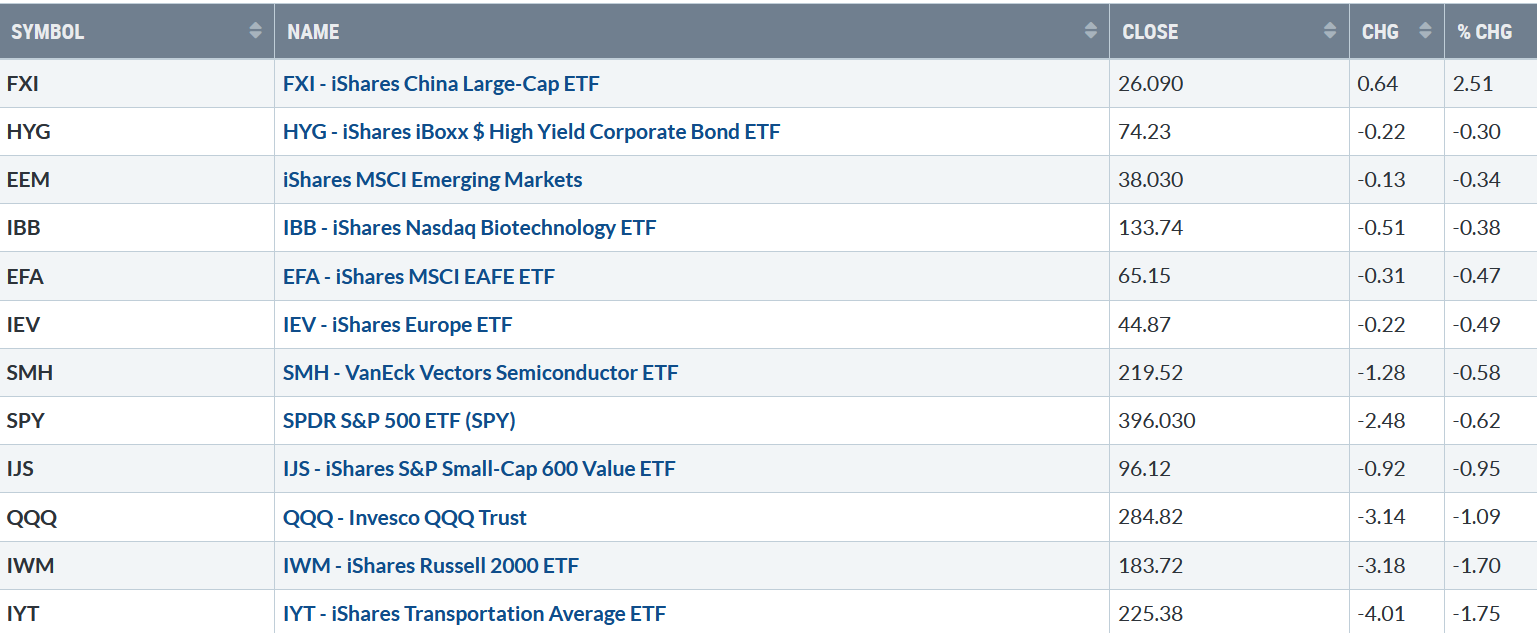
111822 Week ETFs
Source: Stockcharts.com
China continued to rise while other international markets fell less than U.S. Equities. Small Cap Growth and Transportation, which have been leaders, faltered.
Figure 3: VanEck Vectors Semiconductor (SMH) Daily
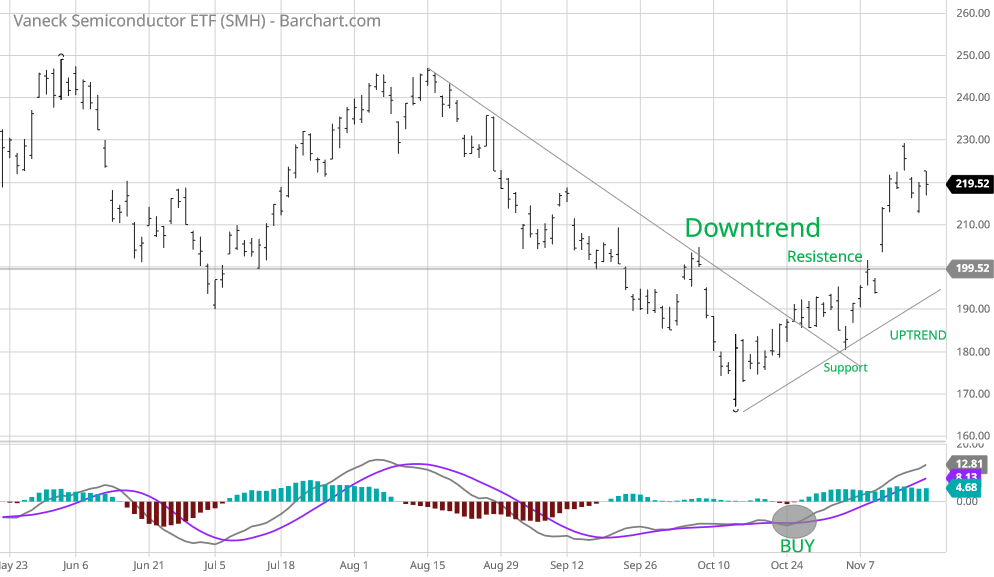
111822 SMH Daily
Source: Barchart.com (Ad)
The top part chart shows the Van Eck Vectors Semiconductor (SMH) concentrated, mostly US-based ETF of mega-cap semiconductors companies. SMH is a lead indicator for the market when investors are willing to take on increased risk and the opposite when the market is falling.
In October, SMH broke its downtrend from August and then turned down, holding above 180.00 support on the pullback above the October low.
Semiconductors (SMH), a hot sector recently, closed at 219.52, only down -0.58% holding on to most of its gains from the previous week when it was up +15.4%.
The bottom half of the chart is MACD (12, 26, 9), a measure of momentum. MACD remains on its October buy, now above 0, overbought, rising, and at its highest since August 22.
The short term is extended and may consolidate, but it’s positive the intermediate trend downside momentum has slowed and is above the 200-Week MA.
Figure 4: VanEck Vectors Semiconductor Weekly and 12-26-9 MACD (Bottom)
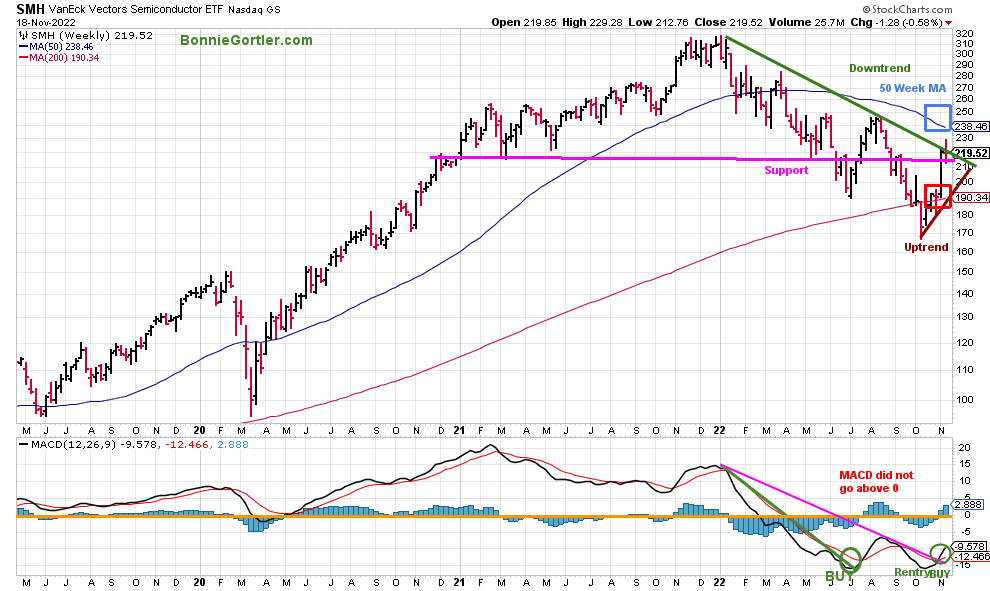
111822 SMH Weekly
Source: Stockcharts.com
SMH closed slightly at its 2022 downtrend, below the 50-Week MA, but SMH is showing underlying strength closing above its 200-Week MA.
Support remains at 210.00 and 180.00, while resistance remains at 230.00 and 240.00.
Its bullish MACD (lower chart) is rising and has given a reentry buy, clearly breaking the 2022 downtrend (pink line).
For further gains, SMH needs to hold a weekly close above 210.00. On the other hand, a weekly close below 210 would imply a pullback to 190.00, and if the decline begins to accelerate, to potentially test the October lows.
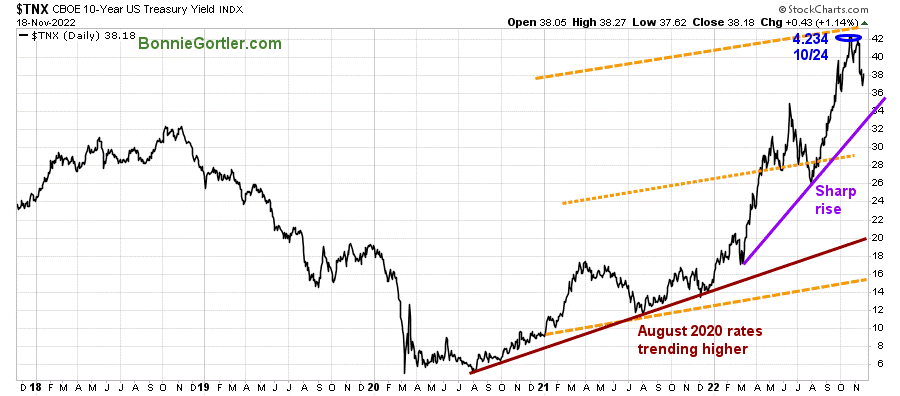
Figure 5: UST 10YR Bond Yields Daily
111822 UST 10 Yr Bond Yields Daily
Source: Stockcharts.com
The 10-Year U.S. Treasury yields rose slightly, closing at 3.818% remaining below the high made on 10/24 of 4.234% and below the upper channel objective. Support is at 3.400%. Growth-oriented stocks that need to borrow money struggle when interest rates rise.
It is favorable for stocks if yields continue to decline. On the other hand, yields rising above the channel would likely put pressure on equities.
The major averages were all down last week. The Dow was virtually flat, down -0.01%, the S&P 500 fell -0.69%, and the Nasdaq was down -1.57%, weaker than both the Dow and S&P 500.
The Russell 2000 Index was down -1.75%, and the Value Line Arithmetic Index (a mix of approximately 1700 stocks fell -1.36%.
Want a 15-minute chat with me about your investments? Just email me at Bonnie@Bonniegortler.com to set it up.
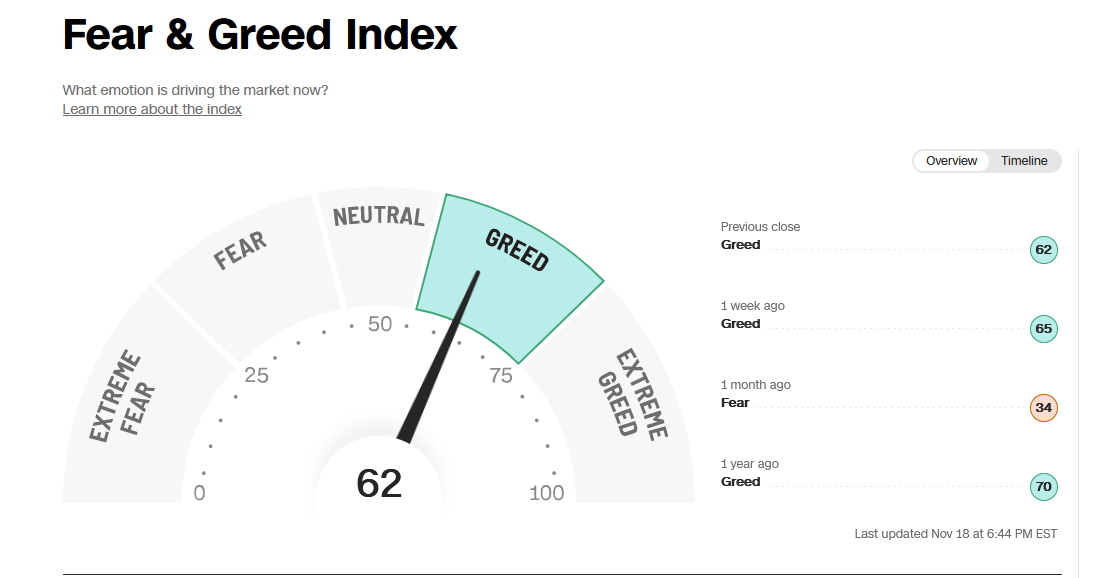
Figure 6: Fear and Greed Index
111822 Fear and Greed
Source CNBC
Market sentiment based on the CNBC Fear and Greed Index (a contrary indicator) fell last week to 62, still showing greed, the easy money is over, but room to go to extreme greed and increased risk.
Weekly market breadth was negative on the New York Stock Exchange Index (NYSE) and Nasdaq. The NYSE had 1484 advances and 1928 declines, with 192 new highs and 131 new lows. There were 2224 advances and 3094 declines on the Nasdaq, with 319 new highs and 495 new lows.
Without positive breadth, the major averages will likely have difficulty making further gains in the short term. However, if New Highs expand and New lows contract for the NYSE and Nasdaq, the rally will likely gain strength soon.
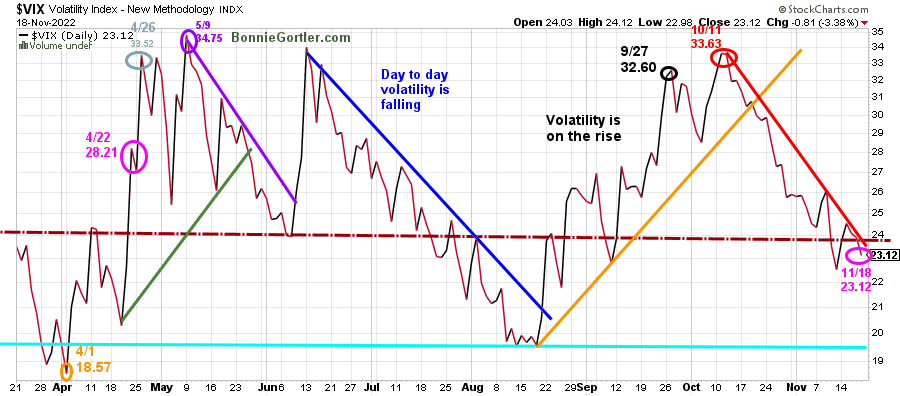
Figure 7: CBOE Volatility Index VIX
111222 VIX
Source: Stockcharts.com
The CBOE Volatility Index (VIX), a measure of fear, has been trading above 20.00 for most of 2022. In late January, VIX made a high at 36.95 on 3/7 (blue circle), followed by a pullback to a low on 4/1 at 18.57 (orange circle). VIX approached the low in August but trended higher, peaking at 33.63 on 10/11 (red circle).
VIX continued to go lower following breaking the August up trend (orange line) in October.
VIX rose slightly last week, closing at 23.12 (pink circle), remaining below the downtrend (red line) that has been in effect since October 11.
The S&P 500 intraday range was less than 1% since November 10. A close above 26.00 would indicate an increase in day-to-day volatility and a short-term decline.
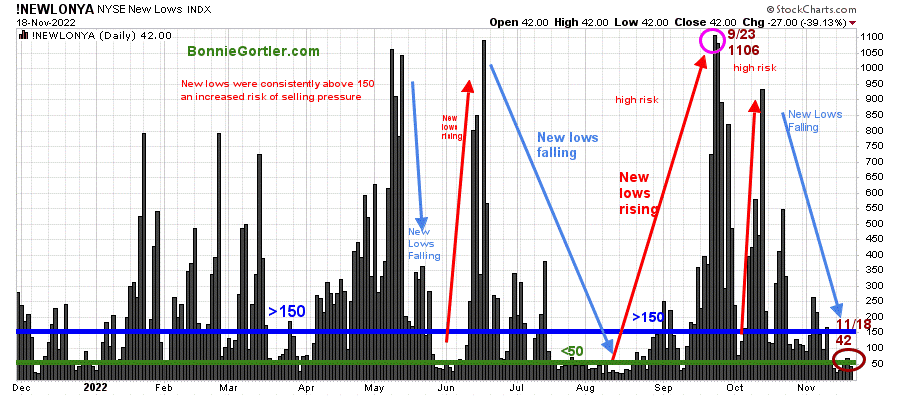
Figure 8: Daily New York Stock Exchange (NYSE) New Lows
111822 NYSE New Lows D
Source: Stockcharts.com
Watching New lows on the New York Stock Exchange is a simple technical tool that helps awareness of the immediate trend’s direction.
New lows warned of a potential sharp pullback, high volatility, and “panic selling” for most of 2022, closing above 150 in 2022. The peak reading was 9/23 when New Lows made a new high of 1106 (pink circle).
New Lows fell in late October below 150, out of the high-risk area, and then began to increase but were well below the September peak. New lows have been trending down since October.
New Lows closed at 42 (brown circle), a slight increase from last week’s remaining in a low-risk zone.
Learn more about the significance of New Lows in my book, Journey to Wealth, published on Amazon. If you would like a preview, get a free chapter here.
Figure 9: New York Stock Exchange Index Weekly
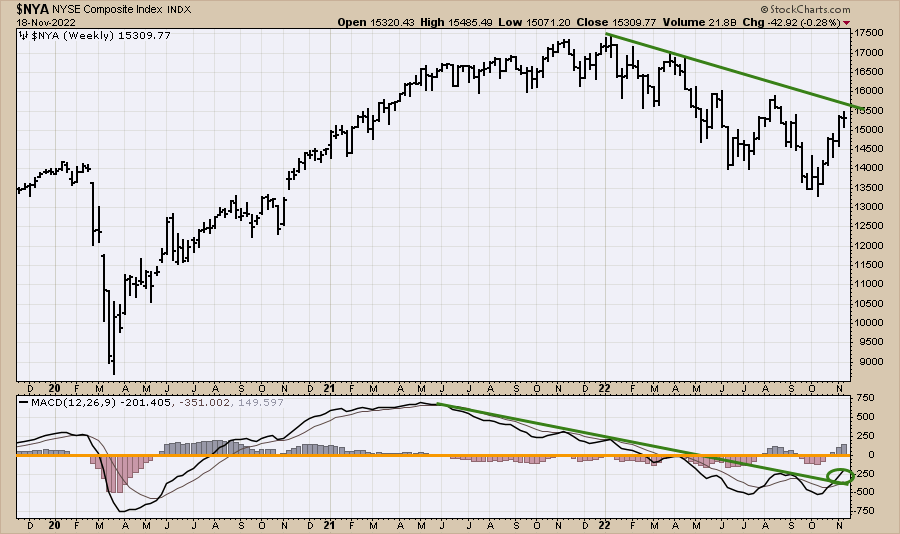
111222 NYSE Index Weekly
Source: Stockcharts.com
The intermediate downtrend of the New York Stock Exchange Index remains in effect. However, it’s bullish that the MACD downtrend from June 2021 (green line) is broken, and MACD is rising from below 0 and on a buy.
MACD indicates that the New York Index will break the intermediate downtrend to the upside. Time will tell.
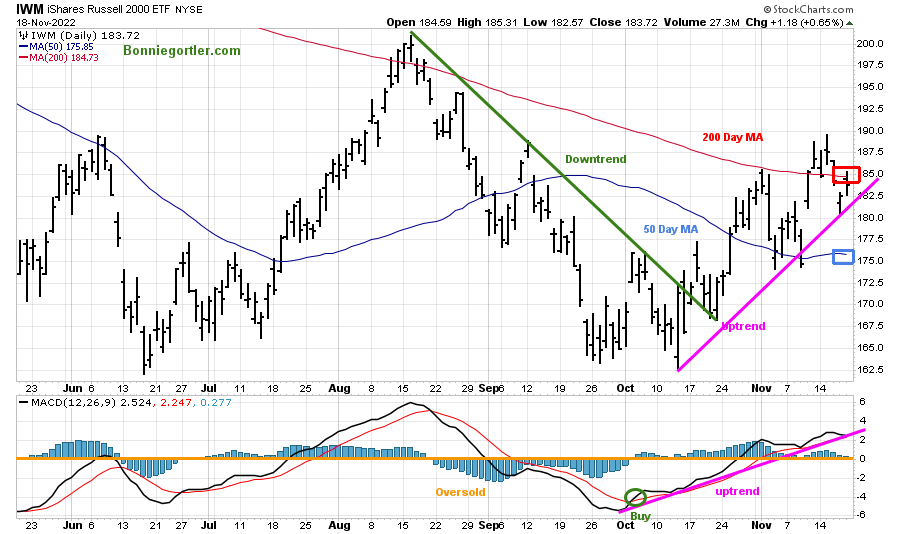
Figure 10: Daily iShares Russell 2000 (IWM) Price (Top) and 12-26-9 MACD (Bottom)
111222 IWM Daily
Source: Stockcharts.com
The top portion of the chart is the daily iShares Russell 2000 Index ETF (IWM), the benchmark for small-cap stocks, with a 50-Day Moving Average (MA) (blue line) and 200-Day Moving Average (MA) that traders watch and use to define trends.
At the end of March, IWM failed to break out above resistance at 210.00 and then trended lower into June, followed by a rally into August and then turning down until the October low.
There was no follow-through last week. IWM fell -1.70%, closing at 183.72 above its 50-Day Moving Average (blue rectangle) and closed below its 200-Day Moving Average (red rectangle) after closing above for the first time since the August high. It was a negative sign for IWM to lag the S&P 500. Short-term resistance is at 190.00 200.00, followed by 210.00. Support is at 182.50, 175.00, and 170.00.
MACD (middle chart) remains on its buy, above 0, and in an uptrend; however, if IWM is weak, MACD will likely go on a sell soon.
A close below 175.00 would imply a short-term decline is likely. However, if IWM can hold above 182.50, expect IWM to move higher toward the August high.
The intermediate trend remains positive for Small and Midcaps
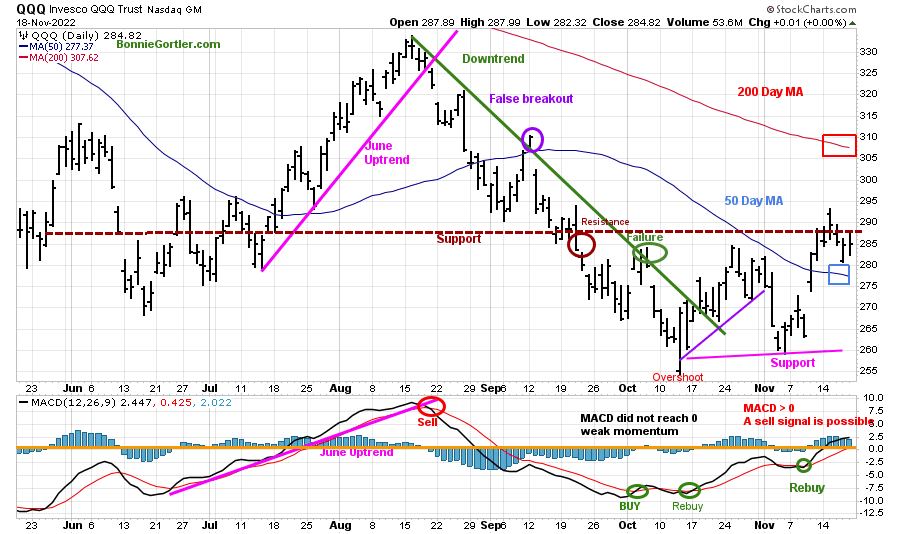
Figure 11: Daily Invesco QQQ Trust (QQQ) Price (Top) and 12-26-9 MACD (Bottom)
111222 QQQ Daily
Source: Stockcharts.com
The chart shows the daily Invesco QQQ, an exchange-traded fund based on the Nasdaq 100 Index. QQQ moved lower after a false break out (purple circle) in September of the August downtrend (green line). In November, QQQ broke its October uptrend (purple line), and the decline continued.
QQQ lagged the Dow and S&P 500, falling -1.09%, closing at 284.8.
It was promising despite the weakness; QQQ held support above 278.00 and 275.00. Resistance is 290.00, 300.00, and 310.00.
If QQQ remains above 260.00, downside pressure is likely to be contained.
The bottom chart is MACD (12, 26, 9), on a buy above 0, after being below 0 since August, and can give a sell.
Trend Change Forthcoming in QQQ?
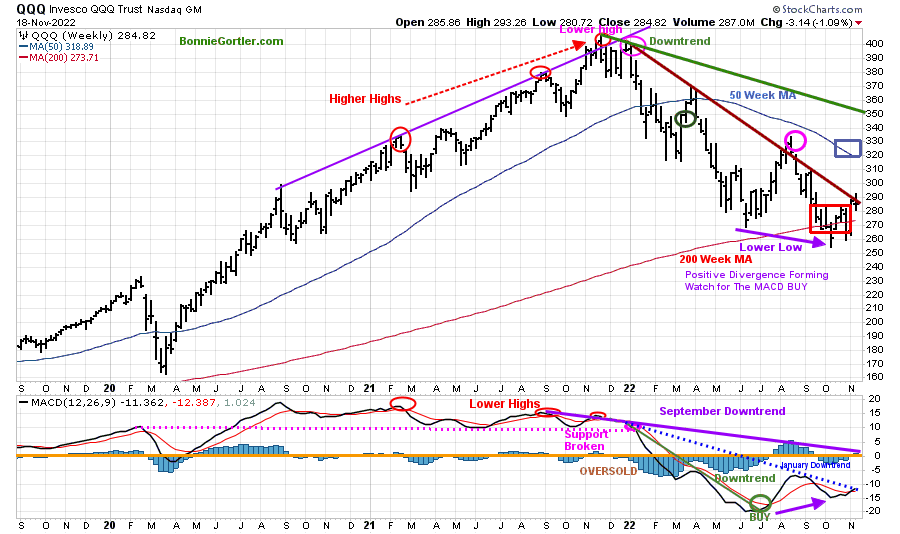
Figure 12: Weekly Invesco QQQ Trust (QQQ) Price (Top) and 12-26-9 MACD (Bottom)
111222 QQQ WEEKLY
Source: Stockcharts.com
The top chart shows the weekly Invesco QQQ Trust (QQQ) making higher highs peaking in November 2021 (red circles) but failing to make a new high in December 2021, QQQ then formed two downtrends (brown line and green line).
One downtrend (brown line) was broken back in August, but QQQ immediately turned down (pink circle), stalling below a down-sloping 50-Week MA. QQQ then made a lower low in October (purple arrow), followed by gains.
MACD in the lower chart has a higher low. Notice the positive divergence. A rebuy with a break of the January downtrend (blue dotted line) as confirmation would imply the start of a potential sustainable rally for the intermediate term (weeks to months). It would be favorable if QQQ has a weekly close above 290.00 and MACD breaks its 2022 weekly downtrend confirming the intermediate trend is up.
Figure 13: The S&P 500 Index ($SPX) Daily and 12-26-9 MACD (Bottom)
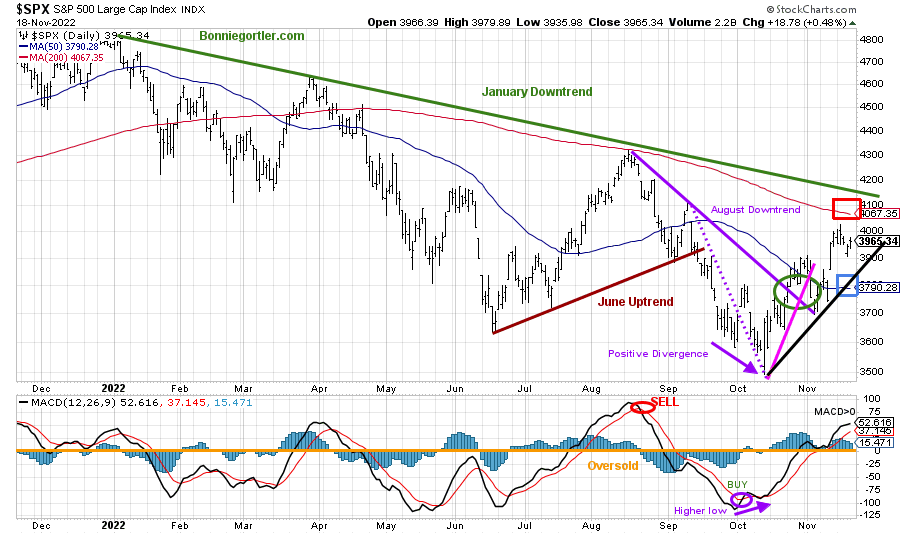
111222 SPX Daily
Source: Stockcharts.com
The S&P 500 (SPX) 2022 downtrend remains in effect (green line)
Last week, the S&P 500 (SPX) fell -0.69%, closing at 3963.34, holding above support on the pullback at 3700.00 in early November.
Its positive SPX closed above its 50-Day Moving Average (blue rectangle) and is getting closer to the 200-Day Moving Average (red rectangle), where the SPX peaked in August peak, and the May rally stalled.
Support remains at 3900, 3800, and 3700. Resistance is at 4100.
MACD, lower chart, remains on a buy, be alert to a MACD sell if the SPX weakens. On the other hand, if SPX breaks above 4100, a rally toward 4300 is possible.
If you are interested in following this chart and other charts during the week, I invite you to join my FB group Wealth Through Market Charts, where you will see other charts updated intraday.
U.S. Dollar weakness is positive for Global and U.S. Equities
Figure 14: US Dollar Daily
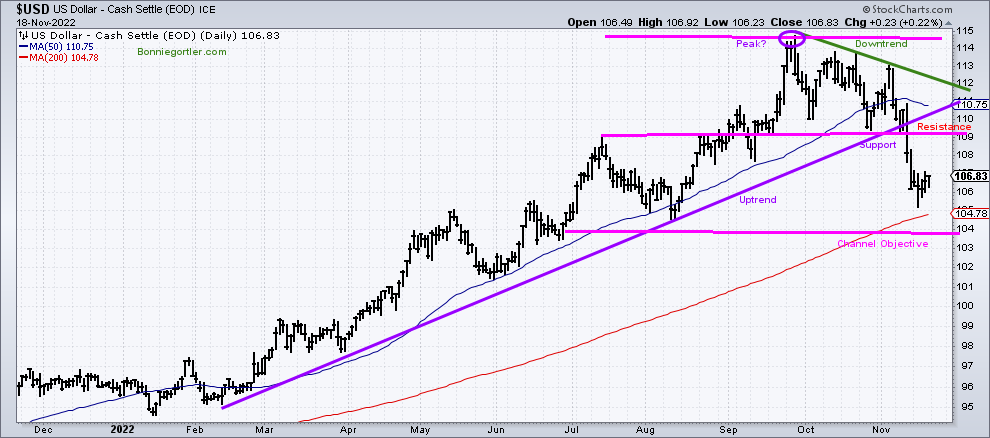
111822 USD Daily
Source: Stockcharts.com
The U.S. dollar appears to have peaked in September, starting a downtrend that remains in effect (mentioned in the 11/4/22 market update).
The U.S. dollar gained 0.62 after falling -4.16% the previous week, closing near its highs.
The continued weakness of the U.S dollar falling below support and breaking its uptrend (purple line) bodes well for global and U.S. equities in the coming weeks.
The downside objective remains at 103.80. A close above 110.00 would negate the downside objective.
Summing Up:
Investors were more cautious last week, with defensive sectors leading and Small Cap stocks weaker instead of outperforming the S&P 500. It is positive Technology, and Semiconductors digested their gains, holding above support as the market fell early in the week. The short and intermediate-term charts give a mixed message. The intermediate momentum patterns are improving, showing less downside momentum. Yet, the short-term is extended and vulnerable to a correction. Keep an eye on Semiconductors and Technology stocks if they move higher. Watch market breadth on the NYSE and Nasdaq for an expansion of market breadth, a clue the market will move higher into the most favorable seasonal period of the year starting with Thanksgiving, which historically is positive.
Happy Thanksgiving to you and your family
Remember to manage your risk, and your wealth will grow.
If you liked this article, you will love my Free Grow and Sustain Your Wealth Report. Get it here:
Do you like charts, I invite you to my FB group Wealth Through Market Charts, or email me at Bonnie@Bonniegortler.com.
I would love to hear from you. If you have any questions or comments or would like to talk about the market, click here.
Disclaimer: Although the information is made with a sincere effort for accuracy, it is not guaranteed that the information provided is a statement of fact. Nor can we guarantee the results of following any of the recommendations made herein. Readers are encouraged to meet with their own advisors to consider the suitability of investments for their own particular situations and for determination of their own risk levels. Past performance does not guarantee any future results.


Create more wealth in your life
with these simple strategies.
As an added bonus you will also
receive BG’s Updates and Ezine

Discover how to quickly create more well-being in your life with these simple strategies.
As an added bonus you will also
receive BG’s Updates and Ezine

As an added bonus you will receive BG’s Updates and Ezine

All work listed on BonnieGortler.com is licensed under a Creative Commons Attribution - Noncommercial - No Derivative Works 3.0 Unported License.


Free Report:
Grow and Sustain Your Wealth
Discover how to grow your money with these easy, simple steps.

