

10 Simple Tips for Financial Well-Being
07/01/2026
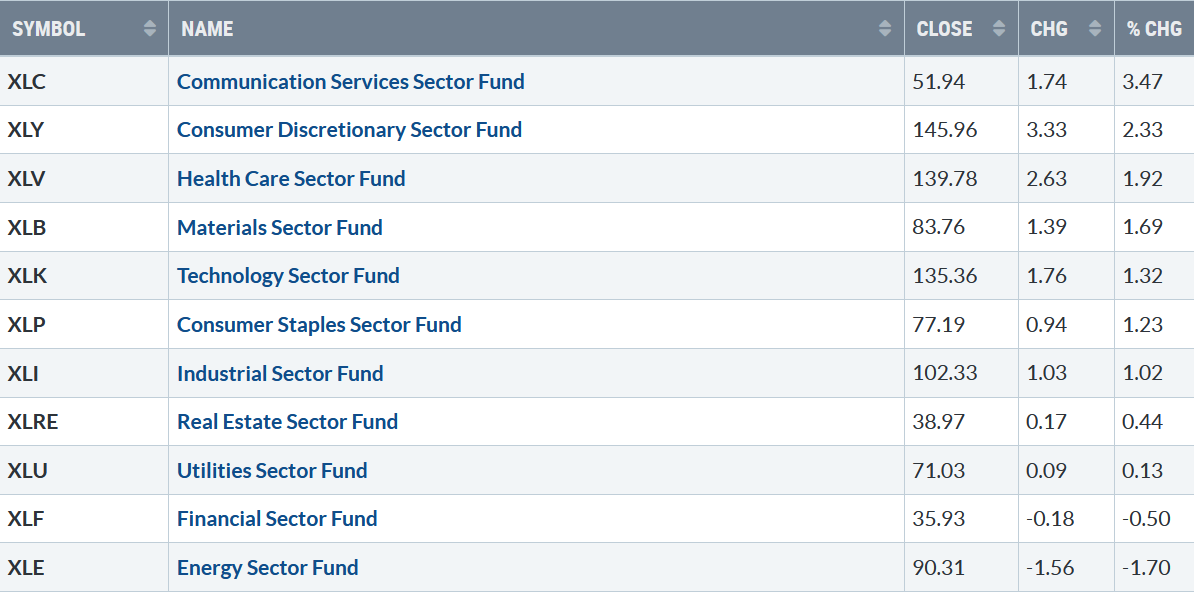
The holiday spirit continued last week, with nine of eleven S&P SPDR sectors higher. Communication Services (XLC) and Consumer Discretionary (XLB) were the strongest, while Financial (XLF) and Energy (XLE) were the weakest, while the SPDR S&P 500 ETF Trust (SPY) gained +1.14%.
S&P SPDR Sector ETFs Performance Summary
11/25/22 – 12/02/22
120222 Sectors Week
Source: Stockcharts.com
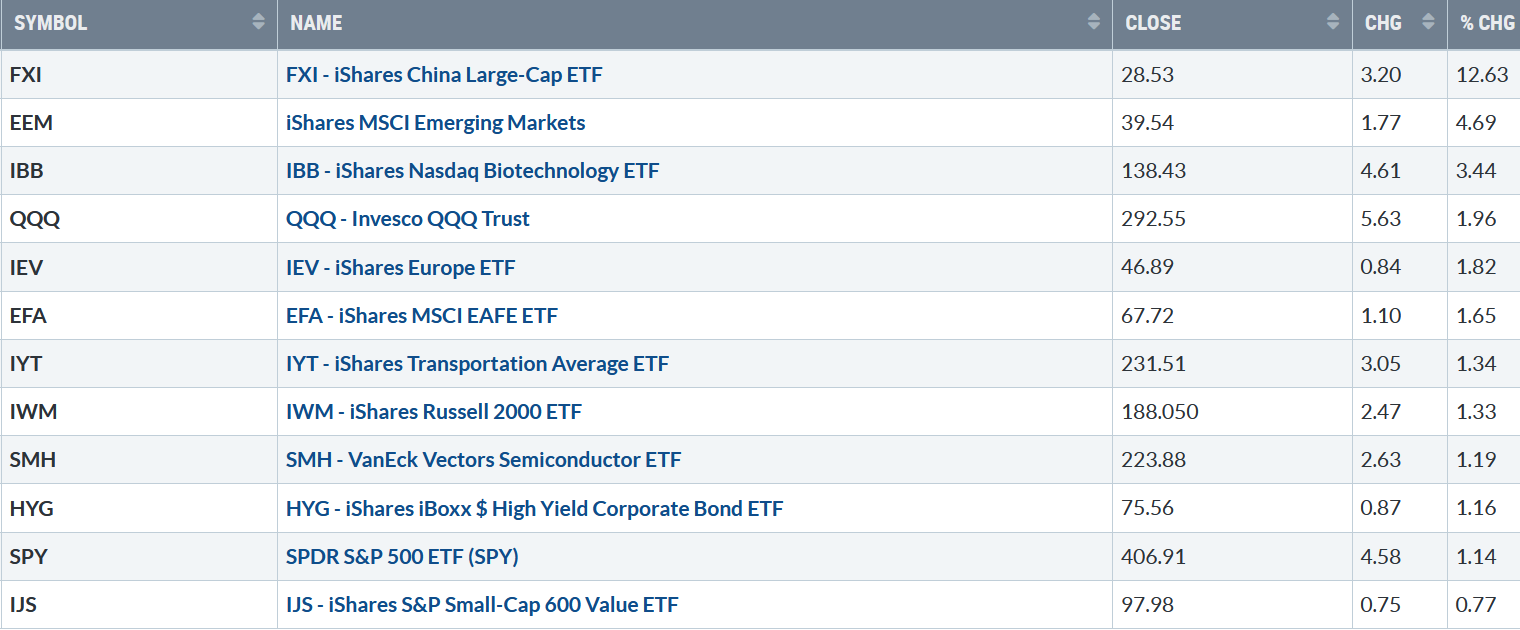
Figure 2: Bonnie’s Mix of ETFs
Performance Summary 11/25/22 – 12/02/22
120222 Week ETFs
Source: Stockcharts.com
Global markets strength continued as the U.S. Dollar fell, with China as the leader, followed by Emerging Markets, Biotechnology, and Technology.
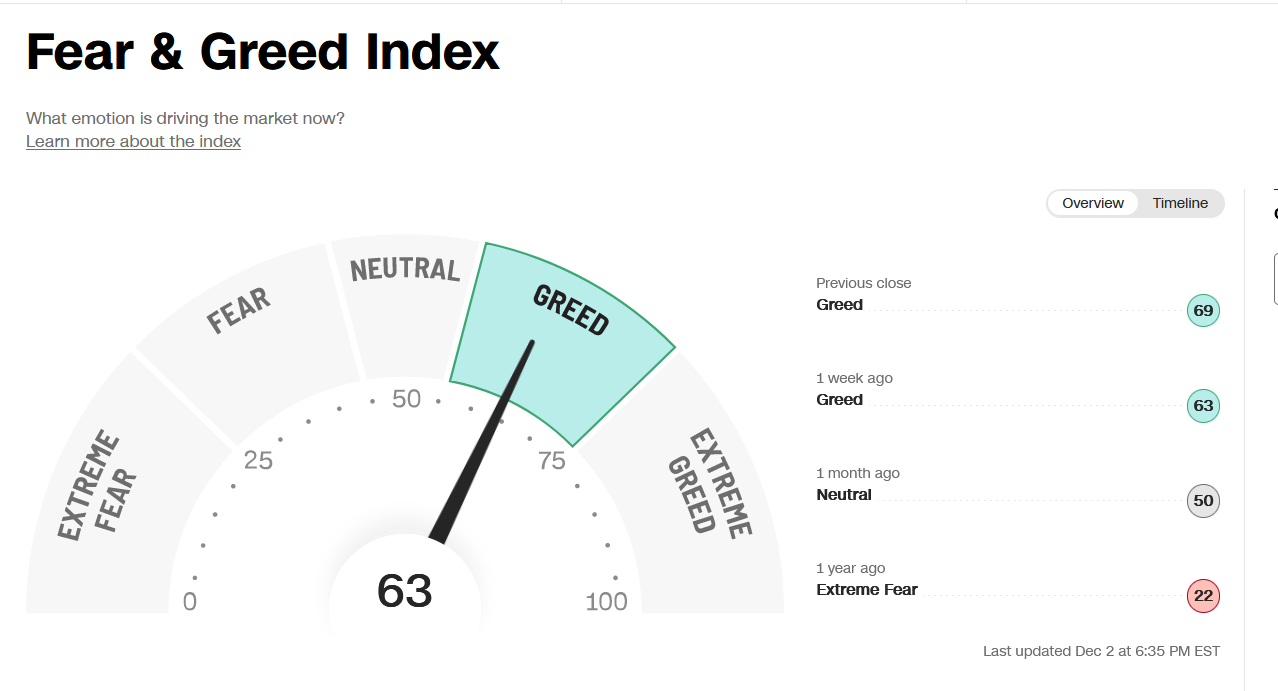
Figure 3: Fear and Greed Index
120222 Fear and Greed Index
Source CNBC
Market sentiment based on the CNBC Fear and Greed Index (a contrary indicator) was no change closing at 63 last week, still showing greed. Sentiment shows increased risk but will likely go to extreme greed in the next several weeks before a correction begins.
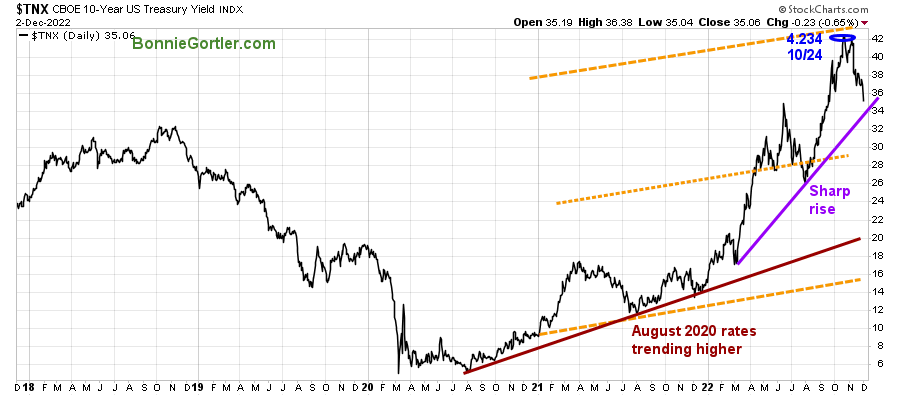
Figure 4: UST 10YR Bond Yields Daily
120222 UST 10 Yr Bond Yields Daily
Source: Stockcharts.com
The 10-Year U.S. Treasury yields continued falling, closing at 3.506% below the high made on 10/24 of 4.234% and below the upper channel objective. Support is at 3.400%.
It is favorable for stocks in the short term if yields continue to decline. On the other hand, yields rising again towards the upper channel would likely put pressure on growth stocks with no earnings and borrowing money.
The major averages rose last week, with the Dow rising +0.24%, S&P 500 up +1.13%, and the Nasdaq rising +2.09%, stronger than both the Dow and S&P 500. The Russell 2000 Index rose +1.27%, and the Value Line Arithmetic Index (a mix of approximately 1700 stocks) gained +1.20%.
Weekly market breadth was positive on the New York Stock Exchange Index (NYSE) and Nasdaq. The NYSE had 2239 advances and 1156 declines, with 238 new highs and 157 new lows. There were 3297 advances and 2040 declines on the Nasdaq, with 377 new highs and 530 new lows.
Continued positive breadth would be a bullish sign for a sustainable rally, weeks to months.
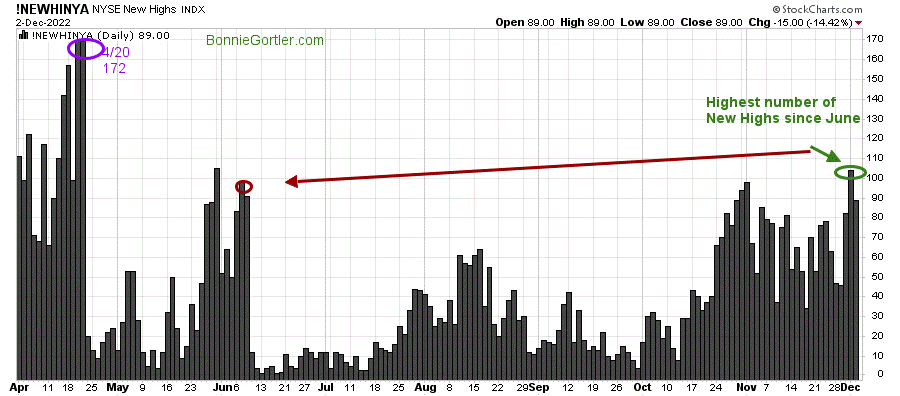
Figure 5: NYSE New Highs
120222 NYSE New Highs Daily
Source: Stockcharts.com
Although there was the highest number of New Highs on the NYSE, more new highs are necessary for the advance to broaden. It will be favorable if New Highs increase to more than the highs made on April 20. On the other hand, if New Highs start to decrease, a short pullback is likely.
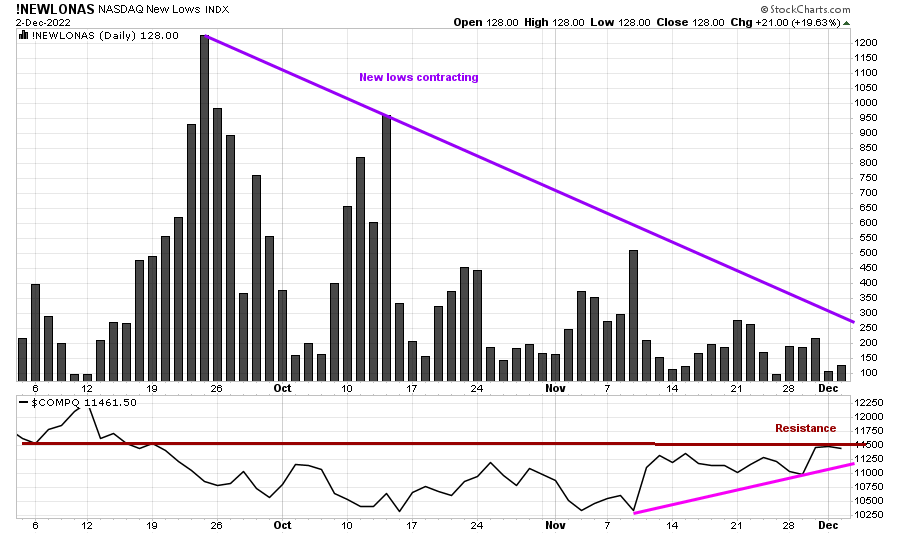
Figure 6: New Lows Nasdaq
120222 Nasdaq New Lows Daily
Source: Stockcharts.com
Its positive Nasdaq New Lows have been contacting (purple line) since October (top chart).
Nasdaq closed at 11461.50 (lower chart), under resistance (brown line). If New Lows start to increase, Nasdaq will likely fail to get above resistance and begin to weaken.
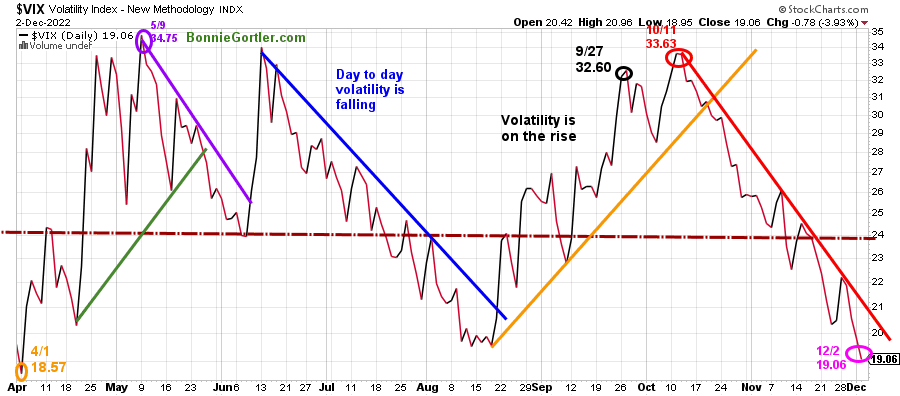
Figure 7: CBOE Volatility Index VIX
120222 VIX Daily
Source: Stockcharts.com
The CBOE Volatility Index (VIX), a measure of fear, has been trading above 20.00 for most of 2022. In late January, VIX peaked at 36.95 on 3/7, followed by a pullback to its low in 2022 on 4/1 at 18.57 (orange circle). VIX peaked at 33.63 on 10/11 (red circle) and has trended down following breaking the August up trend (orange line) in late October while equities rose.
VIX fell last week, closing at 19.06 (pink circle), the lowest level since April and below the downtrend (red line) that has been in effect since October 11.
Intraday volatility has remained quiet for the past few weeks. However, if VIX closes above 24.00, look for an increase in day-to-day volatility.
Want a 15-minute chat with me about your investments? Just email me at Bonnie@Bonniegortler.com to set it up.
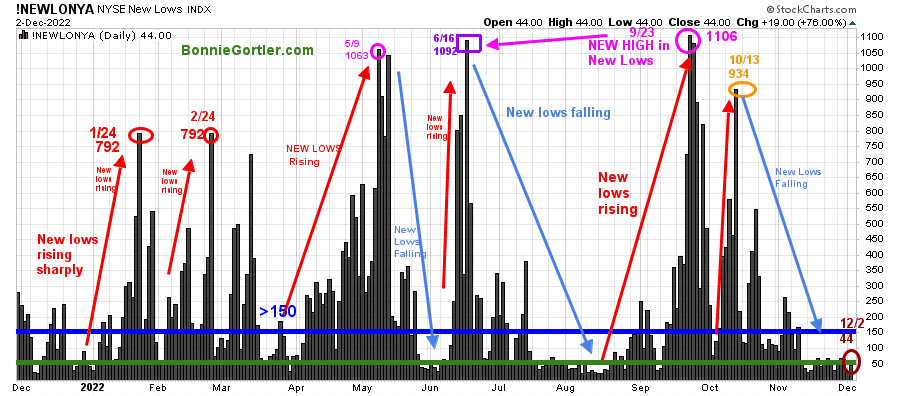
Figure 8: Daily New York Stock Exchange (NYSE) New Lows
120222 NYSE New Lows Daily
Source: Stockcharts.com
Watching New lows on the New York Stock Exchange is a simple technical tool that helps awareness of the immediate trend’s direction.
New lows warned of a potential sharp pullback, high volatility, and “panic selling” for most of 2022, closing above 150 in 2022. The peak reading was 9/23 when New Lows made a new high of 1106 (pink circle).
New Lows have contracted, trending down since October falling below 150, no longer in a high-risk area.
New Lows closed at 44 (brown circle) in a low-risk zone.
Learn more about the significance of New Lows in my book, Journey to Wealth, published on Amazon. If you would like a preview, get a free chapter here.
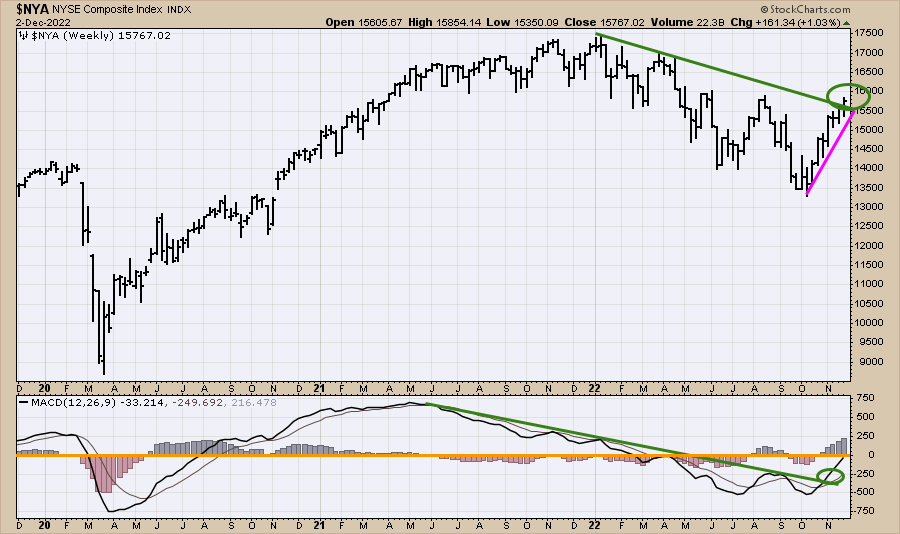
Figure 9: New York Stock Exchange Index Weekly (Top) and 12-26-9 MACD (Bottom)
120322 NYSE weekly
Source: Stockcharts.com
As MACD implied, The New York Stock Exchange Index broke the intermediate downtrend last week’s rising of +1.03%, shifting the intermediate trend to up.
It’s bullish that the MACD downtrend from June 2021 (green line) is broken, and MACD is rising from below 0 and on a buy.
As long as the New York Index has a weekly close above 15000, the uptrend (pink line) will remain, and a likelihood of a further advance.
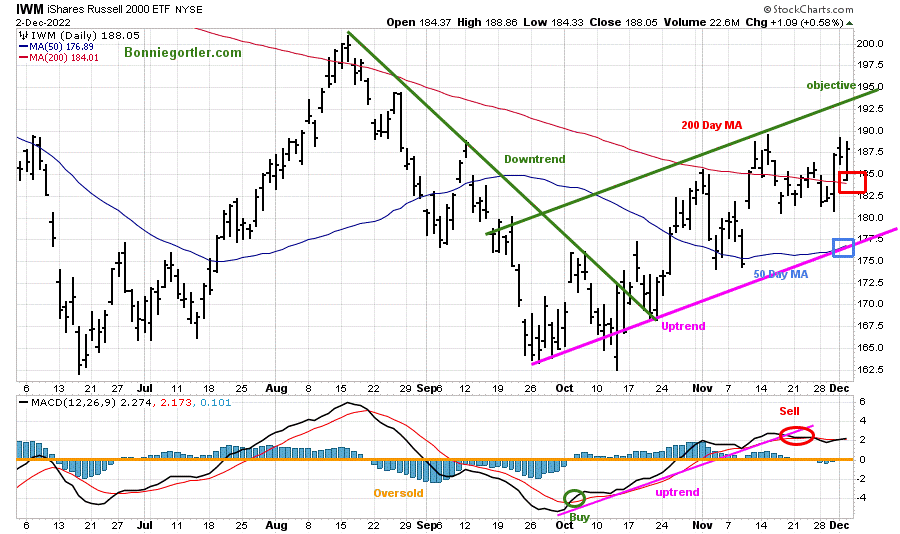
Figure 10: Daily iShares Russell 2000 (IWM) Price (Top) and 12-26-9 MACD (Bottom)
120222 IWM Daily
Source: Stockcharts.com
The top portion of the chart is the daily iShares Russell 2000 Index ETF (IWM), the benchmark for small-cap stocks, with a 50-Day Moving Average (MA) (blue line) and 200-Day Moving Average (MA) that traders watch and use to define trends.
At the end of March, IWM failed to break out above resistance at 210.00 and then trended lower into June, followed by a rally into August and then turning down until the October low.
IWM closed at 188.05, up +1.33%, and its positive IWM closed above its 50-Day Moving Average (blue rectangle) and 200-Day Moving Average (red rectangle).
MACD (middle chart) is on a sell and broke its uptrend; a sign momentum is weakening.
Short-term resistance remains at 193.00, followed by 200.00, and IWM support is 177.50, the lower channel (pink line).
A close below 177.50 would imply a short-term decline could occur, but if IWM can hold above 182.50, expect IWM to rally towards resistance at 192.50.
Better tape action in Nasdaq
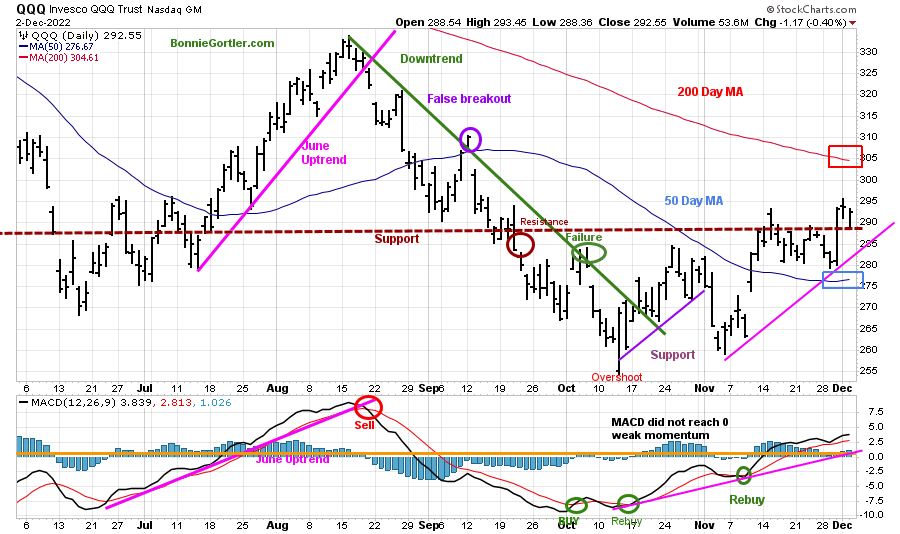
. Figure 11: Daily Invesco QQQ Trust (QQQ) Price (Top) and 12-26-9 MACD (Bottom)
120222 QQQ Daily
Source: Stockcharts.com
The chart shows the daily Invesco QQQ, an exchange-traded fund based on the Nasdaq 100 Index. QQQ moved lower after a false break out (purple circle) in September of the August downtrend (green line). In November, QQQ broke its October uptrend (purple line), and the decline continued.
It was encouraging that QQQ was stronger than the Dow and S&P 500 last week, rising 1.96% and closing at 292.55, breaking above resistance (brown dotted line). QQQ support is at 288.00, 280.00, and 275.00, and resistance is 300.00, 305.00, and 310.00.
The bottom chart is MACD (12, 26, 9), on a buy above 0, after being below 0 since August, and can, on weakness, give a sell.
QQQ Intermediate Trend is up
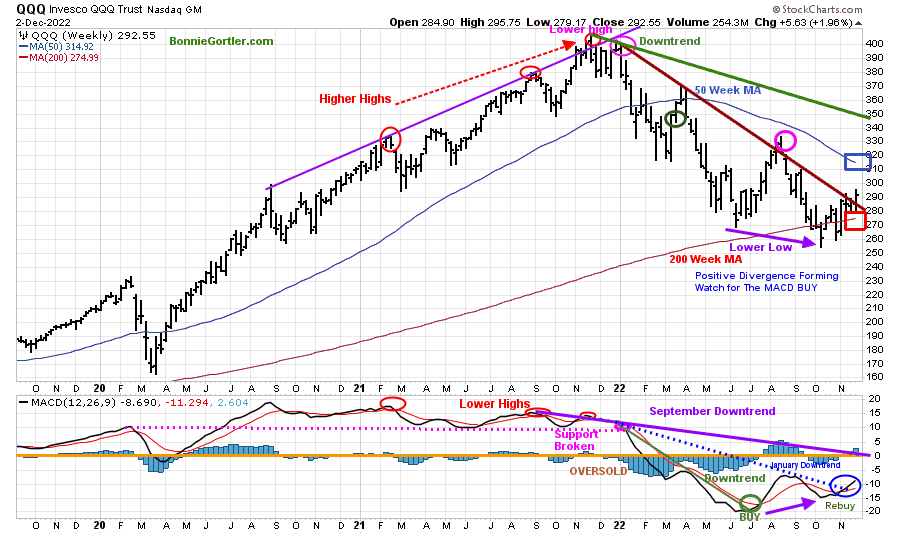
Figure 12: Weekly Invesco QQQ Trust (QQQ) Price (Top) and 12-26-9 MACD (Bottom)
120222 QQQ Weekly
Source: Stockcharts.com
The top chart shows the weekly Invesco QQQ Trust (QQQ). QQQ peaked in November 2021 (red circles) but failed to make a new high in December 2021. QQQ then formed two downtrends (brown line and green line). One downtrend (brown line) was broken back in August. QQQ immediately turned down (pink circle), making a lower low in October (purple arrow), followed by gains in November and December.
MACD in the lower chart made a higher low, as QQQ made a lower low, a positive divergence. MACD continues to rise after breaking the January downtrend (blue dotted line), confirming the start of a potential sustainable rally for the intermediate term (weeks to months).
It is bullish that QQQ had a weekly close above 290.00, and the MACD slope has accelerated. A sign QQQ will continue higher would be MACD above 0 and breaking the September downtrend (purple line).
The Intermediate Trend in MidCaps is up.
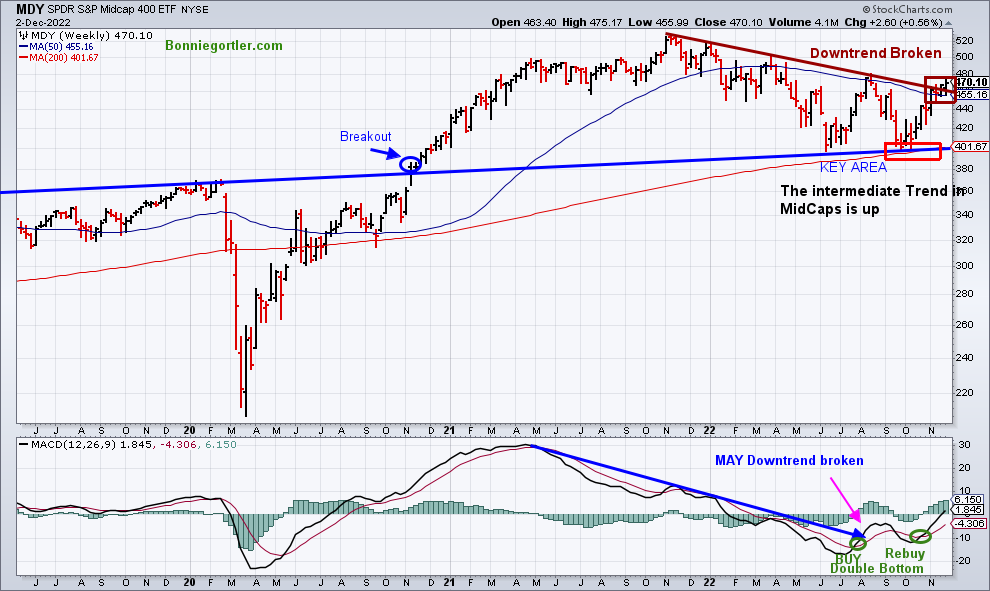
Figure 13: The SPDR S&P MidCap 400 (MDY) Weekly Price (Top) and 12-26-9 MACD (Bottom)
120222 MDY Weekly
Source: Stockcharts.com
The chart above is the weekly SPDR S&P MidCap 400 Index (MDY) ETF.
Its bullish MDY broke its weekly downtrend (green rectangle) from November 2021 (brown line).
MACD remains on a buy, rising and above 0.
The intermediate trend implies higher prices ahead.
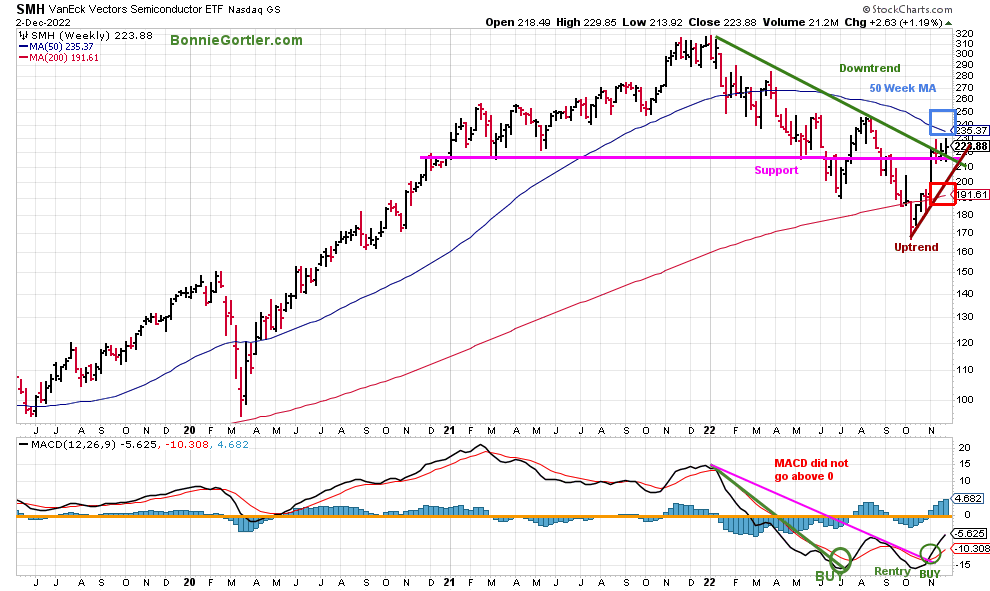
Figure 14: VanEck Vectors Semiconductor Weekly (Top) and 12-26-9 MACD (Bottom)
120222 SMH Weekly
Source: Stockcharts.com
The top part chart shows the Van Eck Vectors Semiconductor (SMH) concentrated, mostly US-based ETF of mega-cap semiconductors companies. SMH is a lead indicator for the market when investors are willing to take on increased risk and the opposite when the market is falling.
Semiconductors (SMH) remained strong, closing above its weekly 2022 downtrend (green line), up +1.19%, closing at 223.88.
SMH shows signs of underlying strength closing above its 200-Week MA, indicating strength if SMH closes above the 50-Week MA, which closed at 235.37.
Support is at 210.00 and 190.00, while resistance remains at 230.00, 235.00, and 240.00.
Its bullish MACD (lower chart) is on a buy, rising, clearly breaking the 2022 downtrend (pink line), showing positive momentum.
The short-term remains extended, implying SMH may consolidate, but the intermediate-term has improved. For further gains, SMH needs to hold a weekly close above 210.00.
On the other hand, a weekly close below 210 would imply a pullback to 190.00.
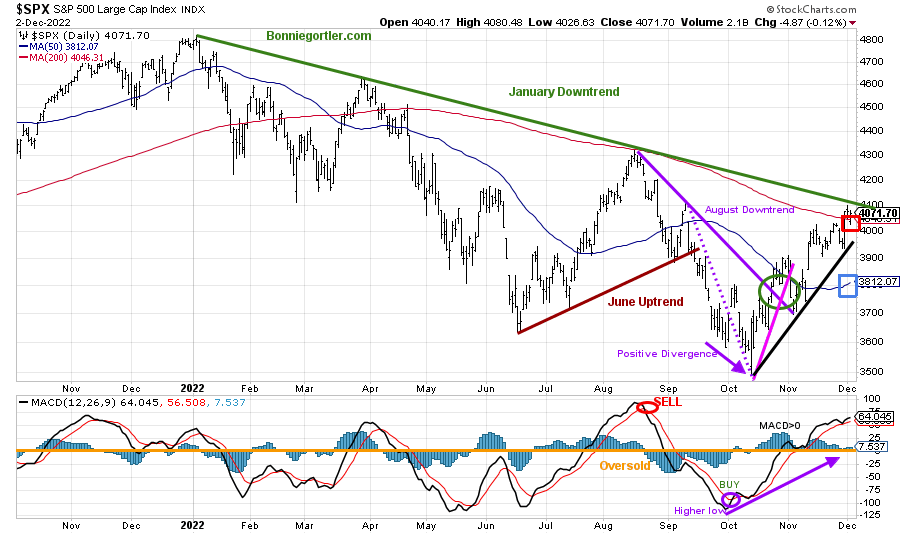
Figure 15: The S&P 500 Index ($SPX) Daily (Top) and 12-26-9 MACD (Bottom)
120222 SPX Daily
Source: Stockcharts.com
The S&P 500 (SPX) 2022 downtrend remains in effect (green line) but is close to being broken.
After holding above support on the pullback at 3700.00 in early November, SPX has rallied over 400 points.
Last week, the S&P 500 (SPX) rose +1.13%, closing at 4071.70, closing above its 50-Day Moving Average (blue rectangle) and above the 200-Day Moving Average (red rectangle), which it has been unable to penetrate since April.
Resistance remains at 4100, while support stays at 3900, 3800, and 3700.
MACD, lower chart, remains on a buy, rising and above 0. Be alert to a MACD sell if the SPX weakens in the near term. On the other hand, if SPX breaks above 4100, a rally toward 4300 is possible.
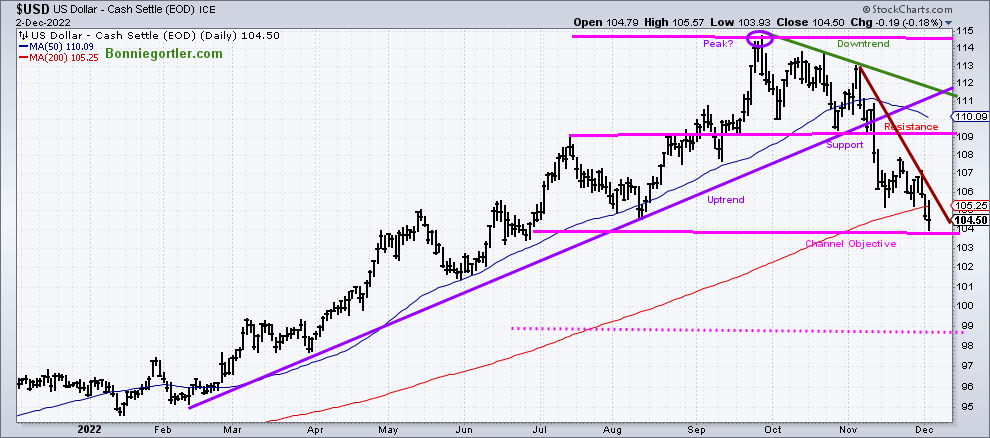
U.S. Dollar weakness continues and is positive for Global and U.S. Equities
Figure 16: U.S. Dollar Daily
120222 USD Daily
Source: Stockcharts.com
The U.S. dollar peaked in September, starting a downtrend that remains in effect (mentioned in the 11/4/22 market update).
The U.S. dollar fell -1.34 %, just above the 103.80 downside objective, closing near its low for the week. A close below 103.80 will give a new downside objective of 98.80. The continued weakness of the U.S. dollar will continue to fuel global and U.S. equities in the coming weeks.
On the other hand, a close above 106.00 would imply a rally toward 109.00 is possible.
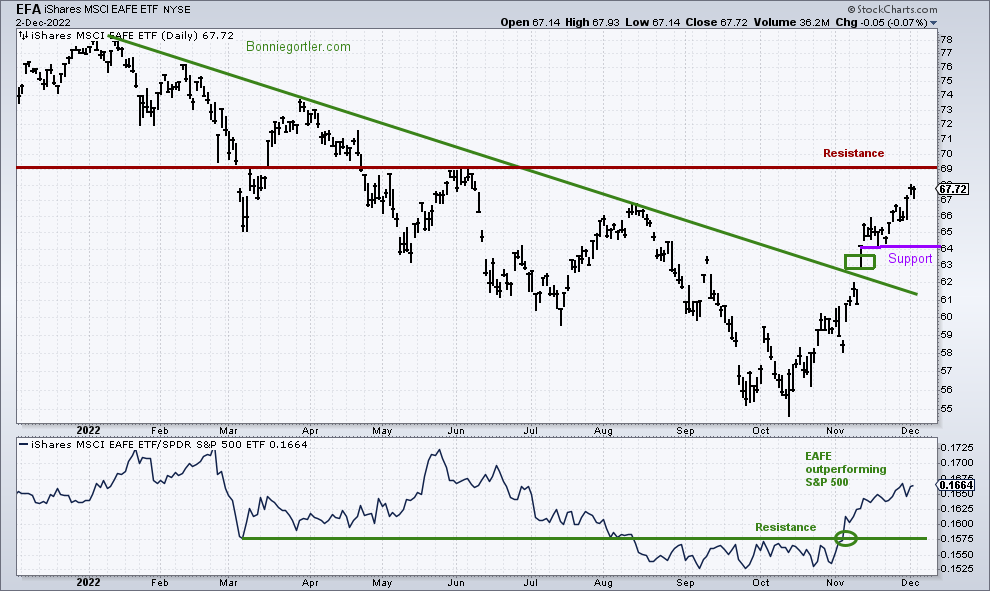
Figure 17: EFA iShares MSCI EAFE Daily (Top) and Relative Strength Ratio S&P 500 EFA/SPY
120222 EFA Daily
Source: Stockcharts.com
The top chart is EFA Ishares MSCI ETF, a broad market index of stocks located within countries in Europe, Australasia, and the Middle East. It includes Large and Mid-cap stocks across Developed Markets countries worldwide, excluding the US and Canada.
EFA broke the 2022 downtrend (green rectangle) on 11/10/22 and has continued higher. Support is at 64.00, followed by 61.00.
The bottom chart is the relative strength ratio of EFA/SPY. EFA is stronger than the S&P 500, which helps international stocks, which have lagged U.S. equities for over a decade. Global markets rising have helped retirement plans with a high percentage allocated in the last few months.
Strength in Emerging Markets
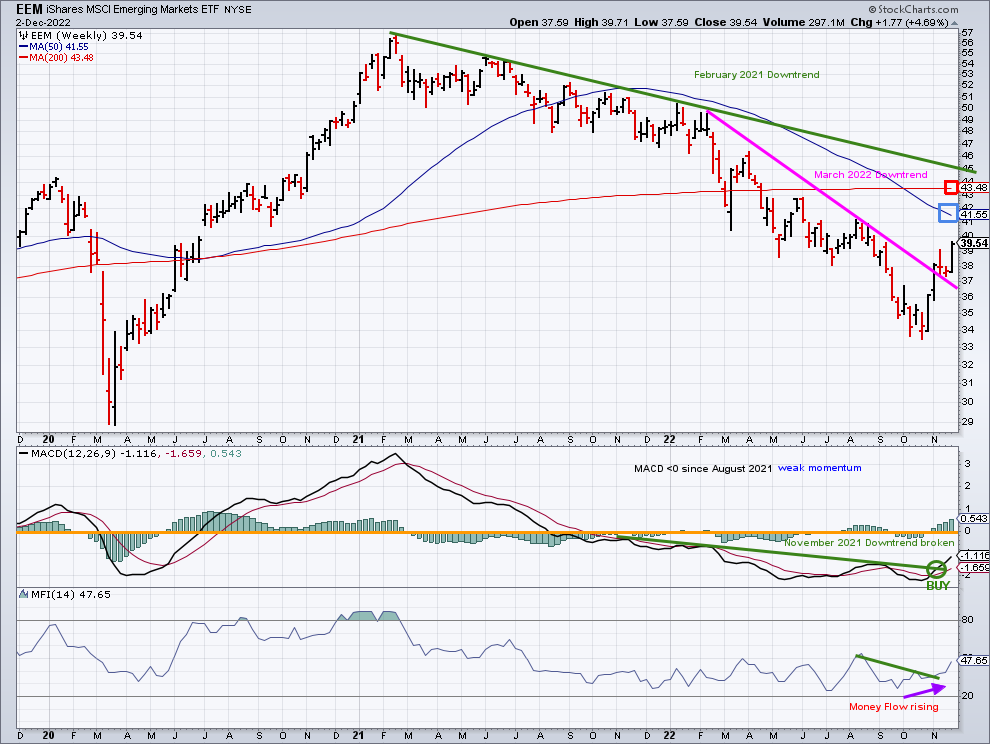
Figure 18: Emerging Markets (EEM) Weekly Price (Top) and 12-26-9 MACD (Middle) and Money Flow (Bottom)
120222 EEM Weekly
Source: Stockcharts.com
The top chart shows the weekly Emerging Markets (EEM) broke the February downtrend (pink line) and is gaining strength, getting closer to the 50-Week MA (blue rectangle) and the 200-WK MA (red rectangle). A close above would indicate internal strength.
The middle chart shows the downside momentum in MACD since November 2021 has slowed, and the downtrend has broken after its recent buy (green circle).
The bottom chart Money Flow has been rising since late September, implying money has started flowing into Emerging Markets.
It’s too early to know if the rise is sustainable or if this will be another failed attempt.
Note: EEM is the most oversold based on monthly MACD and Money Flow since 2016 and 2009.
Watch the direction of HYG and AAPL for a clue to next week’s market direction.
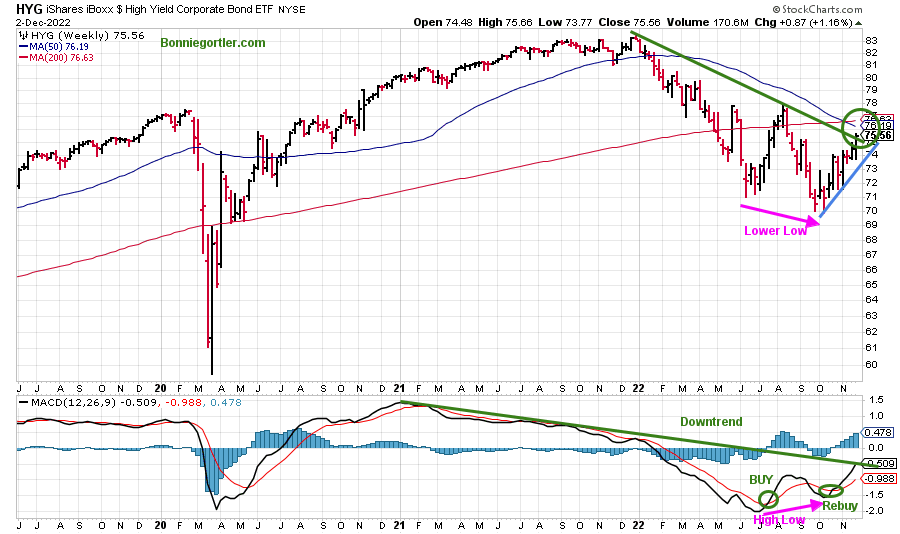
Figure 19: I Shares Hi Yield Corporate Bond (HYG) (Top), and 12-26-9 MACD (Bottom)
120222 HYG Weekly
Source: Stockcharts.com
Investors have been willing to take on risk since the bottom in October, buying Hi-Yield Bonds (HYG), which have been in a downtrend in 2022.
Support is at 73.00, and resistance is at 77.00.
MACD (lower chart) is on a buy signal. Continued strength in HYG breaking the downtrend in both price and MACD would be bullish for Equities and High Yield bonds.
Keep an eye on HYG to see if it continues to rise, breaking the downtrend (green line), or begins to fall and break the recent (uptrend blue line).
Improvement in the technical indicators for APPLE (AAPL)
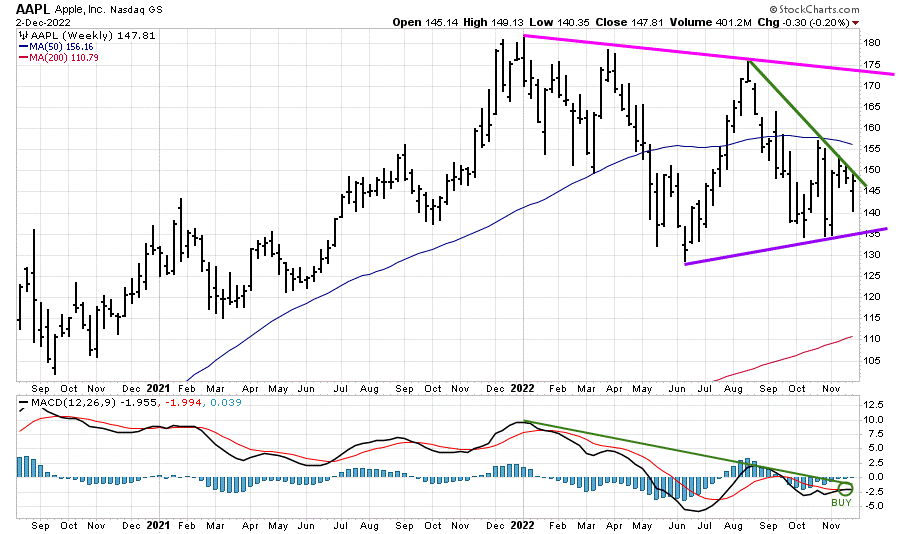
Figure 20: APPLE Inc. (AAPL) Weekly (Top), and 12-26-9 MACD (Bottom)
120222 AAPL Daily
Source: Stockcharts.com
Last week, Apple (AAPL), the biggest holding in QQQ, fell -0.20% for the week remaining in a weekly downtrend and closing below its 50 200-Week Moving Average.
Its positive AAPL closed near its highs for the week and is now threatening to break the downtrend from August (green line).
MACD, a measure of momentum (lower chart), is now on a buy,
It appears AAPL successfully tested the June lows, and if AAPL closes above 155.00, it’s likely to attract more buying. On the other hand, a close below 125.00 would negate my positive outlook and likely put pressure on the broad market.
Speculative BUY
Figure 21: SPDR Consumer Discretionary (XLY) (Top), and 12-26-9 MACD (Bottom)
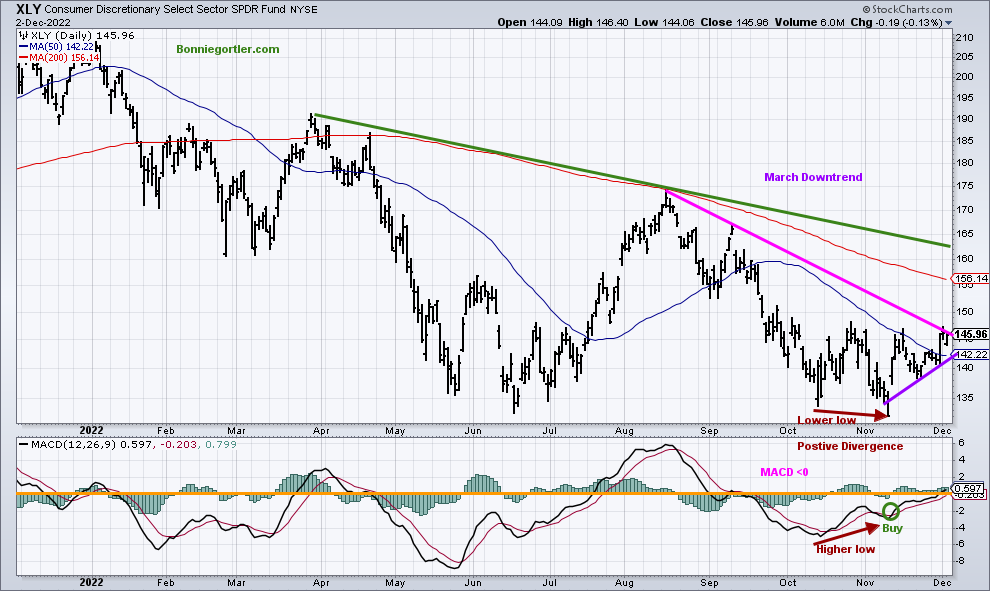
120222 XLY Daily
The SPDR Consumer Discretionary (XLY) appears ready to break its downtrend from August.
XLY top holdings are Amazon (AMZN) at 20.07% and Tesla Inc. (TSLA) at 18.43%, A rally in AMZN and TSLA will fuel XLY higher.
A close below 135.00 will negative the speculative buy.
Summing Up:
The intermediate technical patterns are favorable. Price and momentum have turned up in Nasdaq, MidCap 600, and Emerging Markets implying further gains are likely over the next several weeks to months. Keep an eye on market breadth on the NYSE and Nasdaq for an expansion of new highs and contracting New Lows. Watch the direction of High Yield Bonds (HYG) and Apple (AAPL) for next week’s market direction. Continue to give the benefit of the doubt to the bulls.
Remember to manage your risk, and your wealth will grow.
If you liked this article, you will love my Free Grow and Sustain Your Wealth Report. Get it here:
Do you like charts, I invite you to my FB group Wealth Through Market Charts or email me at Bonnie@Bonniegortler.com.
I would love to hear from you. If you have any questions or comments or would like to talk about the market, click here.
Disclaimer: Although the information is made with a sincere effort for accuracy, it is not guaranteed that the information provided is a statement of fact. Nor can we guarantee the results of following any of the recommendations made herein. Readers are encouraged to meet with their own advisors to consider the suitability of investments for their own particular situations and for determination of their own risk levels. Past performance does not guarantee any future results.


Create more wealth in your life
with these simple strategies.
As an added bonus you will also
receive BG’s Updates and Ezine

Discover how to quickly create more well-being in your life with these simple strategies.
As an added bonus you will also
receive BG’s Updates and Ezine

As an added bonus you will receive BG’s Updates and Ezine

All work listed on BonnieGortler.com is licensed under a Creative Commons Attribution - Noncommercial - No Derivative Works 3.0 Unported License.


Free Report:
Grow and Sustain Your Wealth
Discover how to grow your money with these easy, simple steps.

