


10 Simple Tips for Financial Well-Being
07/01/2026
Stocks rallied sharply to end the week strong. Eight sectors rose, seven stronger than the SPDR S&P 500 ETF Trust (SPY) up +0.81%, HealthCare (XLV) and RealEstate (XLRE) were the strongest sectors, while Financial (XLF) and Consumer Discretionary (XLE) were the weakest.
2/18/22 – 2/25/22
S&P SPDR Sector ETFs Performance Summary
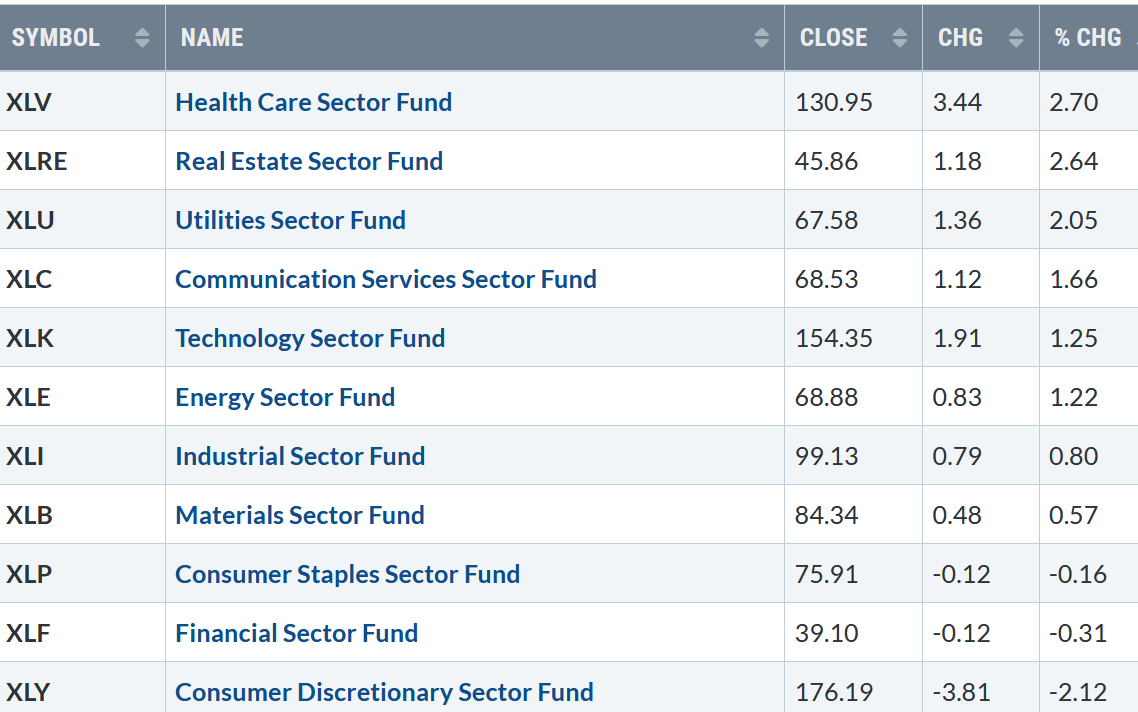
022522 SPDR SectorsSource: Stockcharts.com
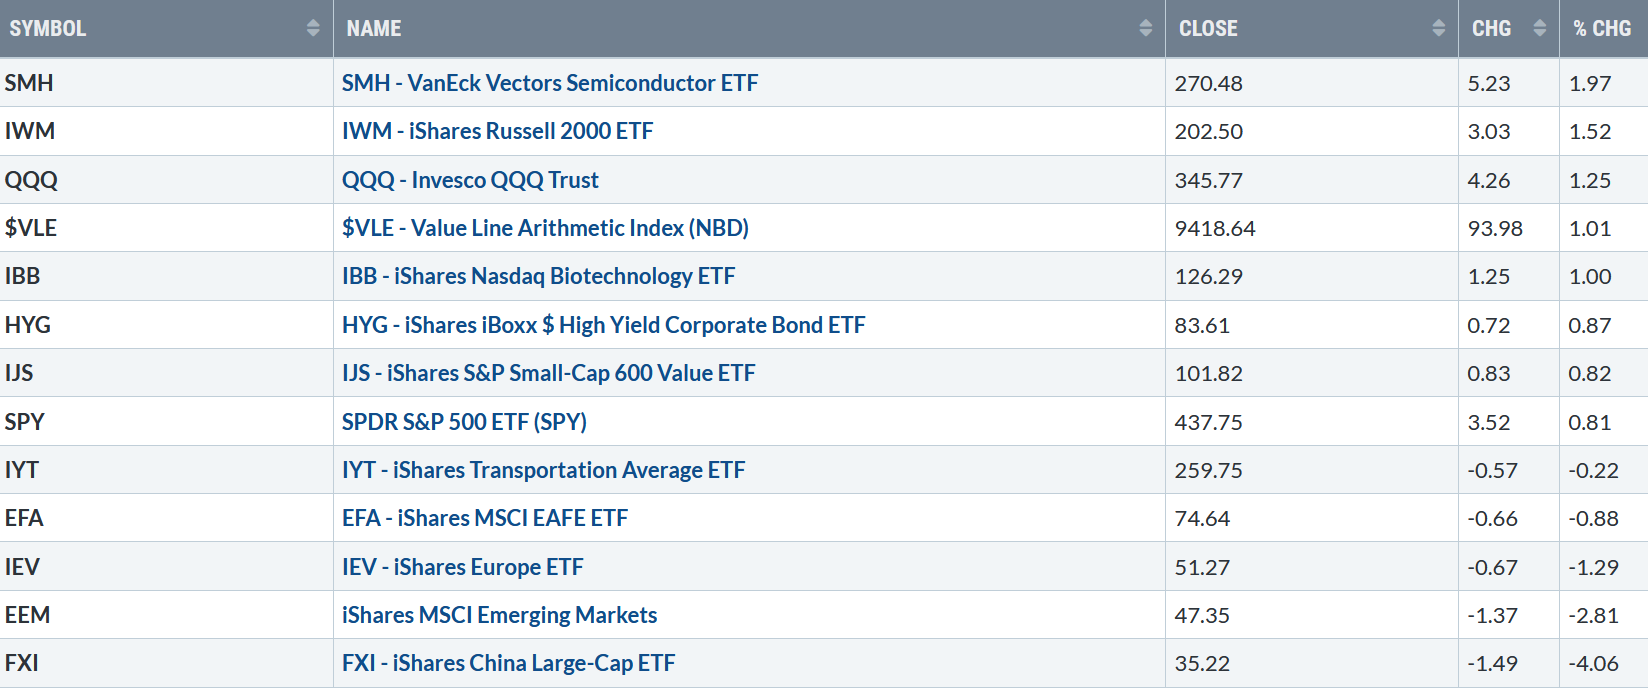
Figure 2: Bonnie’s Mix of ETFs To Monitor
Performance Summary 2/18/22 – 2/25/22
022522 Week ETFs
Source: Stockcharts.com
Investors early in the week sold stocks at any price as geopolitical risks heightened between Ukraine and Russia. However, by the end of the week, shorts began to cover, taking advantage of the opportunity to buy stocks at a discount. Semiconductors, Small Caps, and Technology led while the global markets lagged.
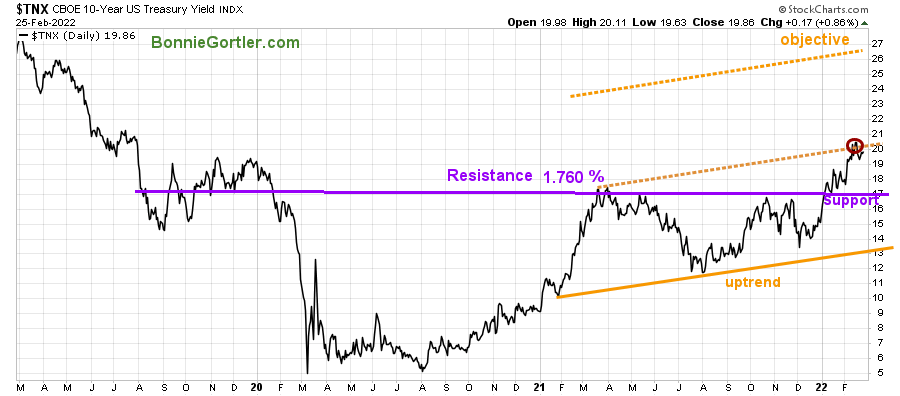
The 10-Year U.S. Treasury yields rose last week, closing below 2% at 1.986%. The upside channel objective remains at 2.7% if rates continue to increase, and if they fall, the lower channel objective is 1.3%
Figure 3: UST 10YR Bond Yields Daily
22522 UST 10YR Bond Yields Daily
Source: Stockcharts.com
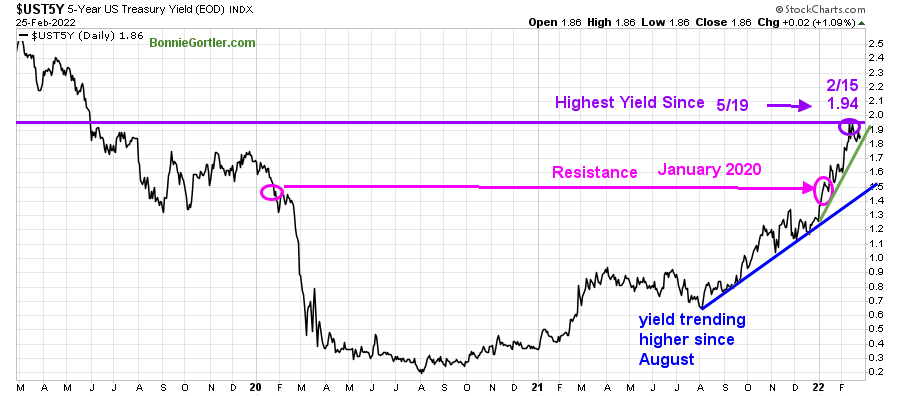
Figure 4: UST 5YR Bond Yields Daily
22522 UST 5YR Bond Yields Daily
Source: Stockcharts.com
5-Year U.S. Treasury yields rose, closing at 1.86% but below the 2/15 high and now threatening to break below the 2022 uptrend (green line).
The Dow fell -0.06% for the week, S&P 500 gained +0.53%, while Nasdaq rose +1.08%. The Russell 2000 Index gained +1.57%, and the Value Line Arithmetic Index (a mix of approximately 1700 stocks rose +1.01 %.
Weekly market breadth remains negative. The New York Stock Exchange Index (NYSE) had 1751 advances and 1822 declines. The Nasdaq had 2448 advances and 2779 declines. There were 86 New Highs and 947 New Lows on the NYSE and 117 New Highs, and 1648 New Lows on the Nasdaq. For a sustainable rally, market breadth needs to improve substantially.
Figure 5: CBOE Volatility Index VIX
22522 DAILY VIX
Source: Stockcharts.com
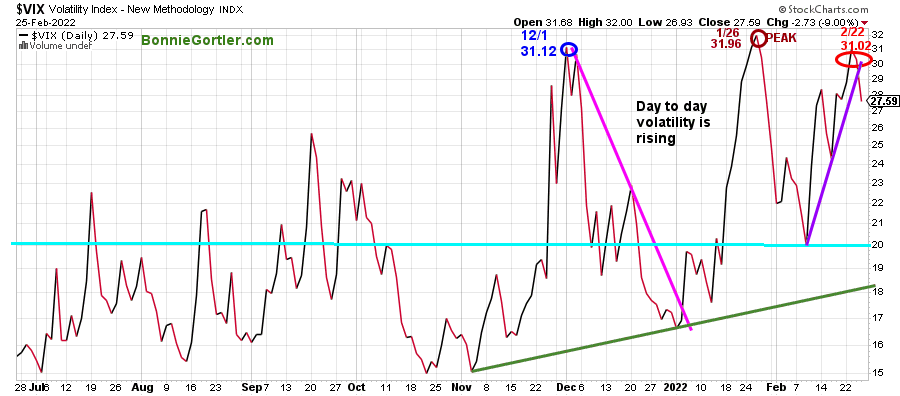
The CBOE Volatility Index ($VIX), a measure of fear, has been above average in 2022.
VIX peaked at 31.96 on 1/26 (brown circle). The decline last week VIX stayed below the 2/22 high of 31.02 (red circle a positive sign the bottom is in for the short-term
When all was said and done, VIX closed up slightly at 27.59, closing below the February uptrend (purple line), short-term favorable, and the first sign of volatility beginning to quiet. I would like to see $VIX continue to fall this week, closing below 24.00 for the rise to confirm the rally is more than only a short-term bounce, ultimately staying in a trading range between 18.00 and 20.00 for the new few months.
Figure 6: Daily New York Stock Exchange (NYSE) New Lows
22522 Daily NYSE NEW LOWS
Source: Stockcharts.com
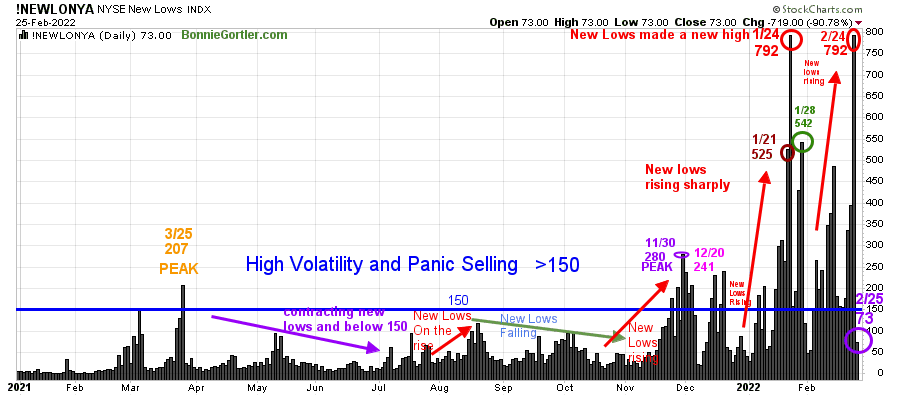
Watching New lows on the New York Stock Exchange is a simple technical tool that helps awareness about the immediate trend’s direction.
New lows warned of a potential sharp pullback, high volatility, and “panic selling” for most of 2022, closing above 150. Learn more about the significance of New Lows in my book, Journey to Wealth, published on Amazon. Here is an excerpt, When new lows are above 150, the market is negative, higher risk, selling is taking place. Sometimes it could be severe, and sometimes on a very nasty day, you can have “panic selling,” and big wild swings (high volatility) to the downside may occur.
As the market sold off in January, New Lows rose sharply, peaking at 792 (red circle) on 1/24. New Lows narrowed to 542 (green circle) on 1/28 and began contracting but not enough to be in a safe, low-risk zone.
On 2/24, New lows jumped to 792, matching the 1/24 peak, but with the sharp upside reversal, New Lows quickly contracted on 2/25, closing at 73 (purple circle), the lowest reading since 2/2 dropping below 150, a hopeful sign the worst is over.
It would be positive for the short-term if News Lows contracts below 150 for at least two days and then ultimately falls to between 25 and 50, indicating lower risk.
Figure 7: Daily Nasdaq Advance-Decline Line
22622 Nasdaq Daily AD Line
Source: Stockcharts.com
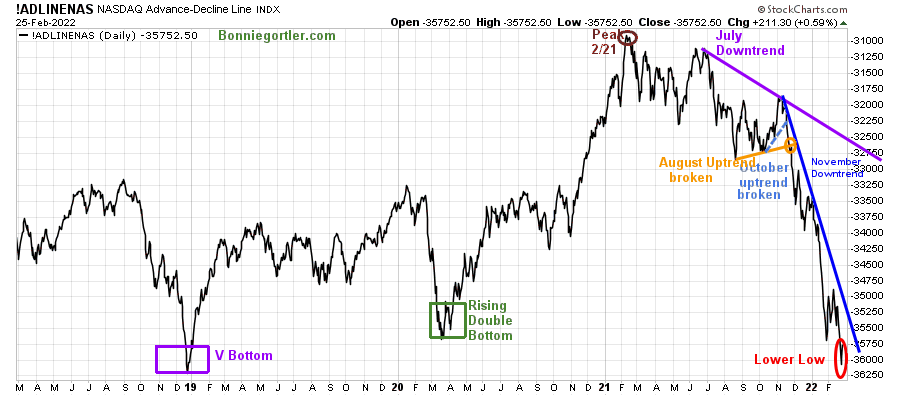
Market breadth on the Nasdaq remains in a downtrend in 2022. The daily Nasdaq AD-Line peaked in February 2021 (brown circle), followed by failed attempts to make a new high.
After breaking the October uptrend (blue dotted line), the AD-Line made a series of lower highs and lower lows in November, December, and January. Two clear-down trends (blue and purple) remain in effect.
A double bottom pattern potentially making a higher low similar to March 2020 (green rectangle) was developing last week. However, there was insufficient strength, and the AD-Line made a lower low, potentially forming a V bottom similar to December 2019 (purple rectangle).
It would be positive if there are more advances than declines this week and the AD-line turns up breaking the November downtrend (blue line). It would be the first confirmation that a potential short-term bottom has been made.
On the other hand, if last week’s rally fails and there is more near-term weakness in market breadth, a deeper correction could occur over the next several weeks.
Figure 8: Weekly Nasdaq Advance-Decline Line
22522 Nasdaq Weekly AD Line
Source: Stockcharts.com
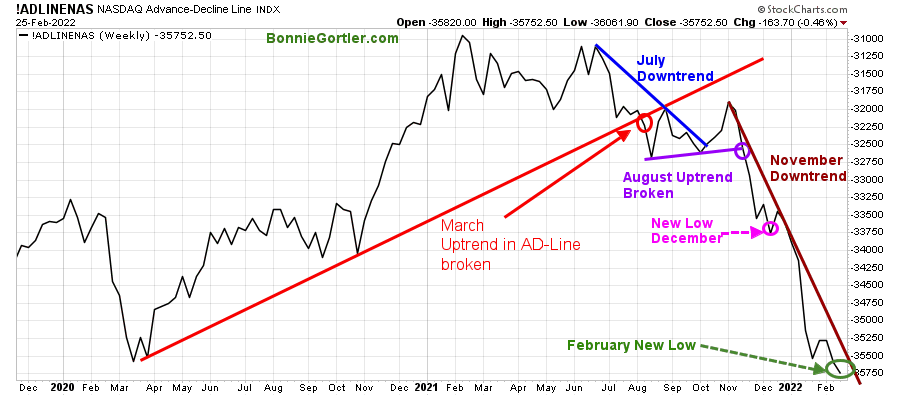
After breaking down in August last year, the Nasdaq Weekly AD-Line made a few attempts to form a bottom but failed, continuing to make lower lows.
Although Nasdaq rose in price last week, the Nasdaq weekly AD-Line made another new low and could not break the November downtrend implying the risk of further selling remains possible.
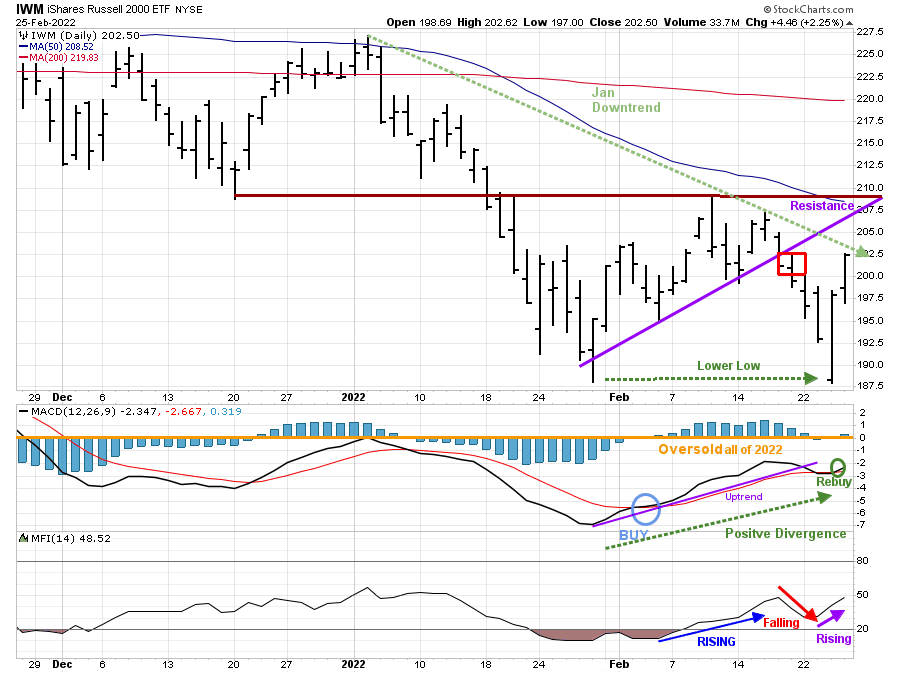
Figure 9: Daily iShares Russell 2000 (IWM) Price (Top) and 12-26-9 MACD (Middle) and Money Flow (Bottom)
22522 DAILY IWM
Source: Stockcharts.com
The top portion of the chart is the daily iShares Russell 2000 Index ETF (IWM), the benchmark for small-cap stocks, with a 50-Day Moving Average (MA) (blue line) and 200-Day Moving Average (MA), that traders watch and use to define trends. A false breakout occurred in November 2021 in IWM after being in a nine-month trading range.
The February uptrend and support at 200.00 was penetrated on 2/18 (red rectangle) and remained below its 50 and 200-Day Moving Average. Last week the decline accelerated through support at 195.00 and 190.00, slightly penetrating the January low followed by a sharp reversal to the upside, closing near the high for the week at 202.50, up 1.52%, slightly below the January downtrend (green line).
Short-term resistance is 205.00, 207.50, and 210.00. A close above 210.00 would likely confirm a potential big move to the upside that is sustainable. On the other hand, if IWM reverses to the downside and closes below 197.00, IWM could fall quickly to 187.00 and then potentially the short-term downside objective at 178.00.
MACD (middle chart) has not shown much upside momentum in 2022, failing to get above 0, but the MACD pattern is promising. A bullish positive divergence has formed and a rebuy. IWM made a lower low, with MACD making a higher low.
Money Flow (lower chart) rose in early February but then turned down (red arrow). Notice last week Money Flow is now rising (purple arrow) and closed at its highest level since January.
In Sum:
Downside momentum appears to have slowed. A positive divergence has formed, one of the most bullish MACD patterns. Yet, more time is needed to see if IWM will break the January downtrend and if upside momentum will begin to accelerate to confirm the next upside move in small caps.
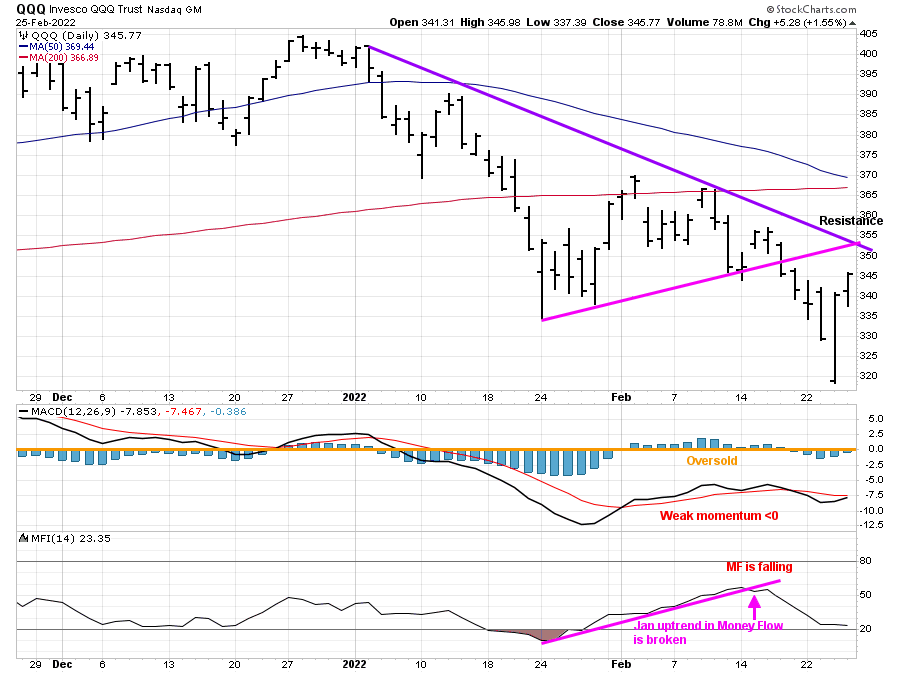
Figure 10: Daily Invesco QQQ Trust (QQQ) Price (Top), and 12-26-9 MACD (Bottom)
22522 QQQ Daily
Source: Stockcharts.com
The chart shows the daily Invesco QQQ, an exchange-traded fund based on the Nasdaq 100 Index with its 50-Day Moving Average and 200-Day Moving Average.
The decline accelerated after breaking the January uptrend last week (pink rectangle), penetrating the January lows and falling through the first downside objective at 330.00, not reaching the lower objective of 310.00 before reversing higher.
QQQ closed near their high of the week up +1.25% at 345.77 but remained below its 50 and 200 Day MA.
Resistance is at 351.00, followed by 355.00 and 370.00. A close above 350.00 would be positive and likely cause short covering.
Support is at 337.00, 335.00, and 320.00. A close below 337.00 is likely to imply another test of the February low.
The lower chart is MACD (12, 26, 9), a measure of momentum. MACD is on a buy, falling below 0, and did not have enough upside momentum to reach 0, implying no underlying strength. This time may be different because a potential positive divergence has formed. Further rise in QQQ would generate a repeat buy in MACD.
Money Flow is no longer falling and has begun to flatten after breaking the December uptrend,
Be alert to a shift of trend from down to up if QQQ closes above 351.00 and MACD generates a reentry buy and money flow turns up.
Intermediate-Term Trend Remains Down: Downside QQQ objective hit on 2/22
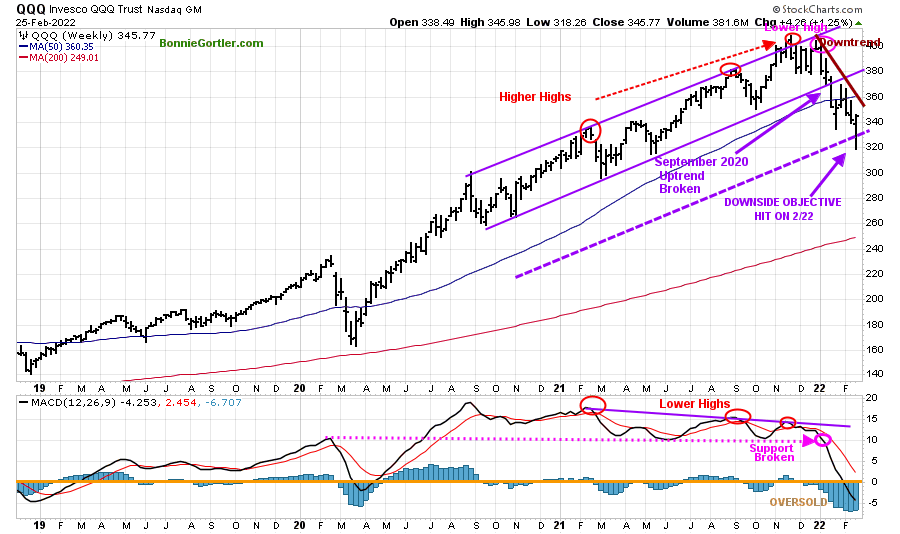
Figure 11: Weekly Invesco QQQ Trust (QQQ) Price (Top), and 12-26-9 MACD (Bottom)
22522 QQQ Weekly
Source: Stockcharts.com
The top chart shows the weekly Invesco QQQ Trust (QQQ) making higher highs peaking in November 2021 (red circles) but failed to make a new high in December and then turned down.
The September 2020 uptrend broke down four weeks ago (middle purple line), giving a downside objective to 325.00 (lower channel).
MACD (lower chart) remains on a sell after making lower highs and breaking below support held since February 2020 (pink dotted line), implying weak underlying momentum, which is precisely what transpired.
MACD is oversold, falling, and below 0. Be alert for downside momentum to subside, and MACD begins to flatten and turn up, generating a new buy.
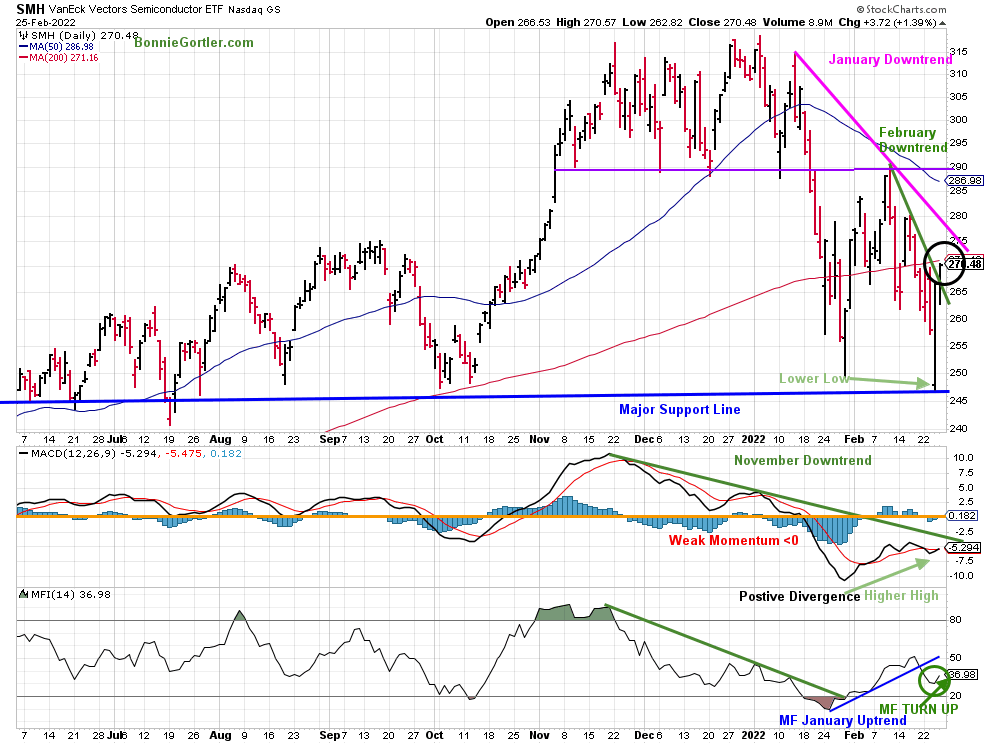
Figure 12: Van Eck Semiconductors (SMH) Daily Price (Top), 12-26-9 MACD (Middle) and, Money Flow (Bottom)
22522 SMH Daily
Source: Stockcharts.com
Semiconductors (SMH) broke through resistance in October (green arrow) and surged higher until late November. SMH stalled, followed by a trading range. Support was broken in late January, and SMH fell sharply and has been highly volatile.
There were two significant downtrends in effect: January (pink line) and February (green line).
SMH broke the February downtrend trendline Friday, 2/25, which is bullish for the short term. To confirm the trend change to positive, SMH needs to close above 280.00, breaking the January downtrend.
Resistance is at 280.00, followed by 290.00 and 310.00. Support is at 265.00 and 255.00, followed by 246.00.
MACD (middle chart) generated a buy (green circle) from an extremely oversold level implying the worst of the decline was over. Waiting for a confirmation of MACD to break the November downtrend (green line) could happen this week along with the positive divergence and turn up in money flow (lower chart).
If SMH closes below 246.00, then my bullish optimism would be negated.
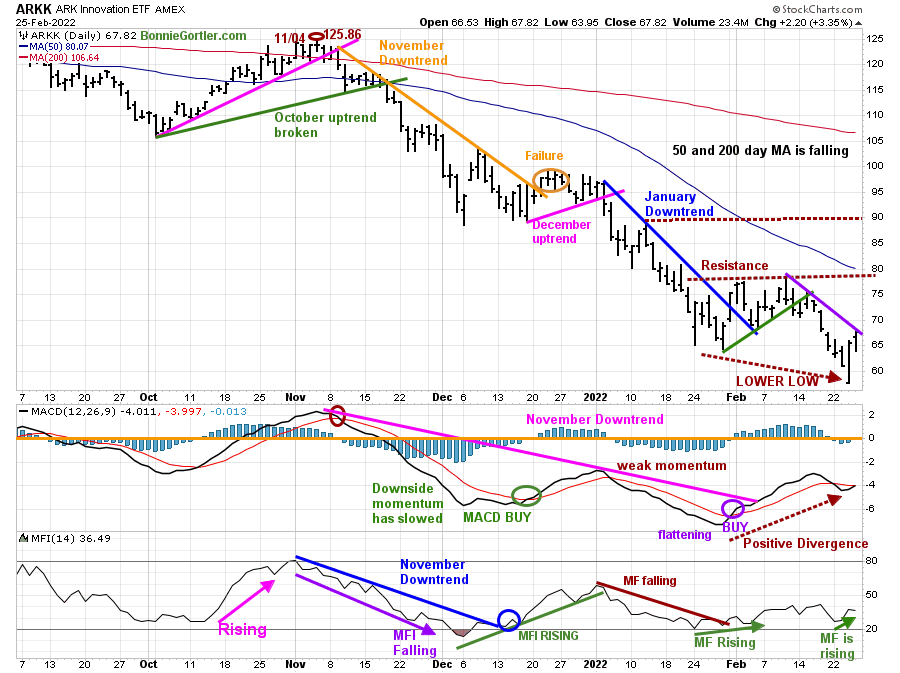
Figure 13: Daily ARK Innovation (ARKK)
22522 ARKK Daily
Source: Stockcharts.com
ARK Innovation (ARKK) is an actively managed ETF by Cathie Wood that seeks long-term growth and is highly volatile. ARKK broke its September short-term downtrend (brown line) in October 2021, followed by a failed rally peaking at 125.86 on 11/04/21. Once ARKK fell below support at 94.00, it broke through the December uptrend (pink line) and accelerated lower.
The downside momentum in ARKK subsided as investors dumped growth stocks early in the week. After falling below support at 60 intraday on Thursday, ARKK closed higher and then rallied on Friday, closing at its high for the week at 67.82, up +3.35%.
Resistance is at 72.50, followed by 77.50 and 90.00. Support is at 64.00, followed by 60.00. A close below 60.00 would imply further downside.
MACD remains on a premature buy, where MACD failed to get above 0. MACD is now close to a repeat buy with a clear positive divergence, a bullish pattern.
Money flow (lower chart) is rising. I would like to see Money flow rise above the February high reading ( green dotted line).
ARKK remains high-risk and volatile, with the bulls looking to reestablish control.
Bullish development to watch for a clue for market direction.
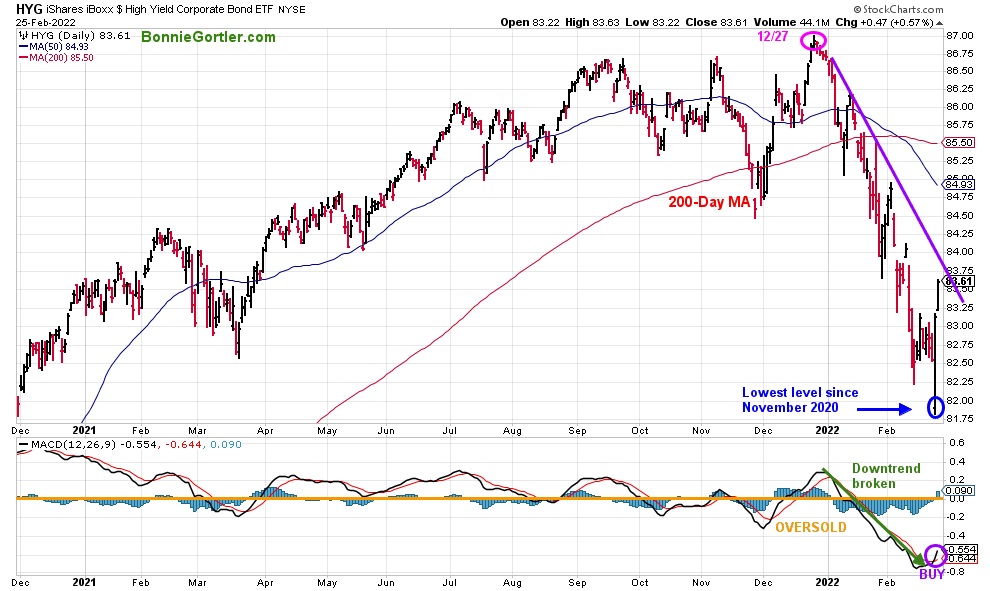
Figure 14: I Shares Hi Yield Corporate Bond (HYG) and 12-26-9 MACD
22522 HYG Daily
After peaking on 11/27/21, Hi-Yield Bonds (HYG) has trended down, falling to their lowest level since November 2020 (blue circle).
It’s bullish that HYG was up 0.87%, reversing from its low to close at its high for the week, and is now close to breaking the 2022 downtrend (purple line).
MACD (bottom chart) generated a buy and penetrated the 2022 downtrend. Continued strength in Hi Yields is favorable for U.S. Equities.
Summing Up:
Investors shifted from risk-off mode to buying stocks despite the uncertainty between Ukraine and Russia. There was a significant upside reversal on Thursday that continued on Friday. A potential bottom is in place. Momentum patterns have improved to support a sustainable advance if Friday’s rally continues to gain momentum through the resistance above. Watch for leadership by Small Caps, Semiconductors, Technology, strength in Hi Yield Bonds, and improvement in market breadth on the NYSE and Nasdaq for confirmation of a new uptrend to begin.
Remember to manage your risk, and your wealth will grow.
If you liked this article, you will love my Free Grow and Sustain your Wealth Report. Get it here:
See more charts. I invite you to my FB group Wealth Through Market Charts.
I would love to hear from you. If you have any questions or comments or would like to talk about the market, click here.
Disclaimer: Although the information is made with a sincere effort for accuracy, it is not guaranteed that the information provided is a statement of fact. Nor can we guarantee the results of following any of the recommendations made herein. Readers are encouraged to meet with their own advisors to consider the suitability of investments for their own particular situations and for determination of their own risk levels. Past performance does not guarantee any future results.


Create more wealth in your life
with these simple strategies.
As an added bonus you will also
receive BG’s Updates and Ezine

Discover how to quickly create more well-being in your life with these simple strategies.
As an added bonus you will also
receive BG’s Updates and Ezine

As an added bonus you will receive BG’s Updates and Ezine

All work listed on BonnieGortler.com is licensed under a Creative Commons Attribution - Noncommercial - No Derivative Works 3.0 Unported License.


Free Report:
Grow and Sustain Your Wealth
Discover how to grow your money with these easy, simple steps.

