

10 Simple Tips for Financial Well-Being
07/01/2026
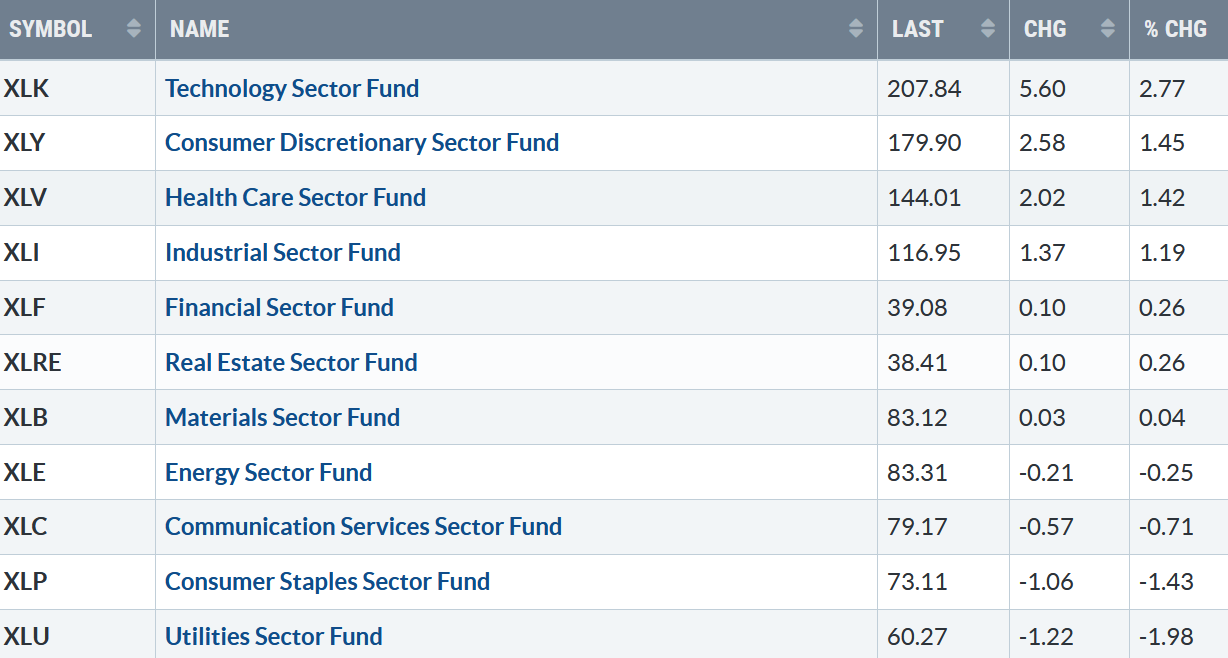
The advance continued, with seven of the eleven S&P SPDR sectors higher last week. Technology (XLK) and Communication Discretionary (XLY) were the best sectors, while Consumer Staples (XLP) and Utilities (XLU) were the weakest. The SPDR S&P 500 ETF Trust (SPY) was up +1.39%.
S&P SPDR Sector ETFs Performance Summary 2/2/24-2/9/24
020924 SPDR Sectors
Source: Stockcharts.com
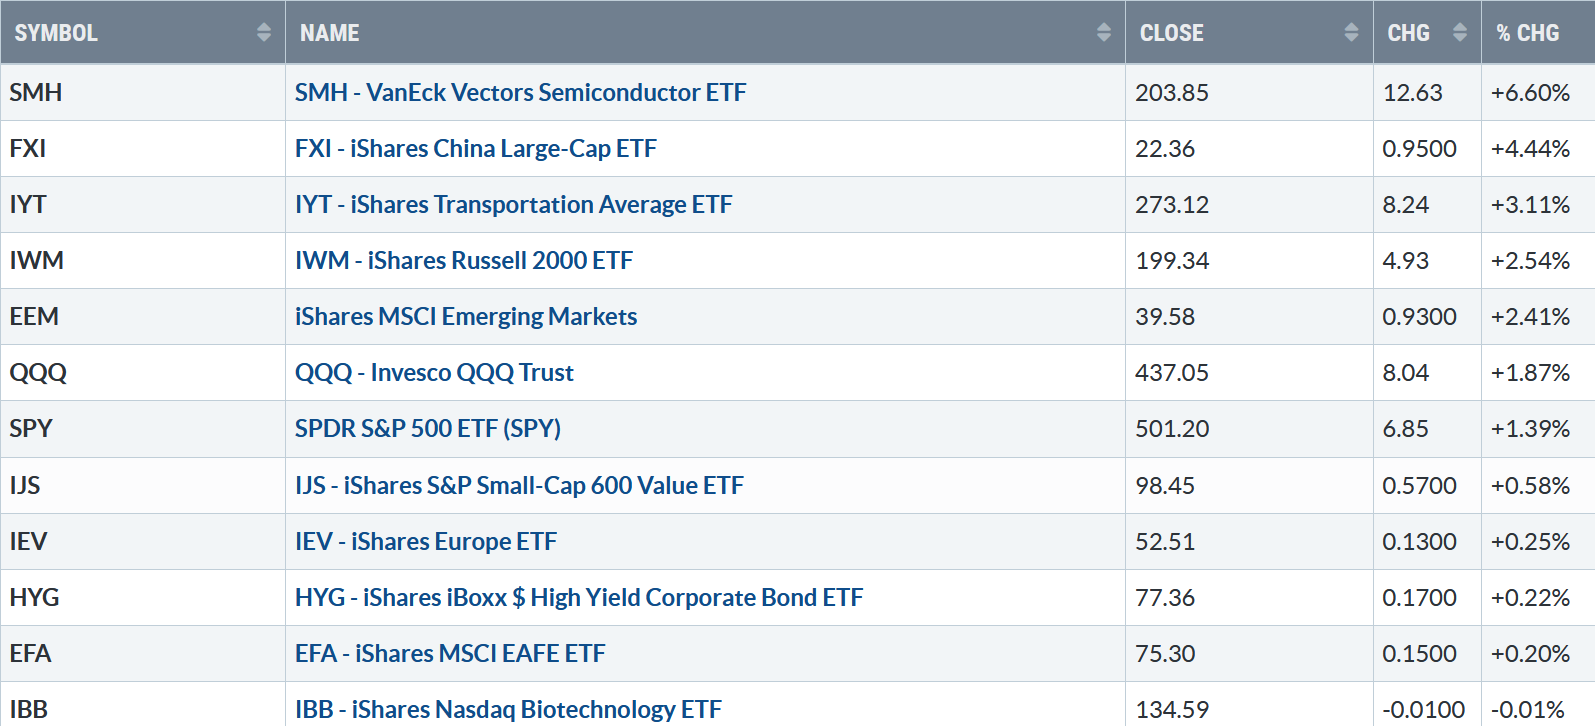
Figure 2: Bonnie’s ETFs Watch List Performance Summary 2/2/24-2/9/24
020924 Week ETFs
Source: Stockcharts.com
Semiconductors led the market higher. China rebounded after several weeks of selling pressure. Transports were leaders, hitting the highest level since November 2021, while Biotechnology lagged.
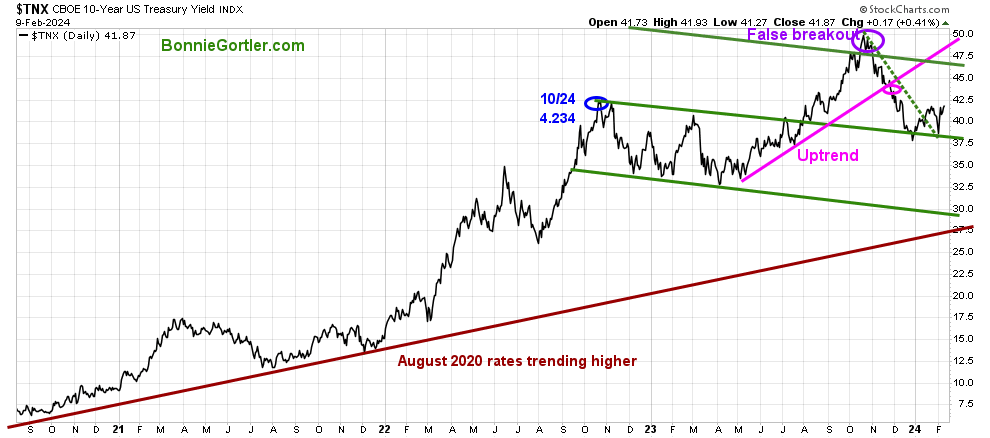
Figure 3: UST 10YR Bond Yields Daily
020924 UST 10 Yr Bond Yields Daily
Source: Stockcharts.com
The 10-year U.S. Treasury rose last week, closing at 4.187%. Rising yields this past week had no negative effect on equities, but if they continue to increase, it could lead to some downside pressure.
The major market averages continued to move higher. The Dow gained +0.04%, the S&P 500 +1.37%, its fifth weekly straight gain of 1% or more, while the Nasdaq gained +2.31%. The Russell 2000 Index was up +2.41%.
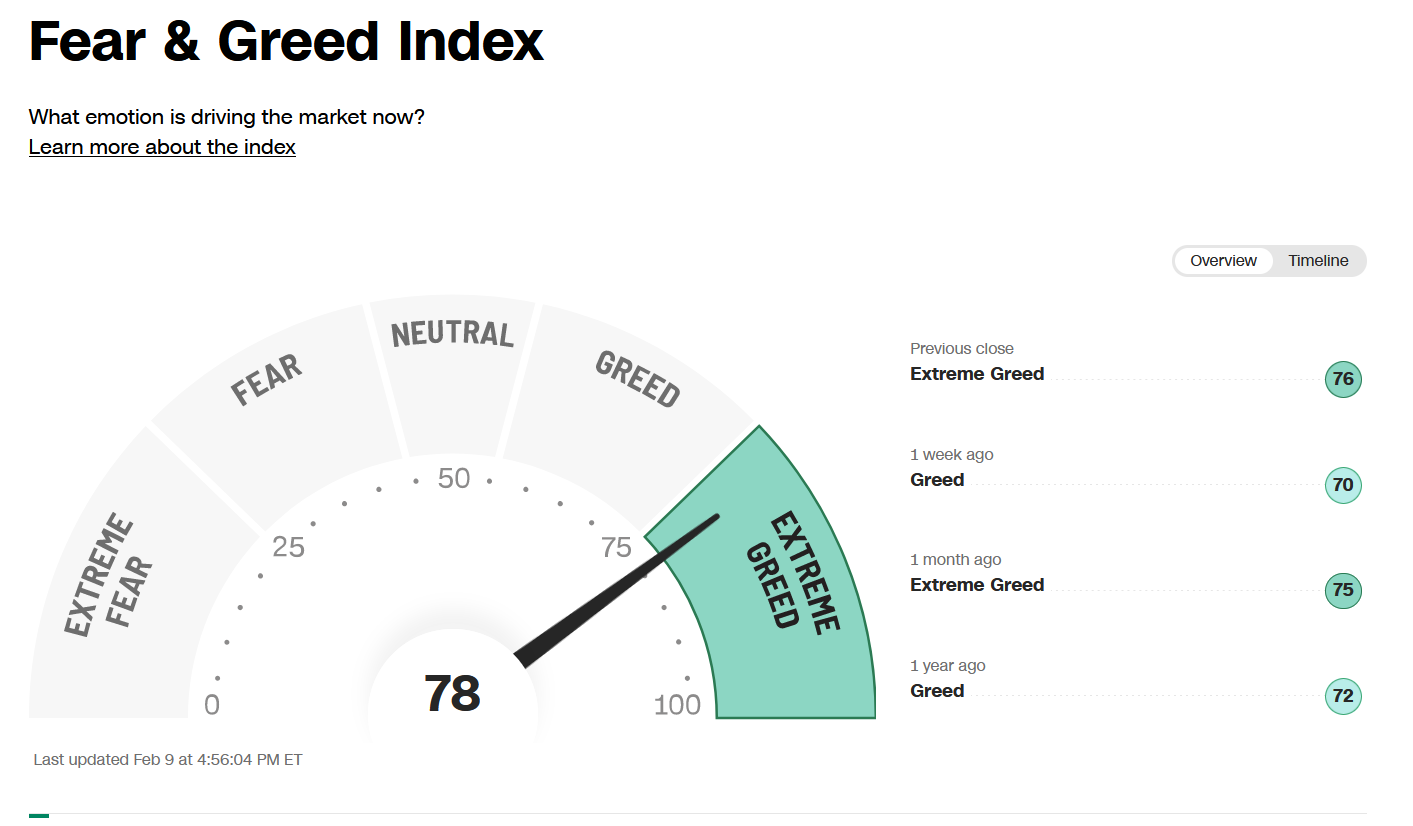
Figure 4: Fear & Greed Index
020924 Fear and Greed
Source. CNN.com
Investor sentiment based on the Fear and Greed Index (a contrarian index) measures the market’s mood. The Fear and Greed Index closed at 78, showing extreme greed, rising from 70 last week. This does not necessarily imply a peak in the market, but better buying risk vs. reward opportunities will lie ahead.
Are you interested in more knowledge about the stock market? Learn how to implement a powerful wealth-building mindset and simple, reliable strategies to help you grow your wealth. Check out my eCourse Wealth Through Investing Made Simple. Learn more here.
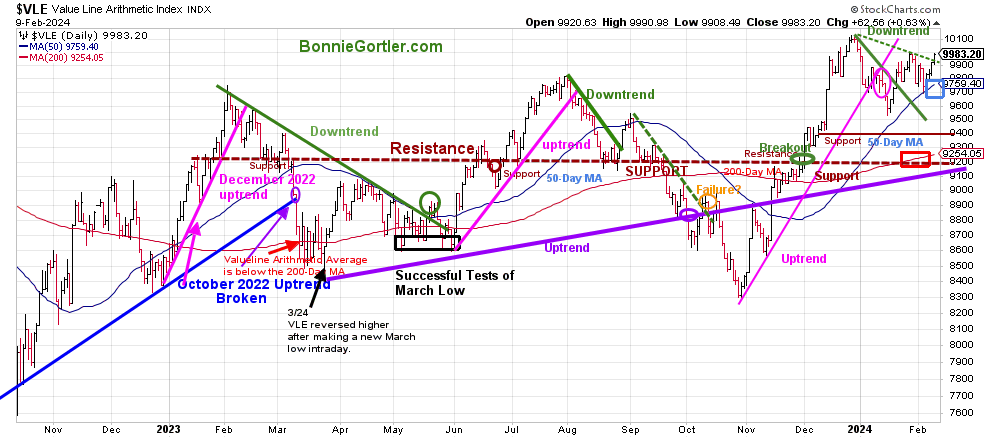
Figure 5: Value Line Arithmetic Average
020924 VLE Daily
Source: Stockcharts.com
The Value Line Arithmetic Index ($VLE) is a mix of approximately 1700 stocks. VLE broke the October 2022 uptrend in early March 2023 (blue line on the left) and April, May, and June. VLE tested the March low before ultimately making a final low in October 2023.
VLE rose +1.10%, breaking the 2024 downtrend, closing at 9983.20, and remaining above the rising 50-day MA (blue rectangle) and the 200-day MA (red rectangle), a sign of underlying strength.
Support remains at 9750, 9400, and 9200. Resistance is at 10000 and 10200.
It will be short-term positive if VLE holds above last week’s low of 9693.79. However, selling pressure will likely increase if VLE breaks below 9750.
Do you want to go deeper into charting? Learn more in the comfort of your home today with my Free 33-minute Training, Charting Strategies to Cut Risk and Trade with the Trend. Sign up here.
Weekly market breadth was positive on the New York Stock Exchange Index (NYSE) and the Nasdaq. The NYSE had 1634 advances and 1290 declines, with 360 new highs and 126 new lows. There were 2667 advances and 1959 declines on the Nasdaq, with 496 new highs and 401 new lows.
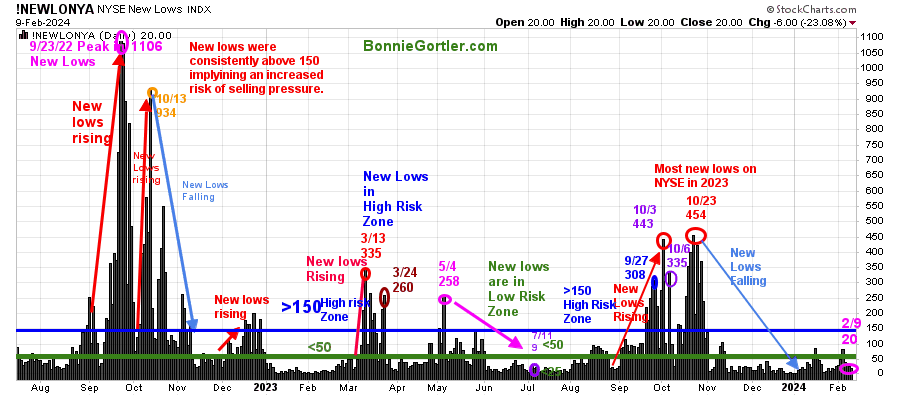
Figure 6: Daily New York Stock Exchange (NYSE) New Lows
020924 NYSE New Lows Daily
Source: Stockcharts.com
Watching New Lows on the New York Stock Exchange is a simple technical tool that helps awareness of the immediate trend’s direction. New lows warned of a potential sharp pullback, high volatility, and “panic selling” for most of 2022, closing above 150. The peak reading of New Lows in 2022 was on 9/23 at 1106, not exceeded in 2023. New lows had stopped accelerating in early October 2023. However, the decline was not complete until the end of the month as New Lows made only a slight new high, peaking at 454 (red circle) on 10/23/23.
Last week, New lows on the NYSE fell, closing at 20 (pink circle), in the lowest-risk zone. It would remain positive and imply low risk if New Lows remain less than 50. On the other hand, an increase above 150 would be a warning sign of a market correction.
Learn more about the significance of New Lows in my book, Journey to Wealth, published on Amazon. If you would like a preview, get a free chapter here.
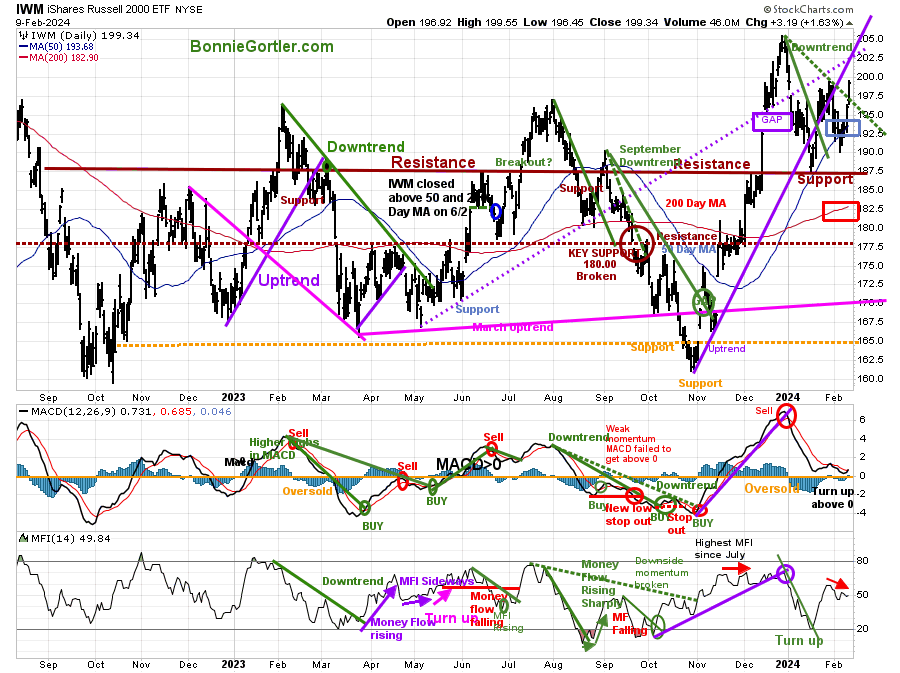
Figure 7: Daily iShares Russell 2000 (IWM) Price (Top) and 12-26-9 MACD (Middle and Money Flow (Bottom)
020924 IWM Daily
Source: Stockcharts.com
The top chart is the daily iShares Russell 2000 Index ETF (IWM), the benchmark for small-cap stocks, with a 50-Day Moving Average (MA) (blue line) and 200-Day Moving Average (MA) (red line) that traders watch and use to define trends. (IWM closed above both).
IWM joined the party, closing at 199.34, up +2.54% last week. IWM broke the January downtrend (green dotted line), changing the short-term trend to up.
IWM closed above the 50-day MA and the 200-day MA (blue rectangle). A close below both MAs would be short-term negative.
Support is at 197.50, 187.50, 182.50, and 177.50. Resistance is at 202.50 and 205.00.
MACD (middle chart) remains on a sell, above 0, but now is rising, which is positive, but not yet oversold, falling below 0 after reaching the highest momentum reading in December 2023.
Money Flow (lower chart) turned up in January enough to break October’s downtrend (green line), but MFI continues to fall, not confirming this past week’s rise.
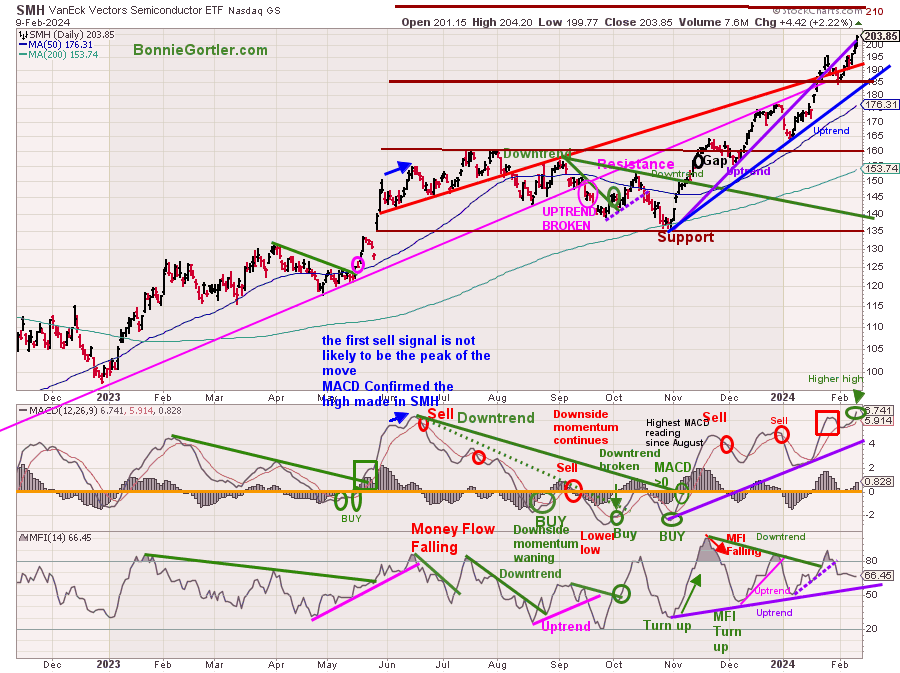
Figure 8: Daily Semiconductors (SMH) (Top) and 12-26-9 MACD (Middle) and Money Flow (Bottom)
020924 SMH Daily
Source: Stockcharts.com
The top chart shows the Daily Semiconductors (SMH) ETF, concentrated mainly in US-based Mega-Cap Semiconductors companies. SMH tends to be a lead indicator for the market when investors are willing to take on increased risk and the opposite when the market is falling.
The Semiconductor ETF (SMH) monster rise continued last week, closing near its highs, up by +6.60%.
Support is at 190.00, 180.00, 175.00, and 160.00. Upside channel objective 210.00.
MACD (middle chart) remains on a sell, giving false sell signals as SMH surges higher.
Money Flow (lower chart) broke below the uptrend (purple dotted line) but continues to hold above the uptrend from November. A break below would be short-term negative.
As long as SMH shows strength, the bulls remain in control despite the money flow weakness and repeat sell signals by MACD.
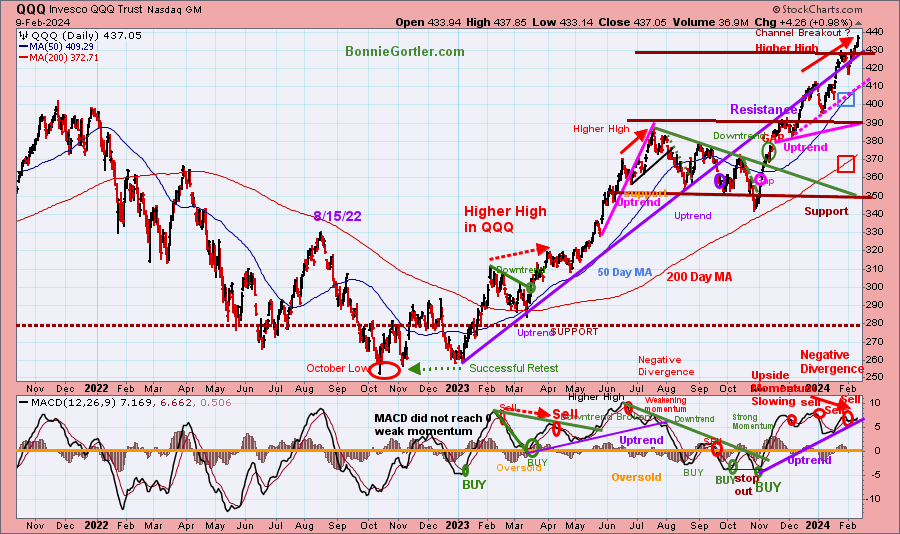
Figure 9: Daily Invesco QQQ Trust (QQQ) Price (Top) and 12-26-9 MACD (Bottom)
020924 QQQ Daily
Source: Stockcharts.com
The chart shows the daily Invesco QQQ, an exchange-traded fund based on the Nasdaq 100 Index. QQQ made a low in October 2022 (red circle), followed by a successful retest of the low in early January 2023 and the start of an uptrend.
Last week, Nasdaq 100 (QQQ) closed at 437.05, at an all-time high of +1.87%. QQQ remains above the rising 50-day Moving Average (blue rectangle) and the 200-day Moving Average (red rectangle), a sign of underlying strength.
QQQ appears to have broken out from its recent channel, giving a new upside objective of 470.00. Time will tell if QQQ has enough strength after the string of gains to power ahead and reach the upper channel or pullback to test the recent breakout.
Support is at 430.00, 416.00, 390.00, 370.00, and 350.00. Two closes below 416.00 will likely lead to short-term selling pressure.
The bottom chart, MACD (12, 26, 9), remains on a sell, above 0, overbought, and falling. The recent negative divergence in MACD has been insignificant with the powerful advance since October.
Are you interested in more knowledge about the stock market? Learn how to implement a powerful wealth-building mindset and simple, reliable strategies to help you grow your wealth in my eCourse Wealth Through Investing Made Simple. Learn more here:
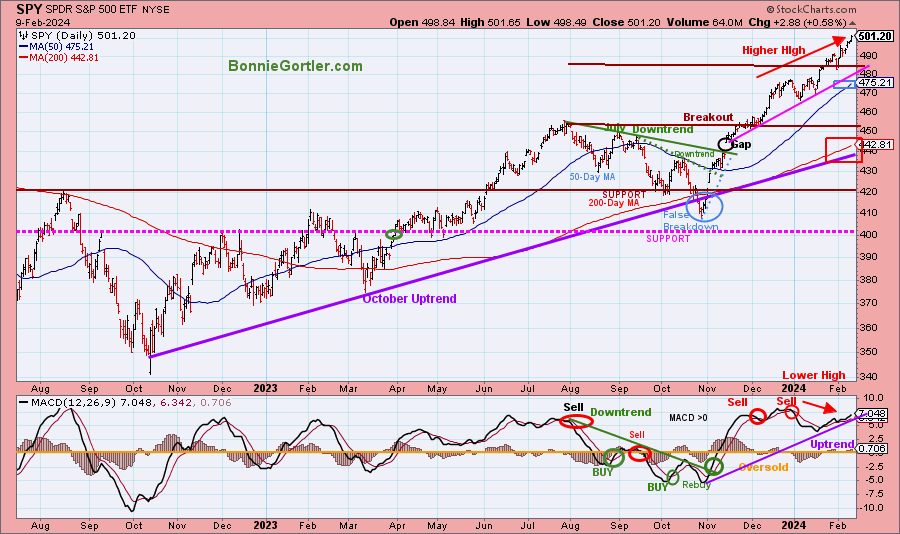
Figure 10: The S&P 500 Index (SPY) Daily (Top) and 12-26-9 MACD (Bottom)
020924 SPY Daily
Source: Stockcharts.com
The S&P 500 (SPY) had a false breakdown (blue circle) in October after being in an uptrend (purple line). Two downtrends were in effect and broken to the upside in September (green dotted line) and August (green solid line).
The daily trend for the SPY remains up. The upside objective of 485.00 was hit. The next upside objective remains at 510.00.
The SPY closed at 494.35, up +1.42% for the week, remaining above the rising 50-day Moving Average (blue rectangle) and the 200-day Moving Average (red rectangle), a sign of strength.
Support is at 489.00, 480.00, 470.00, 455.00, and 440.00.
MACD (bottom chart) remains on a sell, above 0, and rising with the momentum uptrend from November in effect.
It will be a positive in the short term if support at 489.00 holds and SPY closes above last week’s high of 501.65. On the other hand, a close below 489.00 could lead to a sharp, quick decline.
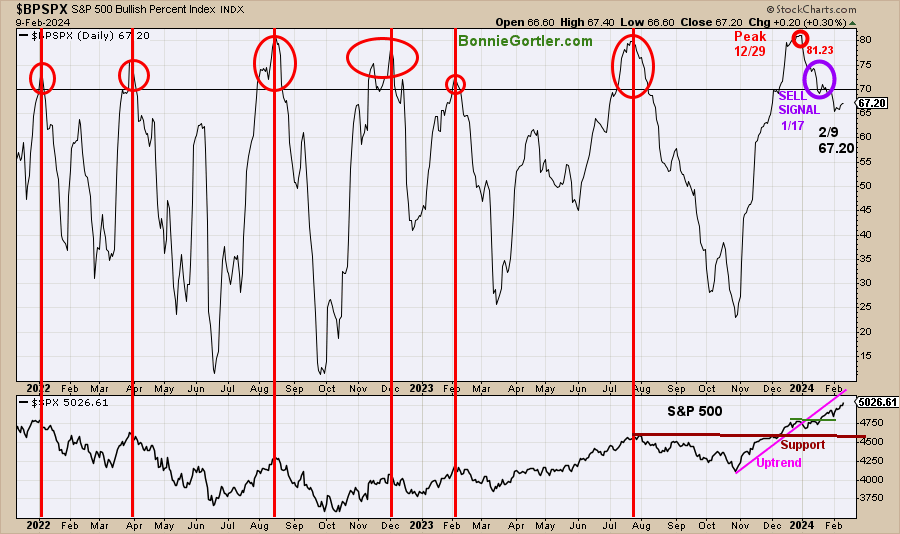
Figure 11: S&P 500 Bullish Percent Index
020924 SPY Bullish Percentage Index Daily
Source: Stockcharts.com
The Bullish Percent Index (BPI), developed by Abe Cohen in the 1950s, is a breadth indicator based on the number of stocks based on Point and Figure Buy signals. The indicator helps you know the market’s health and when it’s overbought or oversold.
When the bullish percent index is above 70%, the market is overbought, and when the indicator is below 30%, the market is oversold. Like other overbought indicators, sometimes it does not get as high or as low. In 2022 and 2023, the indicator reached 70 (overbought) seven times (red circles). Six of the seven were near market peaks (red lines). BPI peaked at 81.00 on 12/29/23. A reading over 70, followed by a retracement below 70, gives a sell signal on this indicator.
On 1/17/24, BPI generated a sell signal, falling below 70 at 69.80 (purple circle), with the S&P 500 index at 4731.21.
The current reading as of 2/9/24 is 67.20, up from 66.20 on 2/2/24.
The S&P 500 Index (lower chart) closed at 4958.61, up +1.37% for the week. The October uptrend broke at the end of December (pink line), yet there was no downside follow-through. The S&P 500 key support remains at 4600, but below 4800, it would likely increase selling pressure in the short term.
BPI remains on a sell. Past performance does not guarantee future results.
The S&P 500 has moved higher in fourteen of the past fifteen weeks. Technology continues to lead the market higher. Small Cap stocks joined the party this past week. Despite momentum indicators showing non-confirmation of recent highs, the jury is out when a pullback will occur. Time will tell if there will be a follow-through to the channel breakout or if the market will take a breather to digest recent gains. For now, the bulls remain in control.
Remember to manage your risk, and your wealth will grow.
Let’s talk investing. You are invited to schedule your Free 30-minute Wealth and Well-Being Strategy session here or by emailing me at Bonnie@BonnieGortler.com. I would love to schedule a call and connect with you.
Disclaimer: Although the information is made with a sincere effort for accuracy, it is not guaranteed that the information provided is a statement of fact. Nor can we guarantee the results of following any of the recommendations made herein. Readers are encouraged to meet with their own advisors to consider the suitability of investments for their own particular situations and for determination of their own risk levels. Past performance does not guarantee any future results.


Create more wealth in your life
with these simple strategies.
As an added bonus you will also
receive BG’s Updates and Ezine

Discover how to quickly create more well-being in your life with these simple strategies.
As an added bonus you will also
receive BG’s Updates and Ezine

As an added bonus you will receive BG’s Updates and Ezine

All work listed on BonnieGortler.com is licensed under a Creative Commons Attribution - Noncommercial - No Derivative Works 3.0 Unported License.


Free Report:
Grow and Sustain Your Wealth
Discover how to grow your money with these easy, simple steps.


Extremely well written through an easy to grasp wrote up. Thanks!
HI CoastalMuayThai
Thank you. I appreciate you stopping by y blog and your kind words.
Bonnie
Thanks for continuing to keep these insights upfront and personal – and available during these tumultuous times.
blessings,
Cynthia Ann Leighton