

10 Simple Tips for Financial Well-Being
07/01/2026
The bulls regained control in an explosive week. All eleven S&P SPDR sectors rose. Consumer Discretionary (XLY) and Energy (XLE) were the strongest, while Communication Services and Health Care (XLV) were the weakest. The SPDR S&P 500 ETF Trust (SPY) was up +6.58%.
5/20/22 – 5/27/22
S&P SPDR Sector ETFs Performance Summary

052722 Sectors Week
Source: Stockcharts.com
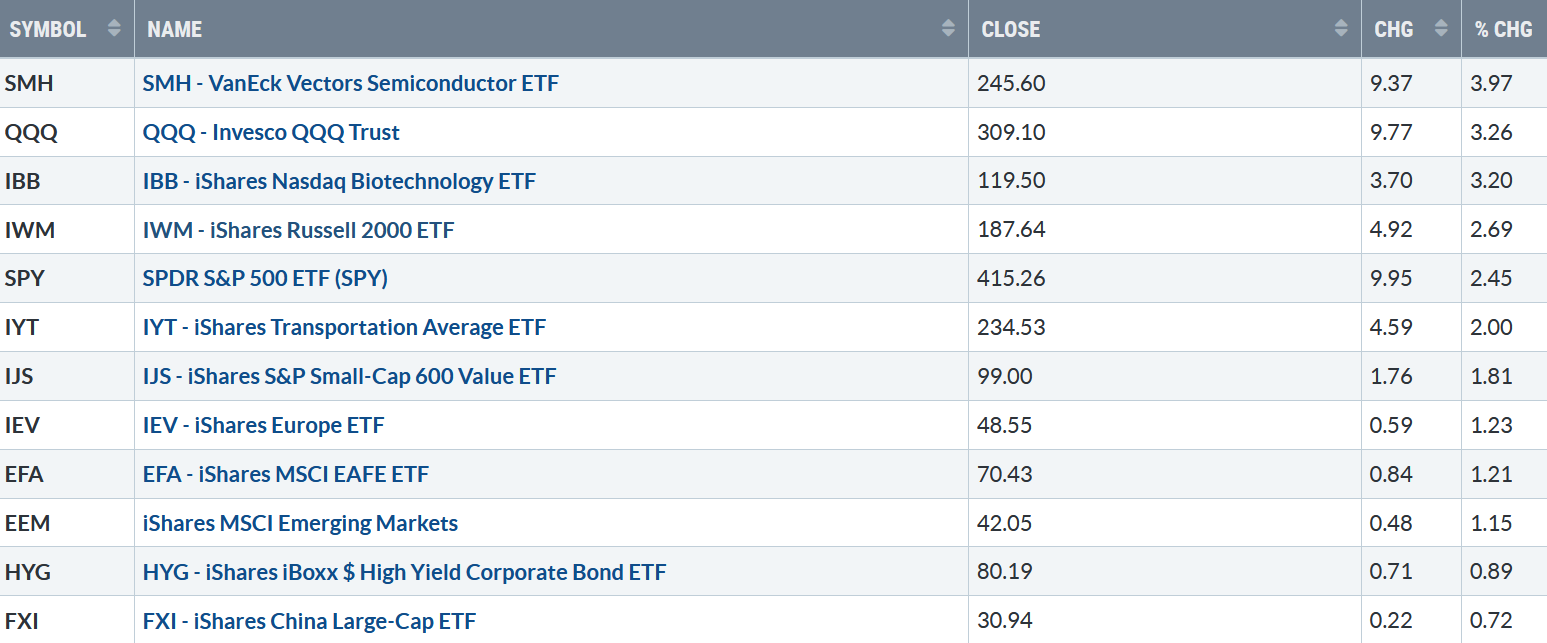
Figure 2: Bonnie’s Mix of ETFs
Performance Summary 5/20/22 – 5/27/22
052722 Week ETFs
Source: Stockcharts.com
Semiconductors and Technology led the advance with Small Cap stocks both Growth and Value sharply higher. International markets underperformed the U.S. market.
Investors remain cautious; despite the rally, the CNBC Fear and Greed Index (a contrary indicator), market sentiment ended the week showing extreme fear. The AAII Sentiment Survey (a contrary indicator) shows abnormally low optimism and pessimism, well above its historical average.
The 10-Year U.S. Treasury yields moved lower for the third week, closing at 2.743%, and the 5 Year U.S Treasury yield dropped to 2.71%,
For the week, The Dow rose +6.24%. The S&P 500 was up +6.58%, and Nasdaq gained 6.84%. The Russell 2000 Index rose by 6.46%, while The Value Line Arithmetic Index (a mix of approximately 1700 stocks was up by 6.23%.
Finally, weekly market breadth was positive for New York Stock Exchange Index (NYSE) and Nasdaq. The NYSE had 3137 advances and 443 declines, with 136 new highs and 470 new lows. There were 3861 advances and 1445 declines for the Nasdaq, with108 new highs and 888 new lows.
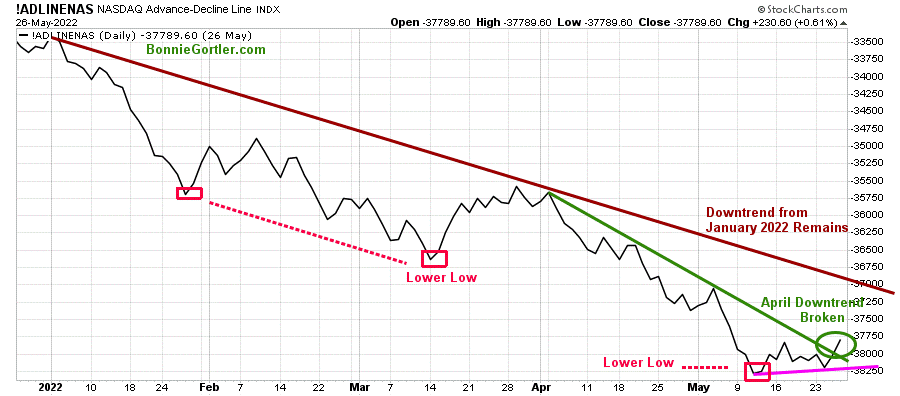
Figure 3: Nasdaq Advance Decline Line (Daily)
52722 Daily Nasdaq AD-Line
Source: Stockcharts.com
A significant improvement last week in Nasdaq breadth. It’s positive that the Nasdaq advance decline line broke its April downtrend (green line). However, for the rally to be sustainable over the intermediate term (weeks to months), continued positive breadth is necessary over the next few weeks, ultimately breaking the January downtrend (brown line). On the other hand, if market breadth weakens and the latest low is violated, it will be a clue another leg down is likely.
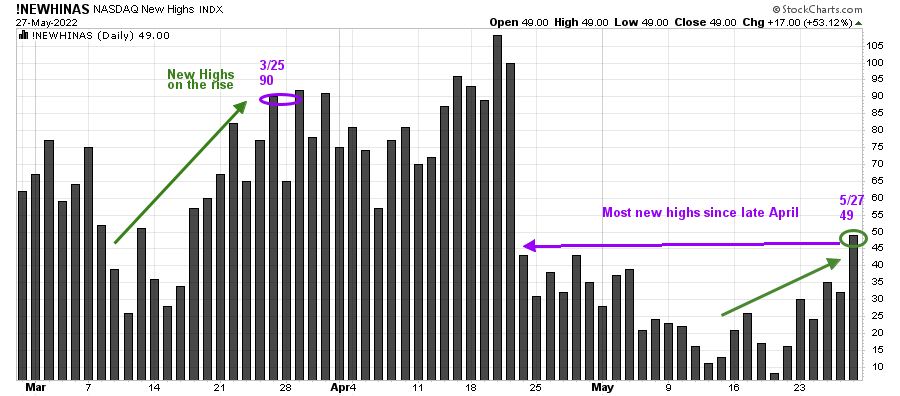
Figure 4: Nasdaq New Highs
52722 Daily Nasdaq New HIghs
Source: Stockcharts.com
The Nasdaq had the highest number of new highs since late April, and it would be bullish if the number of Nasdaq New Highs continued to climb.
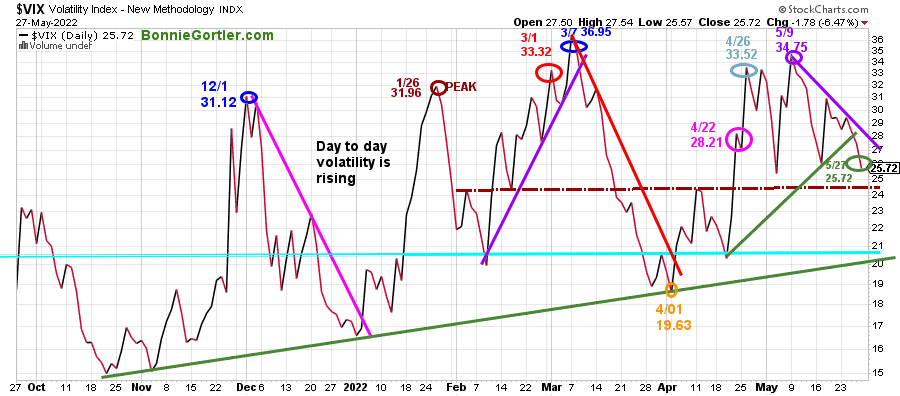
Figure 5: CBOE Volatility Index VIX
52722 Daily VIX
Source: Stockcharts.com
The CBOE Volatility Index ($VIX), a measure of fear, has been trading above 20.00 for most of 2022. In January, VIX made a high at 31.96 on 1/26 (brown circle), on 3/1 at 33.32 (red circle), and peaked at 36.95 on 3/7 (blue circle). VIX, through the sell-off, remained below the March peak.
Last week, VIX fell for the second week in a row breaking the uptrend, closing at 25.72 (green circle), above support at 24.00 (brown dotted line). Intraday volatility will be less if VIX falls below the 4/01 April low (orange circle) at 19.63.
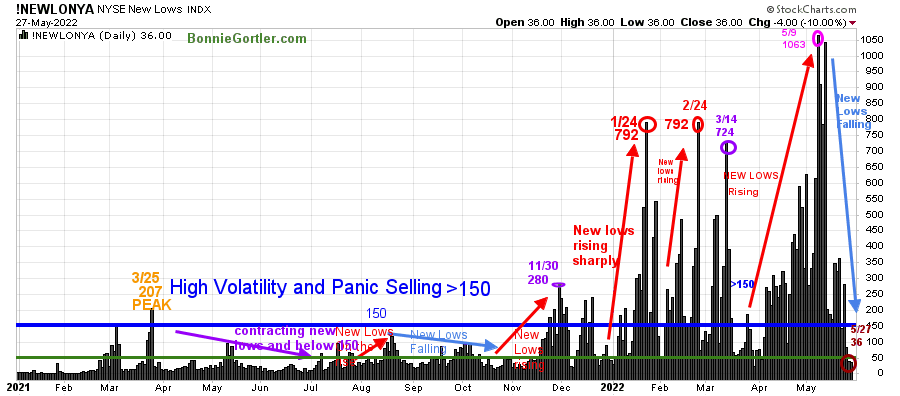
A meaningful change took place this past week. New Lows contracted significantly and are no longer over 150, closing at 36 (brown circle), and no longer in a high-risk zone.
Figure 6: Daily New York Stock Exchange (NYSE) New Lows
52722 NYSE New LOWS Daily
Source: Stockcharts.com
Watching New lows on the New York Stock Exchange is a simple technical tool that helps awareness of the immediate trend’s direction.
New lows warned of a potential sharp pullback, high volatility, and “panic selling” for most of 2022, closing above 150. As the market started to move lower in January, New Lows rose sharply, peaking at 792 on 1/24 (red circle), and then contracted before rising again on 2/24, matching the 1/24 peak, implying the risk increased of further selling pressure. Investors in early May continued to unload stocks, and New Lows made a new high for 2022 of 1063 on 5/9 (pink circle).
Learn more about the significance of New Lows in my book, Journey to Wealth, published on Amazon. Here is an excerpt, The market is very strong when the New Lows are below 25 (Very Low Risk and prices tend to rise). When New Lows are between 25 and 50, the risk is low, and prices tend to rise.
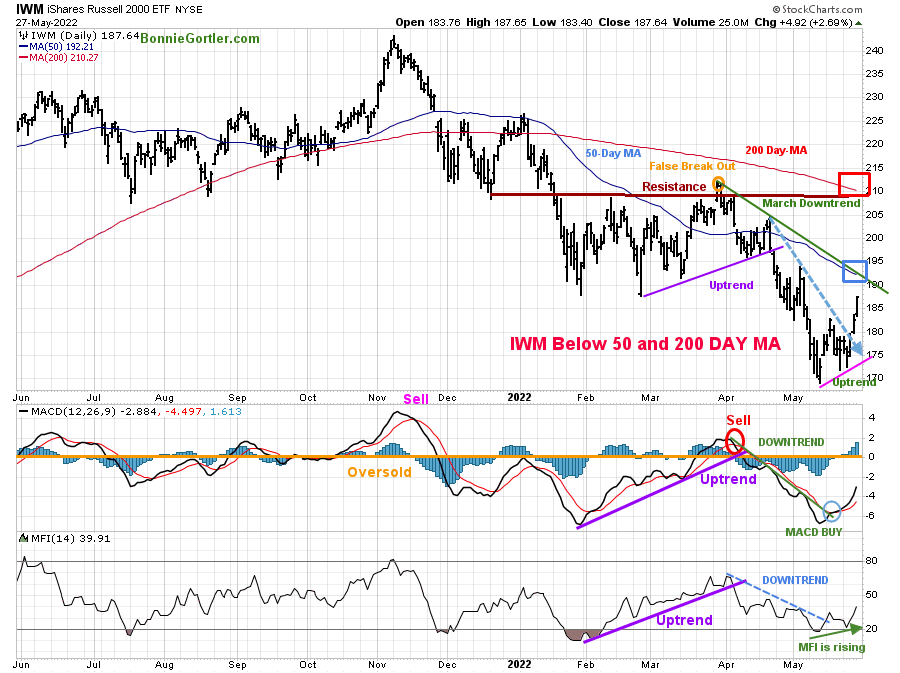
Figure 7: Daily iShares Russell 2000 (IWM) Price (Top) and 12-26-9 MACD (Middle) and Money Flow (Bottom)
502022 Daily IWM
Source: Stockcharts.com
The top portion of the chart is the daily iShares Russell 2000 Index ETF (IWM), the benchmark for small-cap stocks, with a 50-Day Moving Average (MA) (blue line) and 200-Day Moving Average (MA) that traders watch and use to define trends.
IWM failed to break out above resistance at 210.00 (orange circle) at the end of March and turned sharply lower, forming a downtrend (green line).
As other major averages made a new low the previous week, IWM was one of the few that made a higher low. IWM closed the week at its high, up +6.57%, getting above the first resistance at 183.00 mentioned in the 5/20/22 market update. It’s positive in the near term; IWM had enough strength to break the April downtrend (blue dotted line).
However, IWM still has more work to do to prove more gains will unfold. For example, IWM closed below the March downtrend (green line) and the 50 and 200-Day Moving Averages (blue and red rectangle).
Short-term resistance is 195.00, 205.00, and 210.00. Support is at 183.00, 173.00, followed by 170.00.
MACD (middle chart) remains on a buy, below 0 and rising after breaking the April downtrend (green line).
Money Flow (lower chart) turned up and then declined after breaking the April downtrend (dotted blue line). I am optimistic there is more room to the upside now that Money Flow is rising in an uptrend.
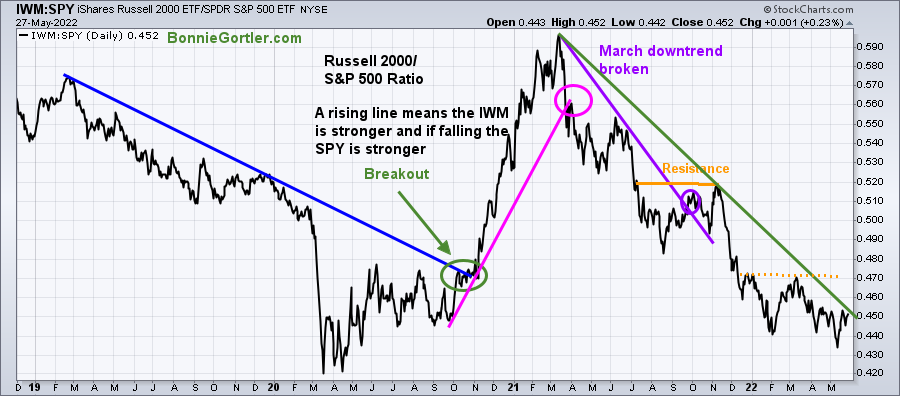
Relative strength in the Russell 2000 compared to the S&P 500 appears ready to break the March downtrend, which would be favorable.
Figure 8: Russell 2000 (IWM)/S&P 500 (SPY) Daily Ratio
52722 Daily IWM SPY relative strength
Source: Stockcharts.com
A rising line means the Russell 200 (IWM)is stronger, and if falling, the S&P 500 (SPY) is stronger.
Watch this week if IWM is stronger than the S&P 500. A break of the downtrend from March 2021 would signal that IWM will likely outperform the S&P 500 in the short term.
Nasdaq Short Term Trend Shifted from Down to Up
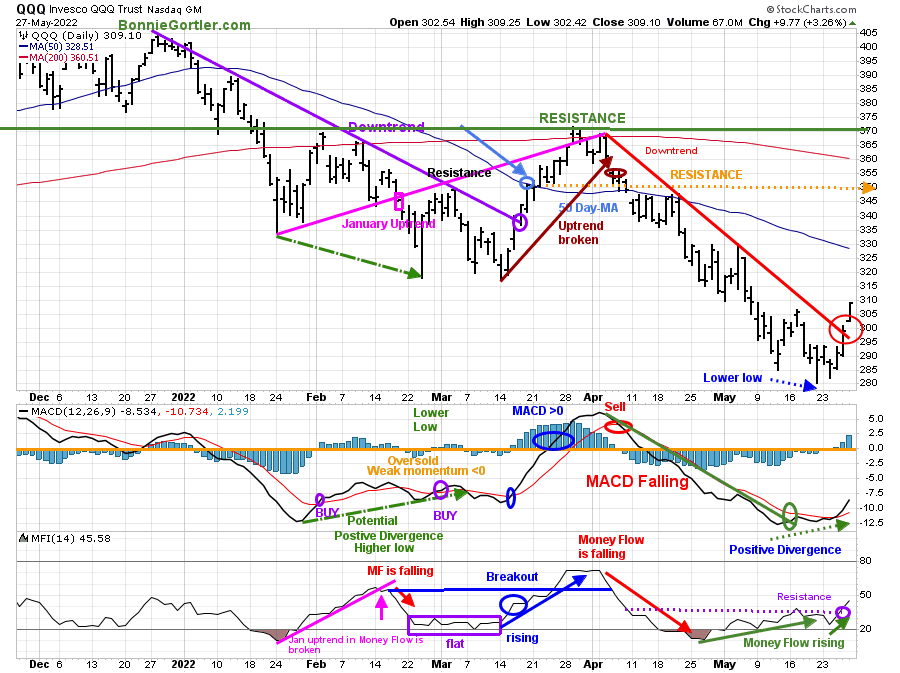
Figure 9: Daily Invesco QQQ Trust (QQQ) Price (Top) and 12-26-9 MACD (Bottom)
52722 Daily QQQ
Source: Stockcharts.com
The chart shows the daily Invesco QQQ, an exchange-traded fund based on the Nasdaq 100 Index with its 50 and 200-Day Moving Average. QQQ accelerated lower after breaking the January uptrend (pink rectangle), penetrating the January lows. After breaking the March uptrend (brown line) at 355.00, QQQ has been under heavy selling pressure.
The short-term trend shifted from down to up last week. The April downtrend was broken (red line) last week. QQQ had a strong week gaining +7.07%, closing at 309.10, near its day’s high on Friday. Despite the significant gains, QQQ was so weak that it remained below the 50-Day and 200-Day Moving Average.
Resistance is at 315.00, 330.00, and 350.00. Support is at 295.00, 285.00, followed by 280.00.
The middle chart is MACD (12, 26, 9), a measure of momentum. MACD generated a buy from a deeply oversold condition below 0. MACD formed a positive divergence, a bullish pattern where QQQ made a lower low and MACD made a higher high.
Money Flow (lower chart) trended lower in April. However, the pattern is more favorable now, with Money Flow rising and closing above resistance (purple dotted line).
Figure 10: Van Eck Semiconductors (SMH) Daily Price (Top), 12-26-9 MACD (Middle), and Money Flow (Bottom)
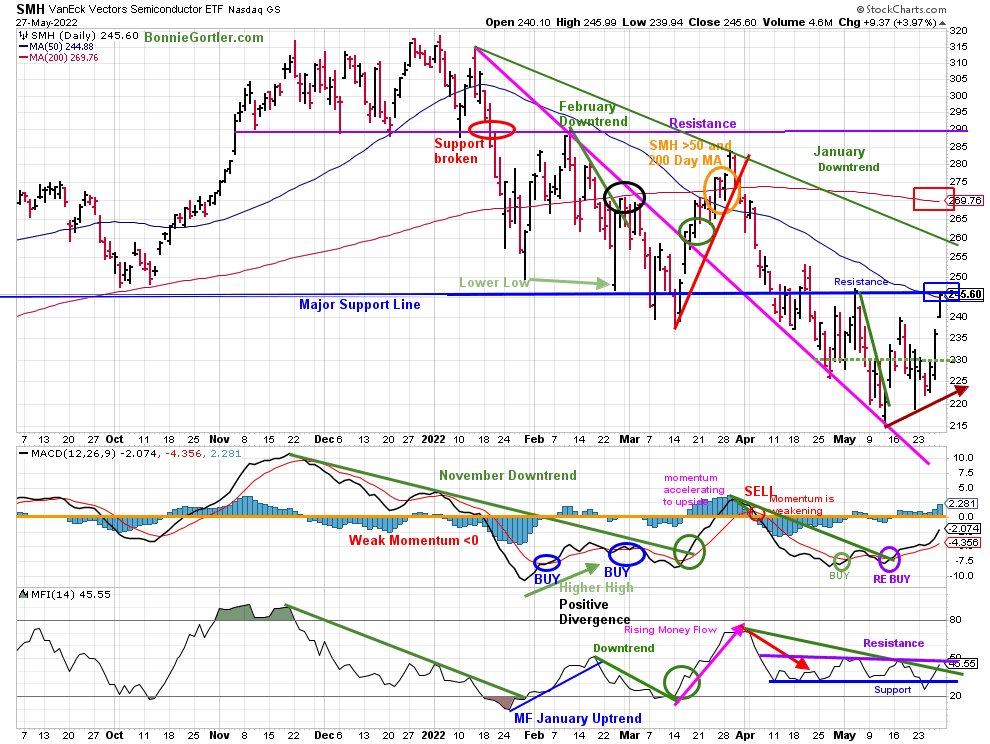
52722 Daily SMH
Stockcharts.com
In late January, SMH support was broken (red circle) and then fell sharply but held the October 2021 lows. SMH then rallied but turned down again, closing below support at 240.00 on 3/14/22, a false breakdown. SMH broke the March uptrend (red line) after failing to get above the resistance at 290.00.
SMH rose sharply, leading the market up +7.64% for the week, closing at 245.60. SMH closed slightly above the 50 Day MA. This week, keep an eye on whether SMH moves higher or stalls since it closed at resistance (blue horizontal line).
Support is at 240.00 and 230.00. Resistance is 252.00 260.00, followed by 270.00 (the 200-Day MA) and 290.00.
MACD (middle chart) is on a buy (green circle) and generated a re-buy (purple circle), beginning to accelerate higher.
Money Flow (lower chart) has been trending sideways since 4/11 and is close to breaking its downtrend (green line) and getting above resistance (purple line) which would confirm there are more gains ahead.
Figure 11: I Shares Hi Yield Corporate Bond (HYG) (Top), and 12-26-9 MACD (Bottom)
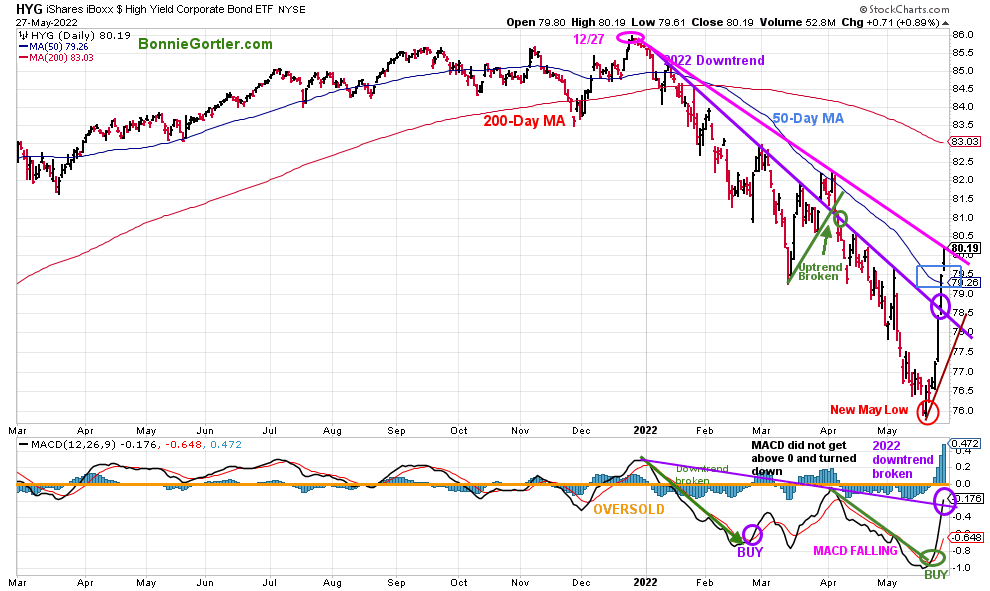
52722 Daily HYG
Stockcharts.com
Hi-Yield Bonds (HYG) peaked on 12/27/21, but HYG failed to show much strength after breaking the downtrend in early April (green line), a false breakout.
Last week HYG was explosive, closing sharply higher after each week, making new lows in May. Investors changed their view to risk on early last week, taking advantage of an area with heavy selling in 2022 and higher yields. HYG gained +4.88% for the week at 80.19, closing above its 50-Day MA and right at its 2022 downtrend.
Support is at 78.00, and resistance is at 82.00.
MACD (lower chart) is on a buy. Its bullish MACD broke the downtrend that started in 2022. Continued strength in HYG would be bullish for equities and high yield bonds.
Figure 12: The S&P 500 Index Daily ($SPX)
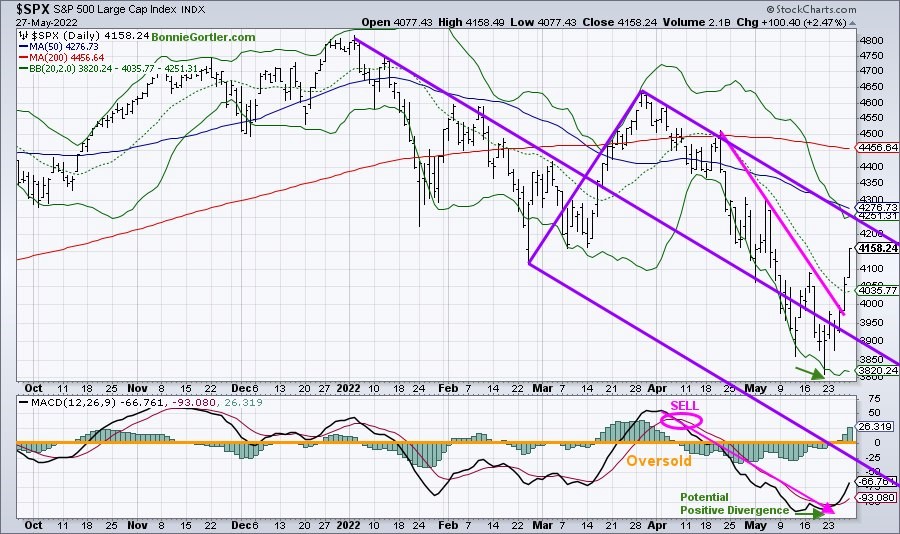
52722 S&P 500 Index
The S&P 500 (SPX) closed higher for the third straight day in a row in a powerful advance, breaking the downtrend (pink line) and its best week of 2022. The short-term objective is 4276.00. The best moves are the ones that don’t let you in and keep going higher.
A close above 4300.00 will generate more believers in the rally, likely to trip the buy stops, and cause more investors to cover their shorts.
Support is at 3950. If you are interested in this chart, I invite you to join my FB group Wealth Through Market Charts, where I will be posting the updated chart.
The MACD (lower chart) buy with the positive divergence in MACD was an early warning of the rally.
Summing Up:
The major averages closed at session highs last week. The Dow broke its streak of 8 down weeks, closing higher six days in a row. The S&P 500 rose for the first time in eight weeks. Market breadth finally was impressive. The Nasdaq had the most new highs since late April. The week ended with a bullish volume thrust with three days of up volume as a percentage of total volume on the NYSE greater than 80%. The rally was broad, breaking the downtrends and shifting the short-term trend from negative to positive.
Continue to watch for Semiconductors, Technology, and Small Cap stocks to lead the market higher with new lows on the NYSE remaining below 50 and contracting to below 25. The best moves in the market are where there is only a slight pullback and prices keep working their way higher. For now, the technicals are supporting the bulls taking control over the bears.
Remember to manage your risk, and your wealth will grow.
If you liked this article, you will love my Free Grow and Sustain Your Wealth Report. Get it here:

Do you like charts, I invite you to my FB group Wealth Through Market Charts or email me at Bonnie@Bonniegortler.com.
I would love to hear from you. If you have any questions or comments or would like to talk about the market, click here.
Disclaimer: Although the information is made with a sincere effort for accuracy, it is not guaranteed that the information provided is a statement of fact. Nor can we guarantee the results of following any of the recommendations made herein. Readers are encouraged to meet with their own advisors to consider the suitability of investments for their own particular situations and for determination of their own risk levels. Past performance does not guarantee any future results.


Create more wealth in your life
with these simple strategies.
As an added bonus you will also
receive BG’s Updates and Ezine

Discover how to quickly create more well-being in your life with these simple strategies.
As an added bonus you will also
receive BG’s Updates and Ezine

As an added bonus you will receive BG’s Updates and Ezine

All work listed on BonnieGortler.com is licensed under a Creative Commons Attribution - Noncommercial - No Derivative Works 3.0 Unported License.


Free Report:
Grow and Sustain Your Wealth
Discover how to grow your money with these easy, simple steps.

