


10 Simple Tips for Financial Well-Being
07/01/2026
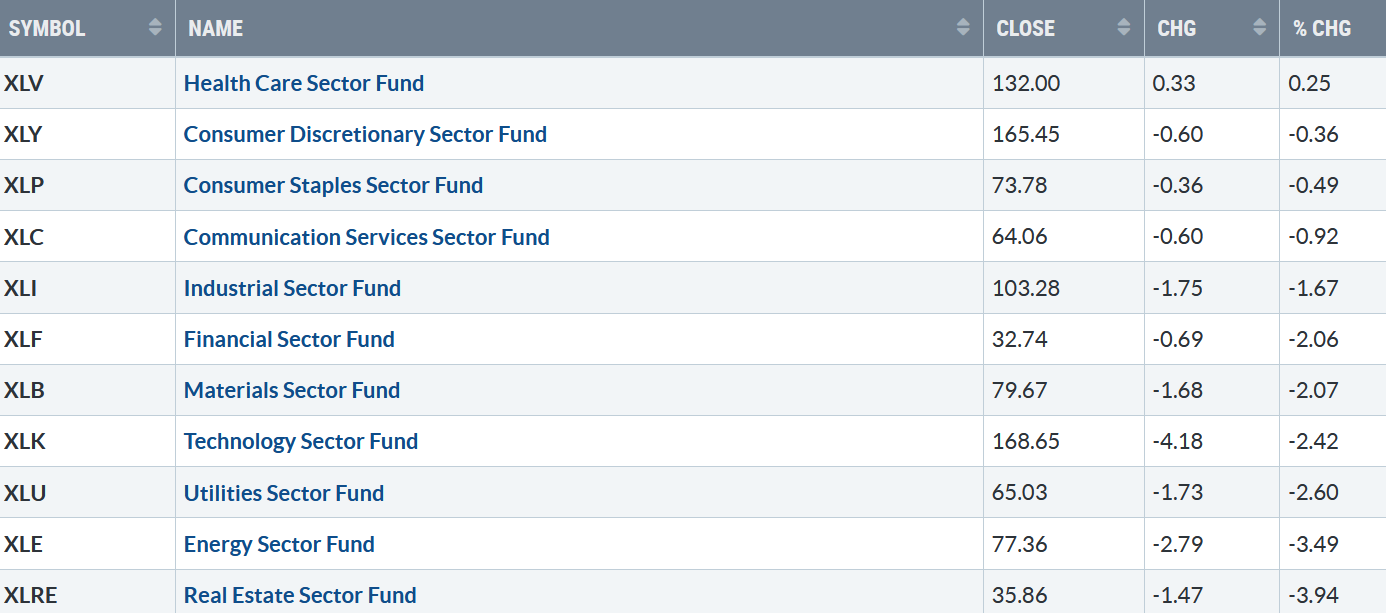
Nasdaq and S&P 500 winning streak came to an end. Only one of the eleven S&P SPDR sectors finished higher for the week. Health Care (XLV) showed a slight gain, while Energy (XLE) and Real Estate were the weakest, the SPDR S&P 500 ETF Trust (SPY) down -1.42%.
S&P SPDR Sector ETFs Performance Summary 6/16/23-6/23/23
062323 SPDR Sectors
Source: Stockcharts.com
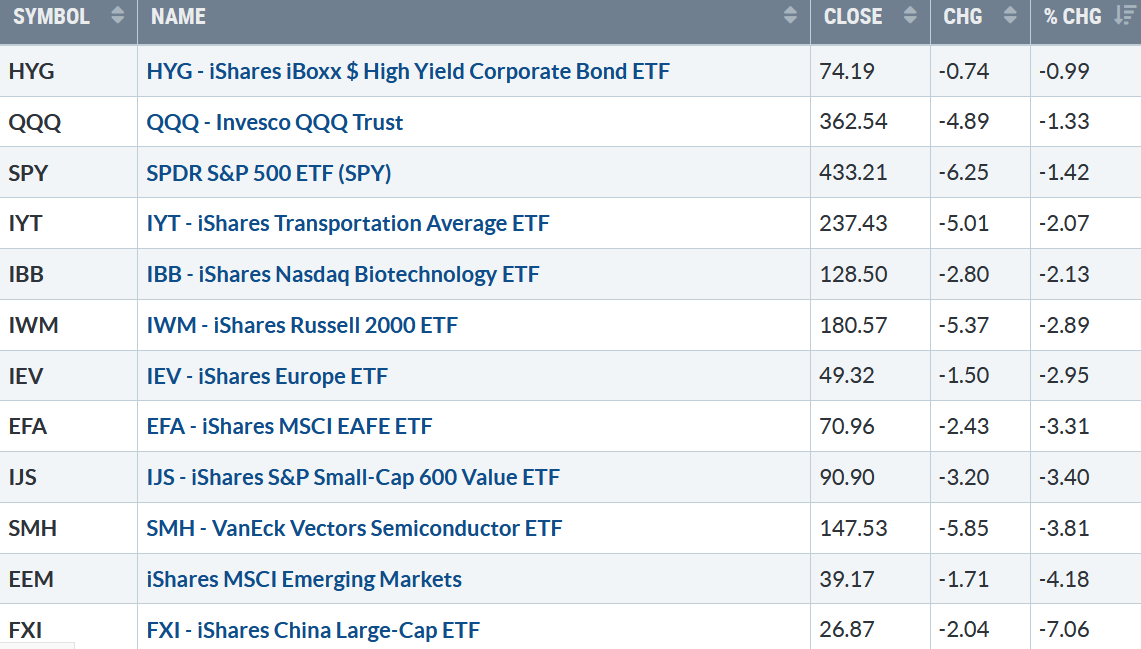
Figure 2: Bonnie’s ETFs Watch List Performance Summary 6/16/23-6/23/23
062323 Week ETFs
Source: Stockcharts.com
China, Emerging Markets, and Semiconductors were the weakest, under heavy selling pressure, while Hi Yields Bonds and Large Cap Mega Tech fell but less than the S&P 500. Small Cap Value and Small Cap Growth were also weak.
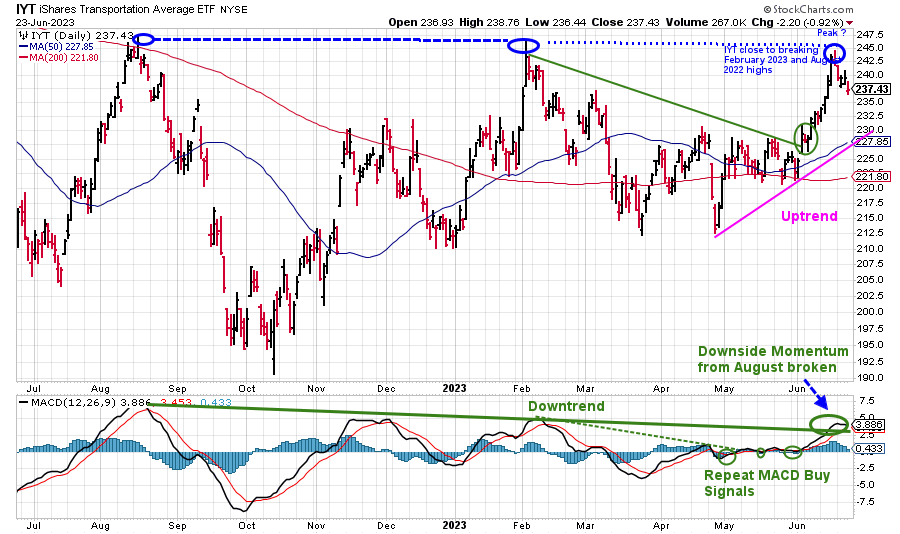
Figure 3: iShares Transportation Average (IYT) Price (Top) and 12-26-9 MACD (Bottom
062323 IYT Daily
Source: Stockcharts.com
The Transportation Average (IYT) broke out in early June (green circle) after consolidating near the 50-Day and 200-Day Moving Averages, gaining strength but stalling under the August 2022 and February 2023 highs. When IYT is a market leader, it tends to be a good sign for continued strength for the overall market.
The IYT April uptrend remains in effect despite last week’s pullback.
MACD (bottom chart) remains on a buy. However, momentum is flattening, and a potential sell signal could occur. With the momentum downtrend from August 2022 breaking, another leg to the upside is possible. A positive sign to watch for would be if the Dow Jones Industrials and Transports turn higher together, making a new high and confirming one another.
Learn more about charting in my free Masterclass, Charting Strategies to Cut Risk and Trade with the Trend. Sign up here.
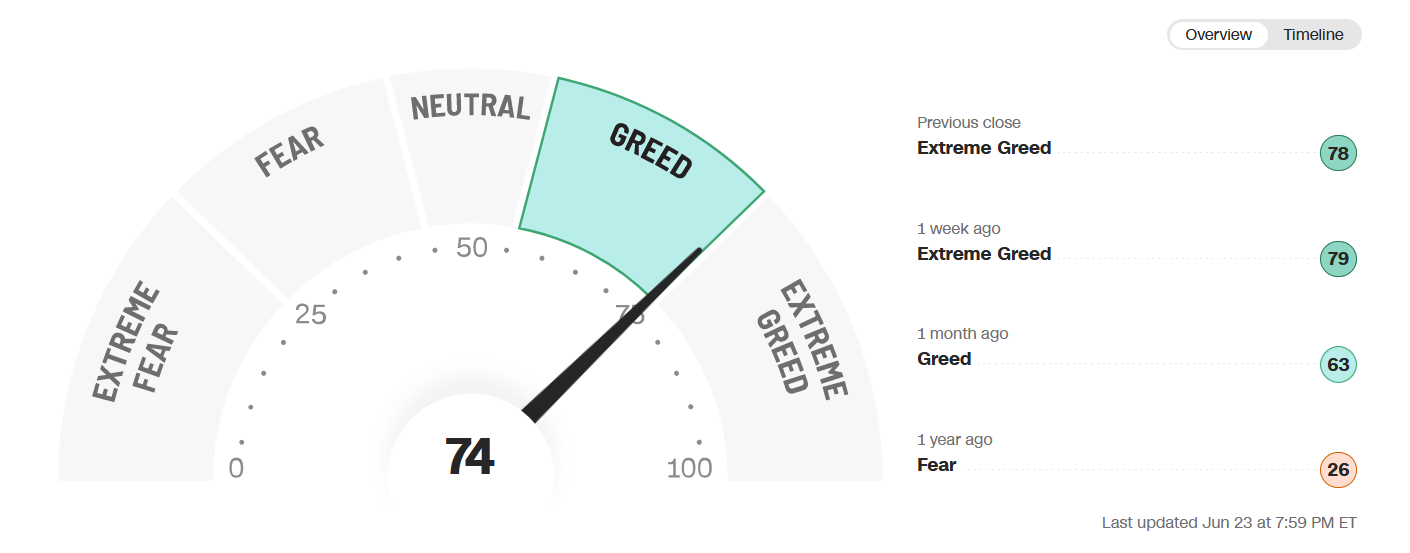
Figure 4: Fear & Greed Index
062323 Fear and Greed Index
Source: Stockcharts.com
Investor sentiment based on the Fear and Greed Index (a contrarian index) measures the market’s mood, fell last week from extreme greed to close at 74 showing greed.
Figure 5: CBOE Volatility Index VIX
062323 VIX Daily
Source: Stockcharts.com
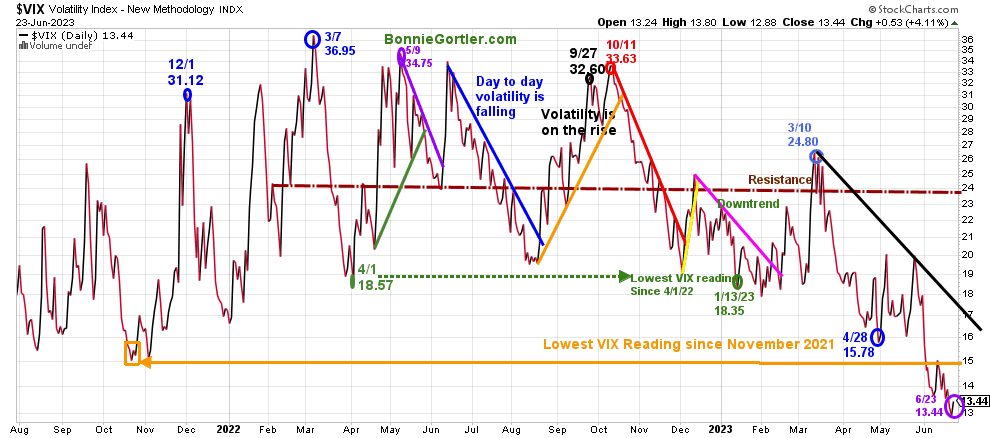
The CBOE Volatility Index (VIX), a measure of fear, traded above 20.00 for most of 2022, with a high at 36.95 on 3/7 (blue circle). A new VIX low did not occur until 1/13/23 at 18.35 (green circle).
Volatility Index (VIX) peaked in October 2022 and has trended lower since March 2023. VIX fell slightly last week, closing at 13.44 (purple circle), trading near January 2020 levels. Intraday volatility will likely remain low as we move into July and August. However, if VIX closes above 20.00, look for volatility to increase towards 24.00 and potentially higher.
Figure 6: UST 10YR Bond Yields Daily
062323 UST 10 Yr Bond Yields Daily
Source: Stockcharts.com
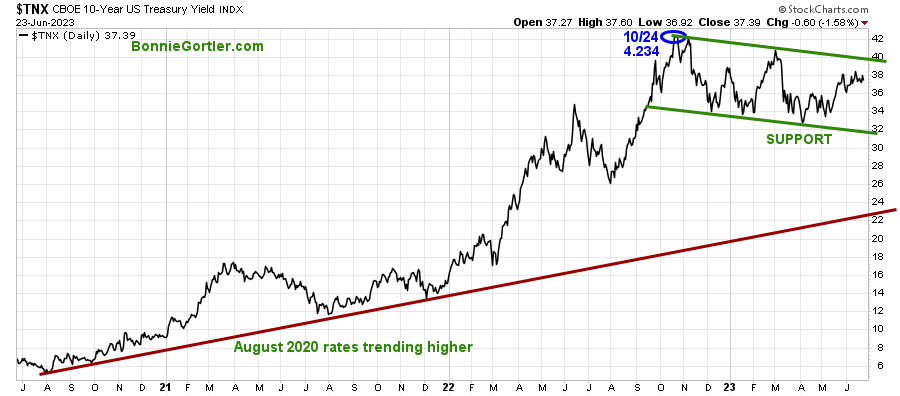
The 10-Year U.S. Treasury yields rose last week, closing at 3.739%. Support remains at 3.20%, with resistance at 4.00%. Yields rising above 4.00% could quickly put pressure on equities.
The major market averages were all lower last week. The Dow fell -1.67%, the S&P 500 fell -1.39%, breaking its five-week winning streak, and the Nasdaq dropped -1.44%, breaking its eight-week winning streak. The Russell 2000 Index failed to break out, falling sharply -2.87%.
Learn more about charting in the comfort of your home with my Free 33-minute Training, Charting Strategies to Cut Risk and Trade with the Trend. Sign up here
Figure 7: Value Line Arithmetic Average
062323 VLE Daily
Source: Stockcharts.com
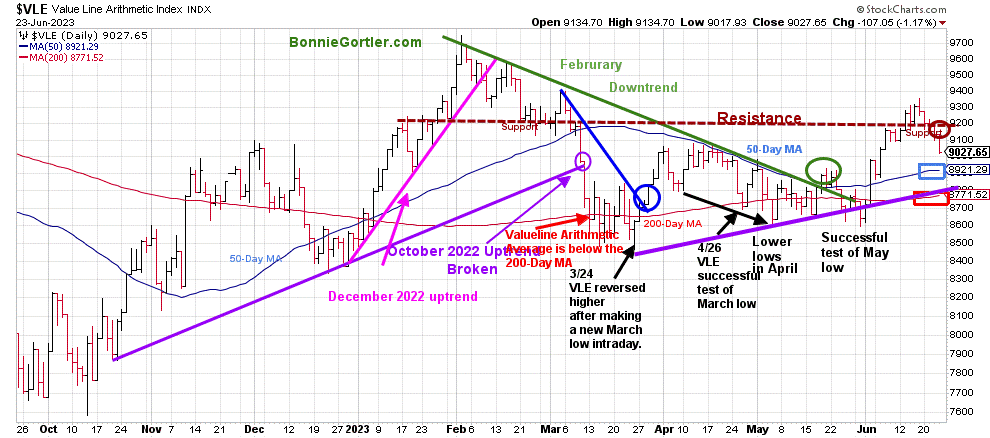
The Value Line Arithmetic Index ($VLE) is a mix of approximately 1700 stocks. VLE broke the October 2022 uptrend in early March, headed lower, and on 3/24, bottomed and reversed higher. In April and May, there were successful tests of the low.
After penetrating key resistance at 9200 last week, VLE reversed lower, down -2.66%, falling below support at 9200 and 9050 after failing to reach the March highs near 9400. However, VLE closed above the 50-Day MA (blue rectangle) and the 200-Day MA (red rectangle), with the uptrend remaining intact from March (purple line).
Resistance is at 9050, 9200, 9400, and 9700. Support is at 8900 and 8700. A close below 8700 would be a sign there is more downside toward the March lows.
Market breadth weakened
Weekly market breadth was negative on the New York Stock Exchange Index (NYSE) and for the Nasdaq. The NYSE had 920 advances and 2168 declines, with 153 new highs and 80 new lows. There were 1554 advances and 3302 declines on the Nasdaq, with 216 new highs and 295 new lows.
Further contraction in the weekly number of New Highs and an increase of New Lows on the Nasdaq and NYSE would be negative. On the other hand, weekly New Lows contracting and New highs expanding would be favorable.
Do you want to go more in-depth with charts, I invite you to join my FB group Wealth Through Market Charts.
Figure 8: NYSE Cumulative Advance-Decline Line and New York Stock Exchange Index (Below)
062323 Daily NYSE Cumulative Advance-Decline Line and NYSE
Source: Stockcharts.com
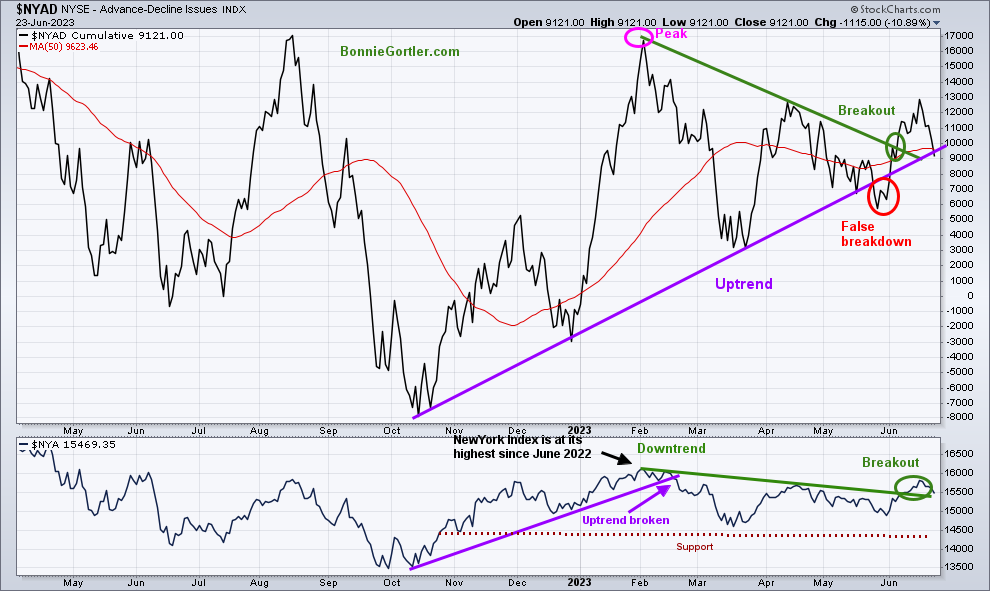
The top chart is the Cumulative Advance-Decline Line (AD Line) of the NYSE, a breadth indicator based on the number of advancing stocks minus the number of declining stocks. The NYSE AD Line peaked in February 2023 (green circle top chart) and then declined as the S&P 500 and Nasdaq rose.
The uptrend in the NYSE Advance-Decline Line from October (top chart) had a false breakdown (red circle) in May (red circle). Breadth improved in June, breaking the AD-Line’s downtrend from February (green line) but did not take out February’s highs (pink circle).
It’s positive the New York Index (lower chart) confirmed the AD line breakout of the downtrend (green line) and implies another rally attempt.
An immediate turn-up in the AD line and NYSE would imply that this past week was only a test of last week’s breakout and more upside to follow. Time will tell.
Let’s talk investing. You are invited to set up your Free 30-minute Wealth and Well-Being Strategy session by clicking here or emailing me at Bonnie@BonnieGortler.com. I would love to schedule a call and connect with you.
Nasdaq breadth remains below resistance.
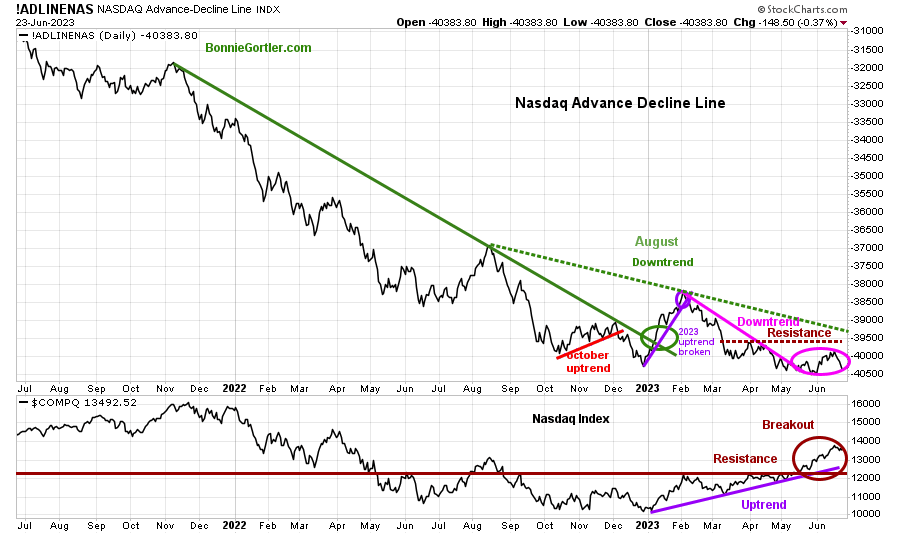
Figure 9: Nasdaq Advance Decline Line Daily (Top) and Nasdaq (Bottom)
062323 Daily Nasdaq Cumulative Advance-Decline Line
Source: Stockcharts.com
The chart is the Nasdaq Daily Advance-Decline Line, a technical indicator that plots the difference between the number of advancing and declining stocks.
In January, the October 2022 downtrend was broken (solid green line). However, the improvement in the market breadth was short-lived, with the Nasdaq Advance-Decline line deteriorating in February 2023. The August downtrend (green dotted line top chart) remains in effect as Nasdaq continues to new 52-week highs (lower chart).
Nasdaq pulled back, and the AD-Line turned down last week. To confirm more stocks will participate in the advance, the AD-Line needs to get through resistance (brown dotted line) and then breaks the August downtrend (green dotted line).
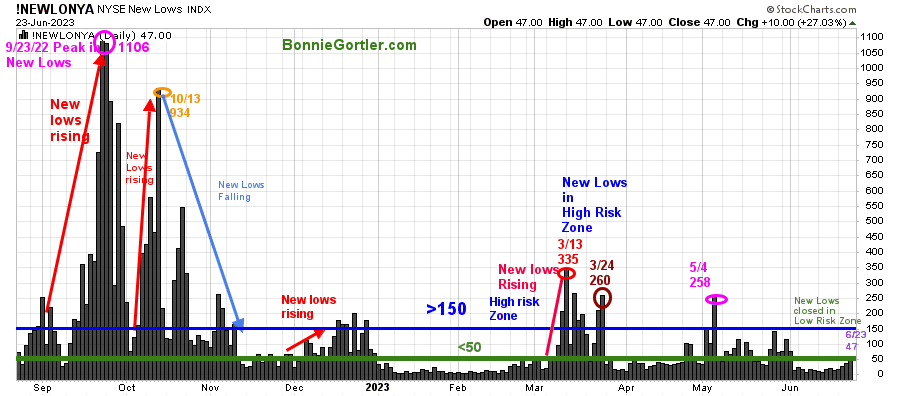
Figure 10: Daily New York Stock Exchange (NYSE) New Lows
062323 NYSE New Lows Daily
Source: Stockcharts.com
Watching New Lows on the New York Stock Exchange is a simple technical tool that helps awareness of the immediate trend’s direction. New lows warned of a potential sharp pullback, high volatility, and “panic selling” for most of 2022, closing above 150. The peak reading was 9/23/22 when New Lows made a new high of 1106 (pink circle), and New Lows expanded to their highest level in 2023 on 3/13/23 (red circle) to 335.
New Lows increased last week, closing at 47(purple circle), remaining in a low-risk zone but no longer in the lowest-risk zone below 25. It would be a positive sign that that week’s sell-off is only temporary if New Lows fall to the lowest risk zone below 25 and New Highs increase to more than 203 (Figure 11).
On the other hand, two closes above 150 New Lows would imply an increased risk of the recent decline accelerating.
Learn more about the significance of New Lows in my book, Journey to Wealth, published on Amazon. If you would like a preview, get a free chapter here.
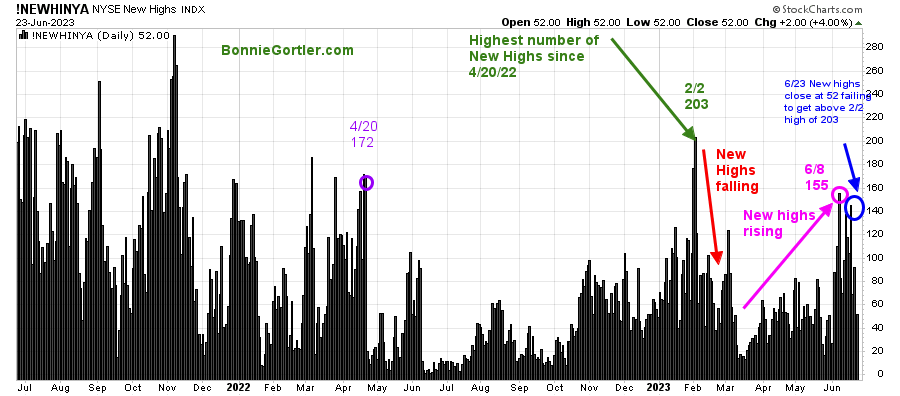
Figure 11: Daily New York Stock Exchange (NYSE) New Highs
06233 NYSE New Highs Daily
Source: Stockcharts.com
New highs rose in June. However, during the rally, they did not reach the February high of 203 and turned lower, closing at 52. For a meaningful rally, you want to see an increase of New Highs to more than 203 made on 2/2 and continue to expand.
Small Caps underperformed
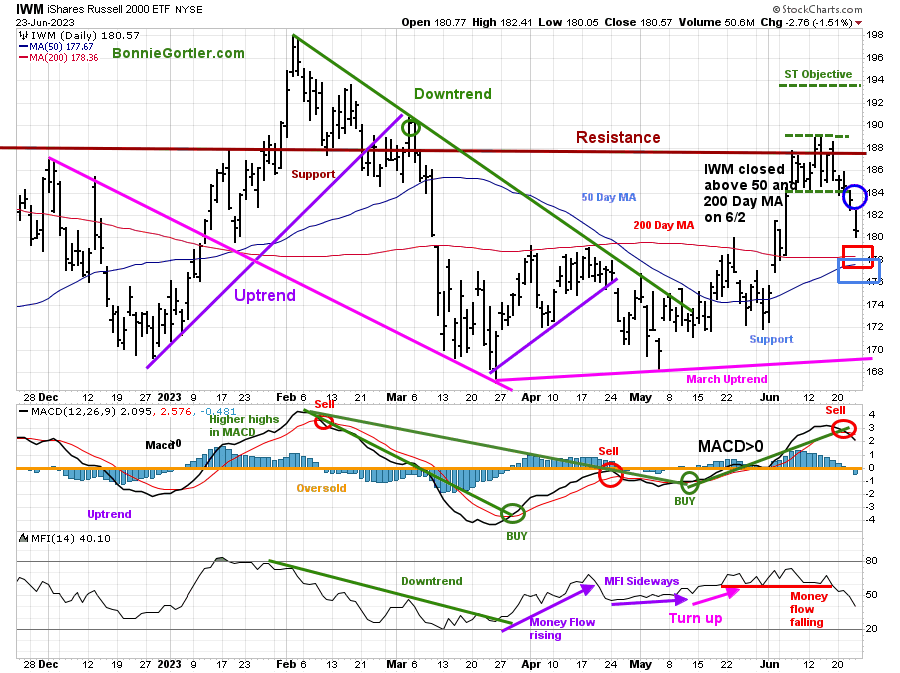
Figure 12: Daily iShares Russell 2000 (IWM) Price (Top) and 12-26-9 MACD (Middle and Money Flow (Bottom)
062323 IWM Daily
Source: Stockcharts.com
The top chart is the daily iShares Russell 2000 Index ETF (IWM), the benchmark for small-cap stocks, with a 50-Day Moving Average (MA) (blue line) and 200-Day Moving Average (MA) (red line) that traders watch and use to define trends.
IWM underperformed the major averages last week, down -2.89%, closing at 180.57 but remaining above the 200-Day MA (red rectangle) and the 50-Day MA (blue rectangle).
Resistance is 184.00, followed by 188.00, where IWM broke down in March. IWM’s short-term objective remains at 193.00. Support is at 177.00 and 169.00.
MACD (middle chart) is on a sell, above 0, and falling. Weekly MACD (chart not shown) remains on a buy.
Money Flow (lower chart) is falling and under support at 50. A turn-up above 50 would be positive.
IWM acted better in early June but is weakening again, which is unfavorable. IWM closing above resistance at 184.00 and then 188.00 would imply a rally towards 193.00. However, a close below 177.00 would suggest a test of the March low.
Nasdaq Touches Upper Channel and Turns Lower
Figure 13: Nasdaq Composite
062323 Nasdaq Composite Daily
Source: Stockcharts.com
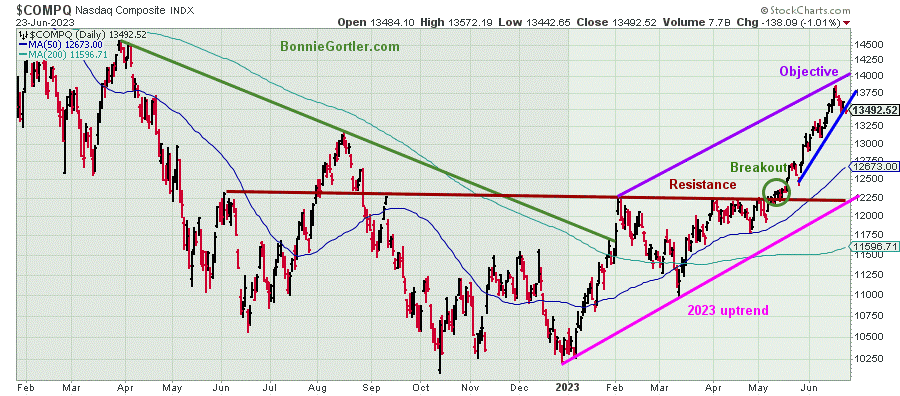
After Nasdaq penetrated resistance of 12300 in May, Nasdaq continued higher in an uptrend, making higher highs and higher lows during its eight-week winning streak.
The winning streak ended last week with the Nasdaq closing at 13492.82, down -1.44% stalling at its upside channel objective at 13850.
Support is at 13250, followed by 12600 and 12250. Resistance is at 14000, followed by 14250 and 14500.
Overhead Resistance Remains
Figure 14: Dow Jones Industrial Average
062323 Dow Jones Industrial Daily
Source: Stockcharts.com
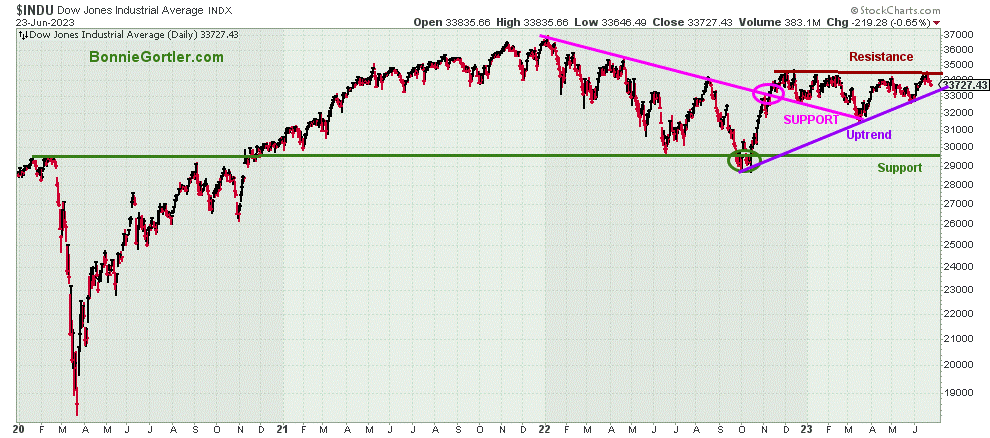
The Dow Jones Industrial Average stalled, down -1.67%, closing at 33727.43, below resistance at 34250. The October uptrend remains in effect.
A close above 34250 could fuel Dow stocks that have underperformed in 2023 and acting much better.
Figure 15: Daily Vaneck Vectors Semiconductors (SMH) Price (Top) and 12-26-9 MACD (Middle) and Money Flow (Bottom)
062323 SMH Daily
Source: Stockcharts.com
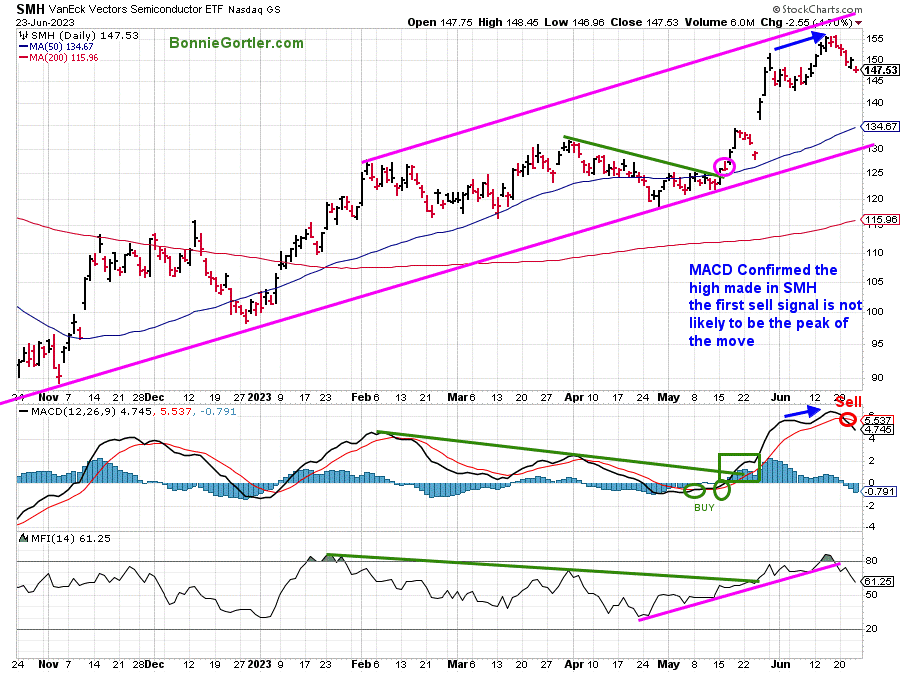
The top chart shows the Daily Semiconductors (SMH) ETF, concentrated mainly in US-based Mega-Cap Semiconductors companies. SMH tends to be a lead indicator for the market when investors are willing to take on increased risk and the opposite when the market is falling.
Semiconductors (SMH) were a weak sector, down -3.80% as momentum waned, leading to a MACD (middle chart) sell last week. Since MACD confirmed the SMH high and no negative divergence, the first sell signal is not likely to be the peak of the move, and another rally attempt could begin.
Money Flow (lower chart) continues to fall after breaking its uptrend (pink line).
One upside objective hit at 155.00. With the slope of the channel rising and the 50 and 200-Day MA rising, there is a good chance SMH will rally towards 155.00 and potentially 160.00. Support is at 145.00, 140.00, 135.00, and 130.00. A close below 130.00 will negate my positive outlook into the end of the quarter.
Figure 16: Daily Invesco QQQ Trust (QQQ) Price (Top) and 12-26-9 MACD (Middle) and Money Flow (Bottom)
062323 QQQ Daily
Source: Stockcharts.com
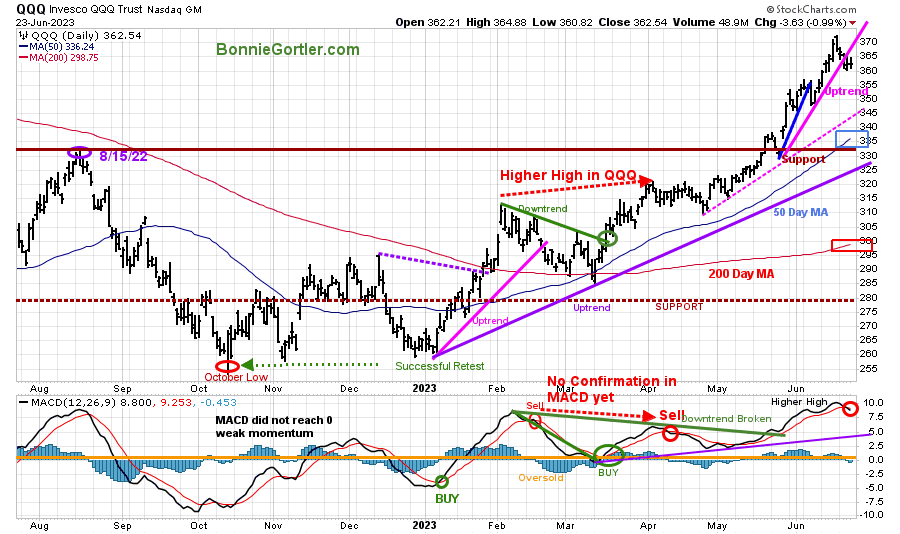
The chart shows the daily Invesco QQQ, an exchange-traded fund based on the Nasdaq 100 Index. QQQ made a low in October 2022 (red circle), followed by a successful retest of the low in early January 2023 and the start of a strong uptrend which remains in effect.
QQQ fell -1.33% last week, closing at 362.54, breaking the May uptrend (pink line). However, QQQ remains above the rising 50-Day Moving Average (blue rectangle) and the 200-Day Moving Average (red rectangle) and, so far, a normal pullback after a significant rise in QQQ.
Support is at 360.00, 345.00, 335.00, and 325.00. Resitance is at 370.00 with an upside objective of 380.00.
The bottom chart is MACD (12, 26, 9), a measure of momentum remains on a sell. However, MACD momentum confirmed the QQQ high, leaving no divergences implying more room to the upside.
Even with the daily weakening momentum patterns, QQQ could continue to rise toward its old high of November 2021 of 404.58 before any significant correction occurs. Potential quarterly window dressing is fast approaching, and the intermediate trend of QQQ remains up (chart now shown), showing a pattern of higher highs and higher lows (see the Market Update 06/02/23 for further analysis).
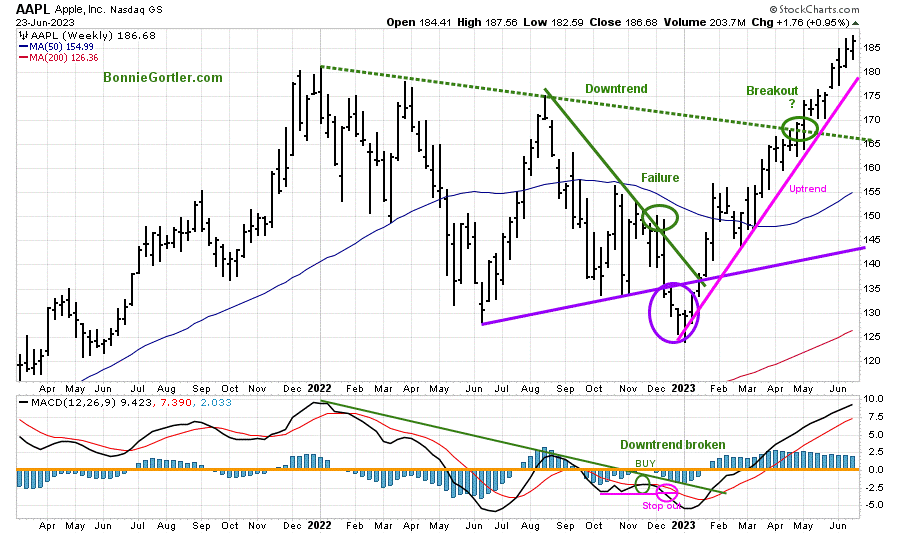
Figure 17: Weekly APPLE (AAPL) Price (Top) and 12-26-9 MACD (Bottom)
062323 AAPL Daily
Source: Stockcharts.com
Apple (AAPL), the largest holding in QQQ, continues its uptrend after breaking the December 2022 downtrend (green dotted line).
MACD remains on a buy, rising with no sign of a sell signal.
The first support is at 180.00, 175.00, followed by 165.00, with an upside target of 205.00.
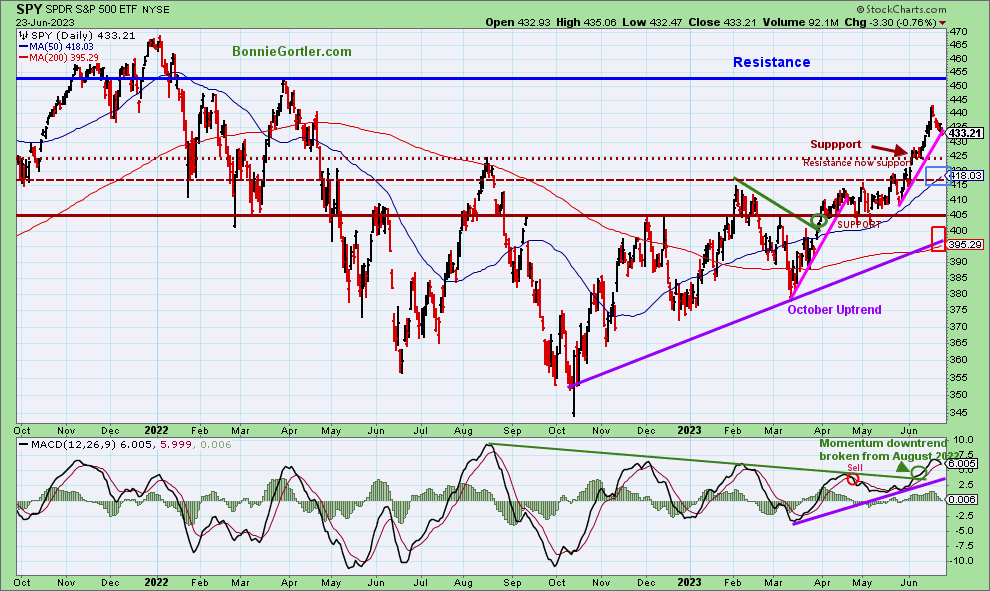
Figure 18: The S&P 500 Index (SPY) Daily (Top) and 12-26-9 MACD (Bottom)
062323 SPY Daily
Source: Stockcharts.com
The S&P 500 (SPY) remains in an uptrend since October 2022.
SPY fell -1.42%, closing at 443.21, above the 50-Day Moving Average (blue rectangle) and the 200-Day Moving Average (red rectangle), a sign of underlying strength.
MACD (bottom chart) remains on a sell with weakening momentum.
Resistance is at 440.00, followed by 452.00. Support is at 430.00, 425.00, 415.00, 405.00, and 395.00.
SPY ended its winning streak, but so far, only a short-term pullback and potentially a buying opportunity.
Summing Up:
The major averages ended lower after profit-taking started early in the week, and further selling continued after unfriendly Fed comments on interest rates. Daily momentum patterns in the major averages and market breadth weakened last week. Watch for an immediate improvement in market breadth on both the NYSE and Nasdaq, implying that this past week was only a short-term pullback toward lower support levels, a test of last week’s breakout, and more upside to follow. The intermediate trend remains up, so with the end of the quarter window dressing likely this week, look for investors and institutions to go bargain hunting before taking time off in July and August, ultimately driving the Dow, S&P 500, and Nasdaq higher.
Remember to manage your risk, and your wealth will grow.
Let’s talk investing. You are invited to set up your Free 30-minute Wealth and Well-Being Strategy session by clicking here or emailing me at Bonnie@BonnieGortler.com. I would love to schedule a call and connect with you.
Disclaimer: Although the information is made with a sincere effort for accuracy, it is not guaranteed that the information provided is a statement of fact. Nor can we guarantee the results of following any of the recommendations made herein. Readers are encouraged to meet with their own advisors to consider the suitability of investments for their own particular situations and for determination of their own risk levels. Past performance does not guarantee any future results.


Create more wealth in your life
with these simple strategies.
As an added bonus you will also
receive BG’s Updates and Ezine

Discover how to quickly create more well-being in your life with these simple strategies.
As an added bonus you will also
receive BG’s Updates and Ezine

As an added bonus you will receive BG’s Updates and Ezine

All work listed on BonnieGortler.com is licensed under a Creative Commons Attribution - Noncommercial - No Derivative Works 3.0 Unported License.


Free Report:
Grow and Sustain Your Wealth
Discover how to grow your money with these easy, simple steps.

