

Bonnie’s Market Update 5/15/26
05/17/2026
The market closed with a bang Friday, with all eleven S&P SPDR sectors finishing higher for the week. Consumer Discretionary (XLY) and Real Estate (XLC) were the best sectors, while Utilities (XLU ) and Consumer Staples lagged (XLP), the SPDR S&P 500 ETF Trust (SPY) up +1.88%.
S&P SPDR Sector ETFs Performance Summary 5/26/23-6/2/23
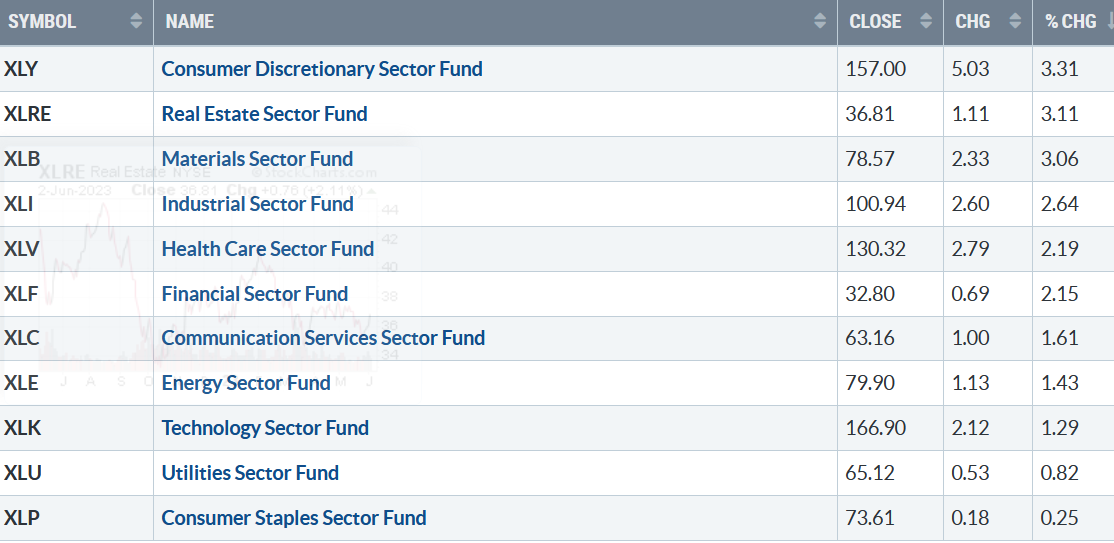
060223 SPDR Sectors
Source: Stockcharts.com
Figure 2: Bonnie’s ETFs Watch List Performance Summary 5/26/23-6/2/23
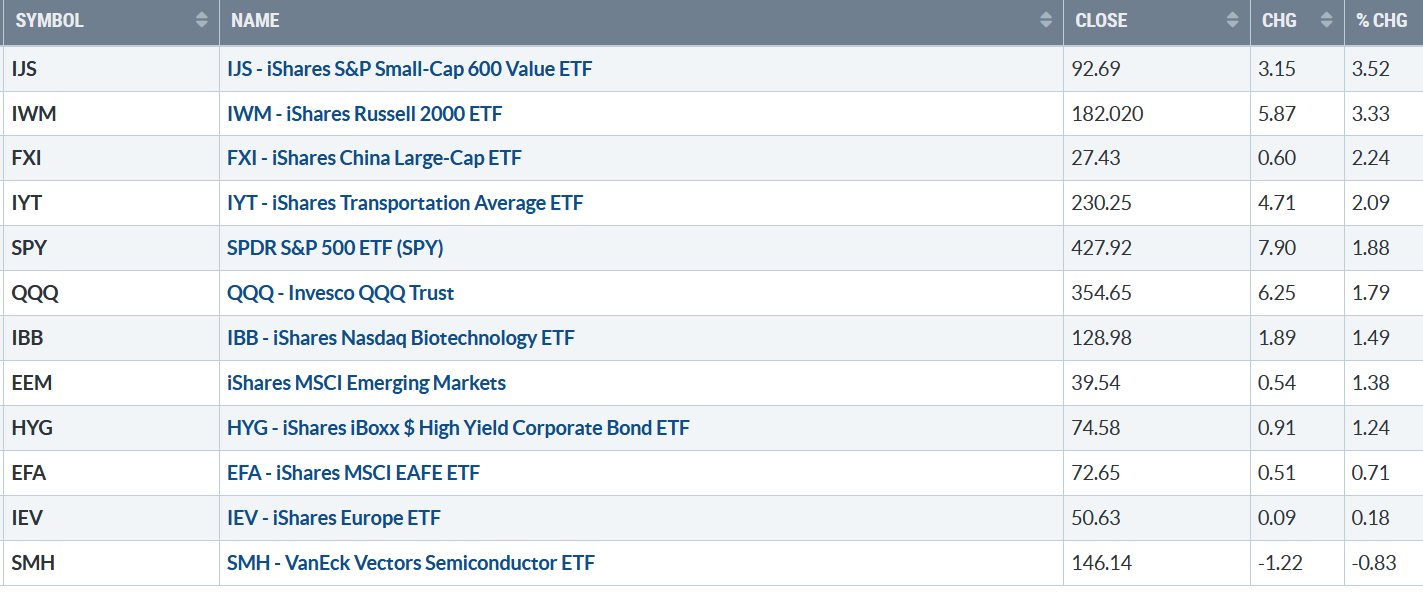
060223 Week ETFs
Source: Stockcharts.com
Small Cap Value and Growth came to life, finishing strong Friday. Semiconductors lagged and finished down for the week as investors began rotating to the weaker market sectors underperforming in 2023.
Figure 3: CBOE Volatility Index VIX
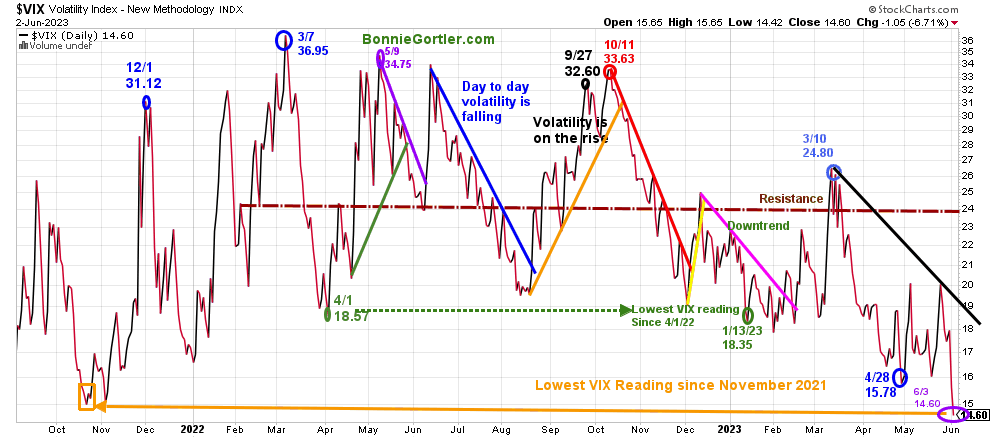
060223 VIX Daily
Source: Stockcharts.com
The CBOE Volatility Index (VIX), a measure of fear, traded above 20.00 for most of 2022, with a high at 36.95 on 3/7 (blue circle) and a low on 4/1/22 at 18.57 and then a new VIX low did not occur until 1/13/23 at 18.35 (green circle).
The volatility Index (VIX) fell sharply, closing at 14.60 (purple circle), a new low for 2023 and below November 2021 low.
Intraday volatility will likely remain low until VIX closes above 20.00 and then closes above 24.00.
Figure 4: UST 10YR Bond Yields Daily
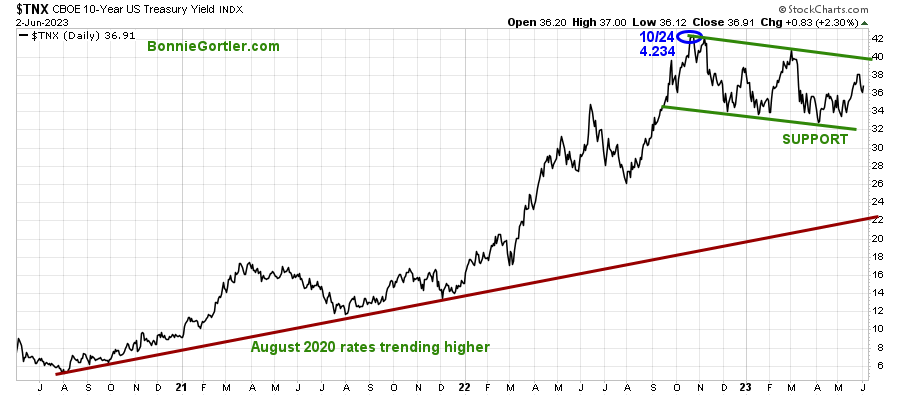
060223 UST 10 Yr Bond Yields Daily
Source: Stockcharts.com
The 10-Year U.S. Treasury yields fell last week, closing at 3.691%. Support remains at 3.20%, with resistance at 4.00%. Yields rising above 4.00% would likely put pressure on equities.
The major market averages were all higher last week. The Dow rose +1.86%, the S&P 500 up +1.83%, and the Nasdaq gained +2.04%, its 6th positive week in a row and the longest winning streak since 2020. The Russell 2000 Index rose +3.26%, as the rally broadened as investors rotated into sectors that have lagged.
Figure 5: Value Line Arithmetic Average
060223 VLE Daily
Source: Stockcharts.com
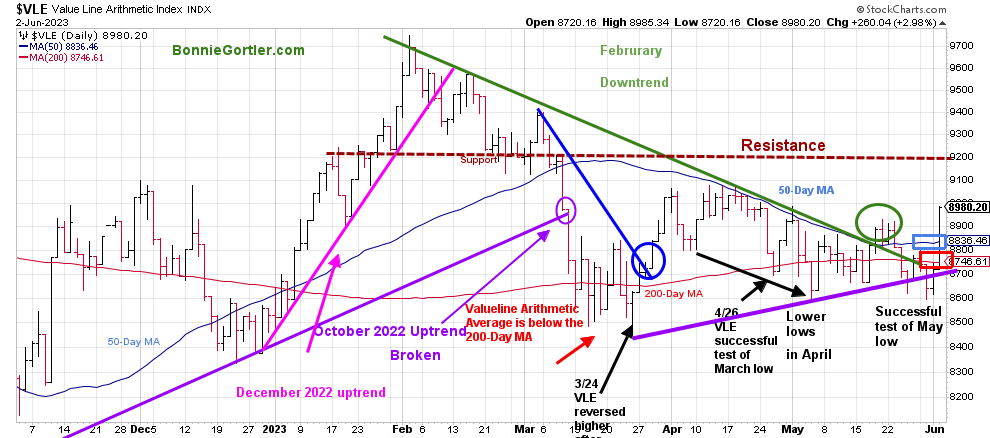
The Value Line Arithmetic Index ($VLE) is a mix of approximately 1700 stocks. VLE broke the October 2022 uptrend in early March, headed lower, and on 3/24, bottomed and reversed higher. In April and May, there were successful tests of the low.
VLE closed strong (orange circle) near the high on Friday, up +2.46% as the stock market rally broadened, and VLE closed above the May highs, the 50-Day MA (blue rectangle), and the 200-Day MA implying strength.
Key resistance remains at 9200, and support is at 8800, 8700, and 8600.
Two closes above 9200 would confirm further gains toward 9400 and 9700. On the other hand, it would be negative if the Value Line Index closed below the 3/24 low at 8466, a warning a significant decline could begin.
Let’s talk investing. You are invited to set up your Free 30-minute Wealth and Well-Being Strategy session by clicking here or emailing me at Bonnie@BonnieGortler.com. I would love to schedule a call and connect with you.
Market breadth improved last week.
Weekly market breadth was positive on the New York Stock Exchange Index (NYSE) and for the Nasdaq. The NYSE had 2500 advances and 592 declines, with 138 new highs and 181 new lows. There were 3344 advances and 1539 declines on the Nasdaq, with 273 new highs and 339 new lows.
For the advance to accelerate higher and broaden to other sectors, you want to see an expansion in the weekly number of New Highs and the number of weekly New Lows to contract.
Figure 6: NYSE Cumulative Advance-Decline Line and New York Stock Exchange Index (Below)
060223 Daily NYSE Cumulative Advance-Decline Line and NYSE
Source: Stockcharts.com
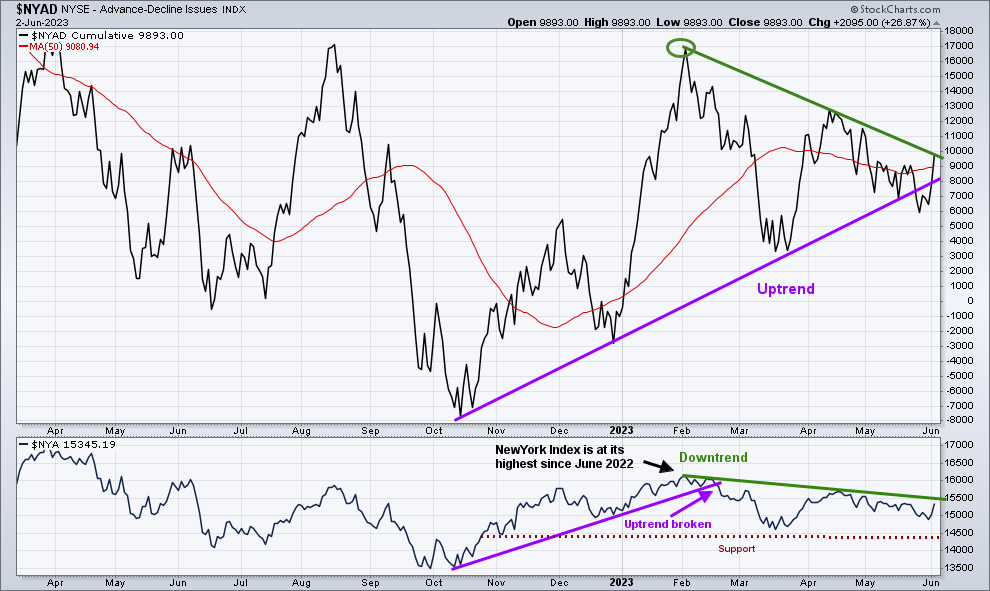
The top chart is the Cumulative Advance-Decline Line (AD Line) of the NYSE, a breadth indicator based on the number of advancing stocks minus the number of declining stocks. The NYSE AD Line peaked in February 2023 (green circle top chart) and then declined as the S&P 500 and Nasdaq rose.
The uptrend from October broke the previous week, but as I wanted to see occur, there was an immediate improvement in the NYSE Advance-Decline Line last week. It will be positive in the short term if the downtrend in the AD-Line from February (green line) and the New York Index (lower chart) break the downtrend this week.
Learn more about charting in my FreeTraining, Charting Strategies to Cut Risk and Trade with the Trend. Sign up here
Nasdaq breadth remains below resistance.
Figure 7: Nasdaq Advance Decline Line Daily (Top) and Nasdaq (Bottom)
060223 Daily Nasdaq Cumulative Advance-Decline Line
Source: Stockcharts.com
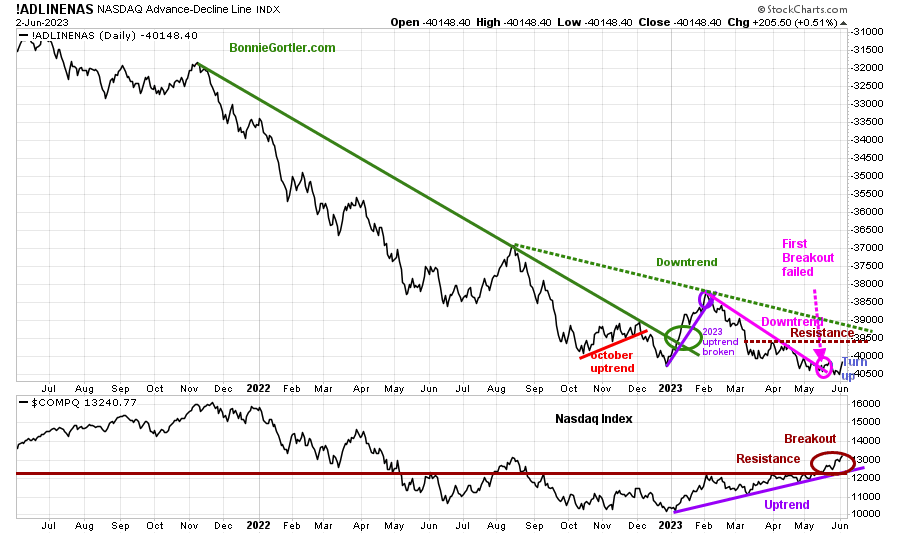
The chart is the Nasdaq Daily Advance-Decline Line, a technical indicator that plots the difference between the number of advancing and declining stocks.
In January, the October 2022 downtrend was broken (solid green line), however, the improvement in the market breadth was short-lived, with the Nasdaq Advance-Decline line deteriorating in February 2023.
In May (pink circle top chart), the first downtrend breakout failed and turned down without breaking the August downtrend (green dotted line), as Nasdaq continues to rise.
Last week the AD-Line turned up. I would like to see strong market breadth where the AD-Line first gets through resistance (brown dotted line and then breaks the August downtrend (green dotted line) to confirm more stocks will participate in the advance other than Mega Cap Technology stocks.
Figure 8: Daily New York Stock Exchange (NYSE) New Lows
060223 NYSE New Lows Daily
Source: Stockcharts.com
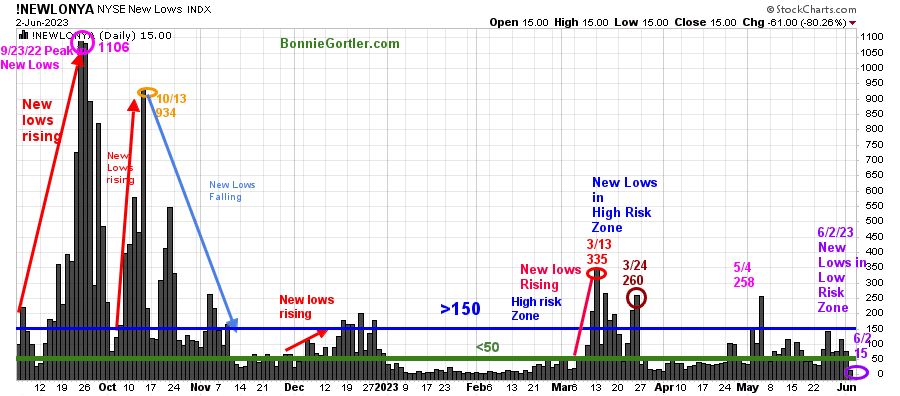
Watching New Lows on the New York Stock Exchange is a simple technical tool that helps awareness of the immediate trend’s direction.
New lows warned of a potential sharp pullback, high volatility, and “panic selling” for most of 2022, closing above 150. The peak reading was 9/23/22 when New Lows made a new high of 1106 (pink circle), and New Lows expanded to their highest level in 2023 on 3/13 (red circle) to 335, which have not been taken out in late March or during the weakness in early May.
It was positive New Lows fell last week, closing at 15 (purple circle), and is now in the lowest-risk zone below 25.
For a sustainable rally, I want New Lows to stay in the lowest risk zone below 25 and see an increase of New Highs to more than 203. On the other hand, two closes above 150 New Lows would imply an increased risk of a decline forthcoming.
Learn more about the significance of New Lows in my book, Journey to Wealth, published on Amazon. If you would like a preview, get a free chapter here.
Learn more about charting in my Free 33-minute training. Sign up here.
Small Caps were strong last week.
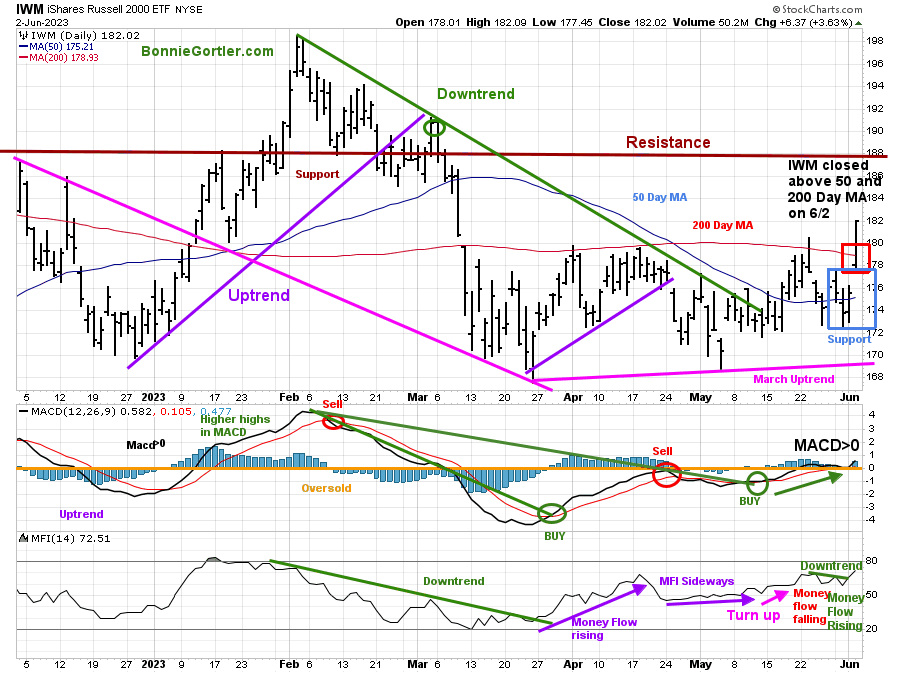
Figure 9: Daily iShares Russell 2000 (IWM) Price (Top) and 12-26-9 MACD (Middle and Money Flow (Bottom)
060223 IWM Daily
Source: Stockcharts.com
The top chart is the daily iShares Russell 2000 Index ETF (IWM), the benchmark for small-cap stocks, with a 50-Day Moving Average (MA) (blue line) and 200-Day Moving Average (MA) (red line) that traders watch and use to define trends.
IWM outperformed the major averages last week, up +3.33%, closing at 182.02, penetrating resistance of 180.00, closing at its highs, helped by Regional Banks strength on Friday, gaining +6.16%.
IWM closed above, the 200-Day MA (red rectangle) and the 50-Day MA (blue rectangle) implying underlying strength. Resistance remains at 188.00, where IWM broke down in March, and support is at 180.00, 175.00, and 172.00.
MACD (middle chart) is on a buy, above 0, and is rising, making a higher high than late May, which is positive.
Money Flow (lower chart) broke the May downtrend and is rising a positive sign.
IWM closed above 180.00 for the first time since March, and it would be favorable and likely to attract more buying if IWM can close above resistance at 188.00 with MACD and Money Flow continuing to rise.
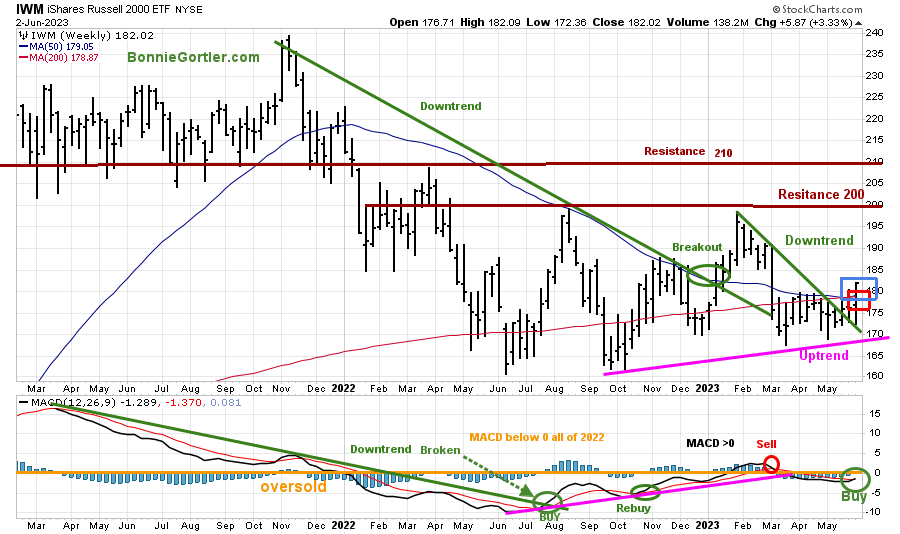
Figure 10: Weekly iShares Russell 2000 (IWM) Price (Top) and 12-26-9 MACD (Bottom)
060223 IWM Weekly
Source: Stockcharts.com
Investors went bargain hunting in the Russell 2000 (IWM) last week, and IWM remains above its weekly downtrend from January and closed above the 50 and 200-week Moving Average at its highest level since March.
Support is at 180.00,175.00, and 168.00. Resistance is at 190.00, 200.00, and 210.00.
MACD, (a measure of momentum) generated a buy last week and is rising.
In Sum:
The worst of the decline appears to be over in IWM. Higher prices are ahead unless IWM closes below the weekly uptrend at 168.00, negating my positive outlook and implying a decline toward the October 2022 low.
Nasdaq continues higher
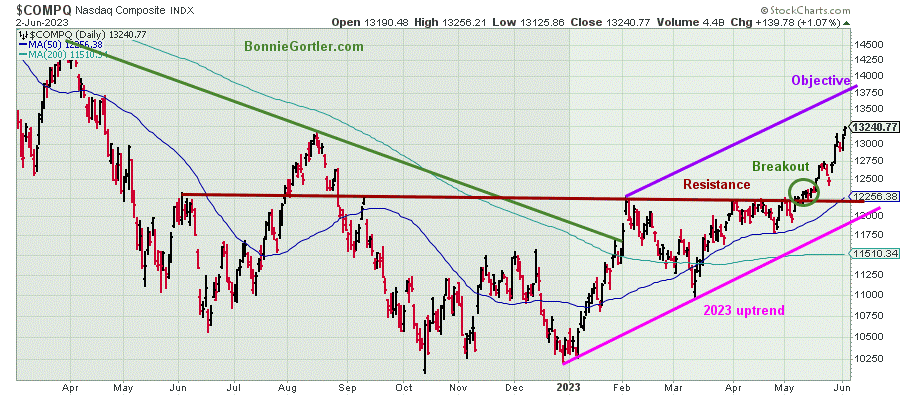
Figure 11: Nasdaq Composite
060223 Nasdaq Composite Daily
Source: Stockcharts.com
After Nasdaq penetrated resistance of 12300, it continued to move higher in an uptrend, making higher highs and higher lows.
Nasdaq closed at 13240.77, up 2.04% last week.
The upside channel objective is 13750, with support at 12250.
Overhead Resistance Remains
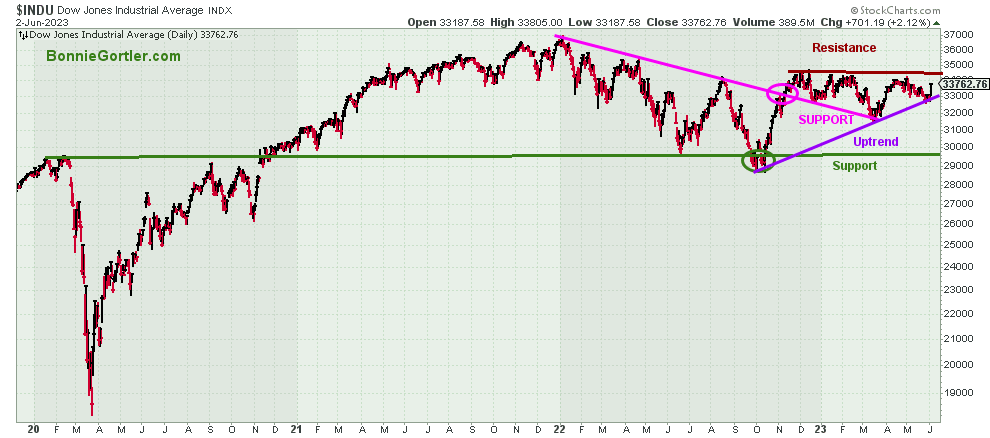
Figure 12: Dow Jones Industrial Average
060223 Dow Jones Industrial Daily
Source: Stockcharts.com
The Dow Jones Industrial Average was strong last week, gaining 2.12%, as investors bought Dow stocks that underperformed in 2023, closing at 33762.76, remaining below resistance at 34250. A close above 34250 for two days could fuel further gains in Dow stocks as investors rotate out of strong performers in 2023 into Dow stocks that have underperformed.
Figure 13: Daily Vaneck Vectors Semiconductors (SMH) Price (Top) and 12-26-9 MACD (Middle) and Money Flow (Bottom)
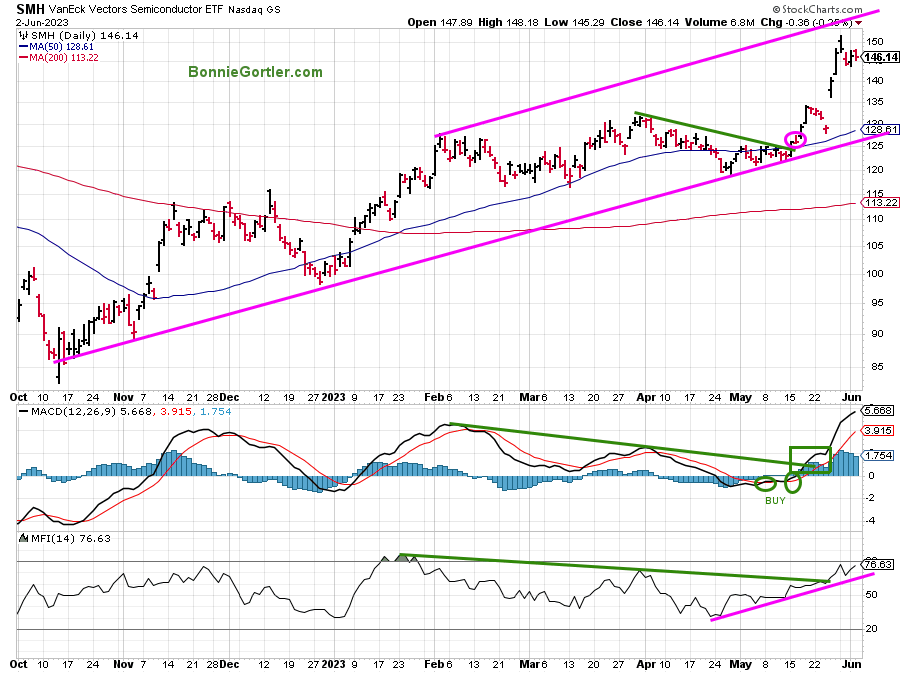
052623 SMH Daily
Source: Stockcharts.com
The top chart shows the Daily Semiconductors (SMH) ETF, concentrated mainly in US-based Mega-Cap Semiconductors companies. SMH tends to be a lead indicator for the market when investors are willing to take on increased risk and the opposite when the market is falling.
Semiconductors (SMH) fell last week by -0.83 % after gaining almost 20% in two weeks, but SMH did not give up much ground since breaking its April daily downtrend in May.
Its positive MACD (middle chart) confirms the new high and that Money Flow (lower chart) continues to rise after breaking the January downtrend (green line) and is in an uptrend.
The daily channel objective remains 155.00, with support at 140.00, 135.00, and 125.00.
SMH Relative Strength vs. QQQ turns down after making a new high
Figure 14: VanEck Vectors Semiconductor/Invesco QQQ Trust (SMH/QQQ) Weekly Relative Strength Index Ratio
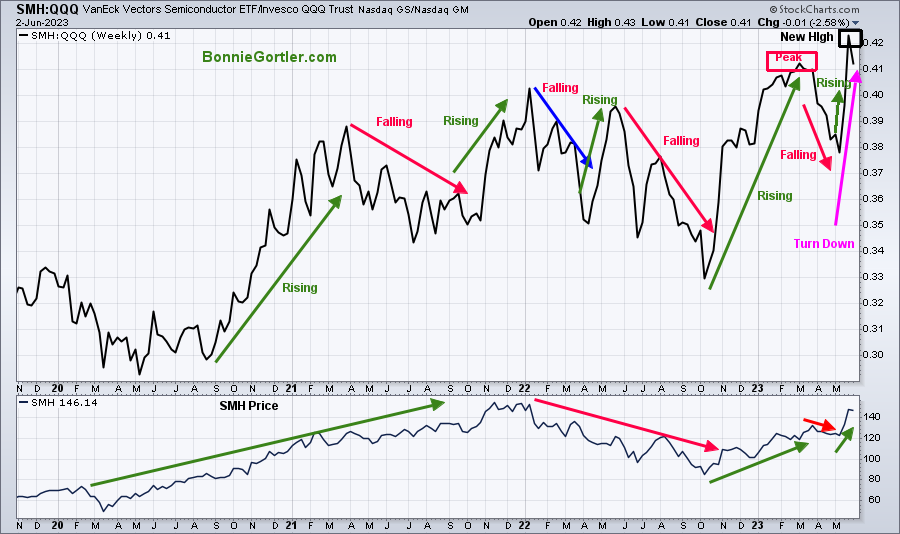
060323 SMH QQQ Weekly Relative Strength Ratio
Source: Stockcharts.com
The top part of the chart is the weekly VanEck Vectors Semiconductor/Invesco QQQ Trust (SMH/QQQ) Index Ratio. A rising line means the SMH is stronger, and if falling, the QQQ is stronger.
The SMH/QQQ ratio peaked in March, followed by a new high in May. However, notice how last week, Semiconductors underperformed QQQ, and the (SMH/QQQ) Index Ratio turned down. If this relationship continues, look for potential weakness in SMH or consolidation after the recent gains, which could spread to the Technology Sector.
Do you like charts, I invite you to join my FB group Wealth Through Market Charts.
Figure 15: Daily Invesco QQQ Trust (QQQ) Price (Top) and 12-26-9 MACD (Middle) and Money Flow (Bottom)
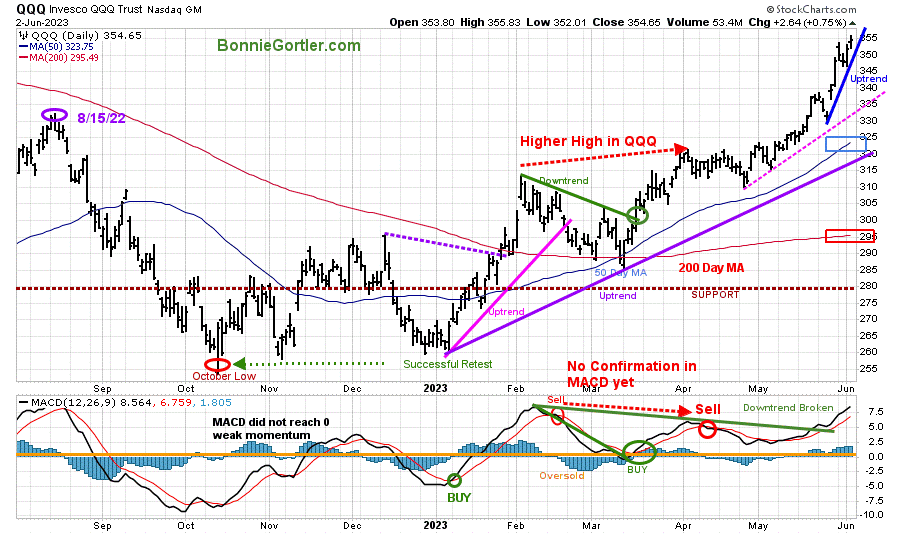
060223 QQQ Daily
Source: Stockcharts.com
The chart shows the daily Invesco QQQ, an exchange-traded fund based on the Nasdaq 100 Index. QQQ made a low in October 2022 (red circle), followed by a successful retest of the low in early January 2023 and the start of a strong uptrend which remains in effect.
QQQ rose +1.79% last week, closing at 354.65, near its high for the week, well above the 50-Day Moving Average and the 200-Day Moving Average (red rectangle).
QQQ continues strengthening above the old high made in August 2022 (purple circle) after penetrating old resistance at 331.16. Support is at 340.00, 335.00, and 325.00.
The bottom chart is MACD (12, 26, 9), a measure of momentum remains on a sell because MACD didn’t fall below 0. It’s favorable if MACD continues to rise, breaking the February downtrend and taking out the April highs confirming the high made-in price.
Figure 16: Weekly Invesco QQQ Trust (QQQ) Price (Top) and 12-26-9 MACD (Bottom)
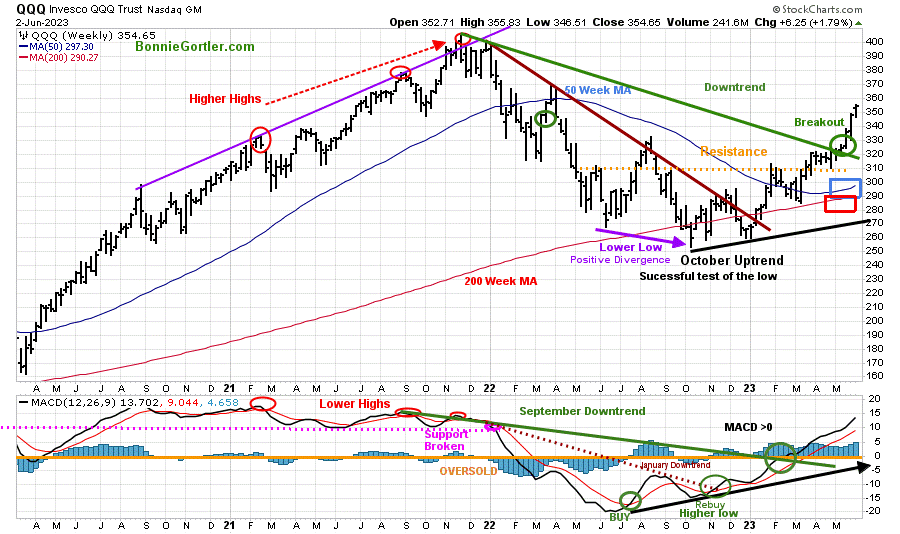
060223 QQQ Weekly
Source: Stockcharts.com
The intermediate trend remains up, QQQ broke the November 2022 weekly price downtrend (green line top chart) and continues to trend higher.
Its positive QQQ continues its pattern of higher lows and higher highs, closing above the 50 and 200 Week MA and remaining above the old resistance at 310.00 (orange dotted line), acting as key significant support.
MACD remains above 0, rising to a new high, confirming the breakout in QQQ.
In Sum:
QQQ is likely to rise towards 360.00 and potentially 370.00 if the pattern of higher highs and higher lows continues.
Figure 17: The S&P 500 Index (SPY) Daily (Top) and 12-26-9 MACD (Bottom)
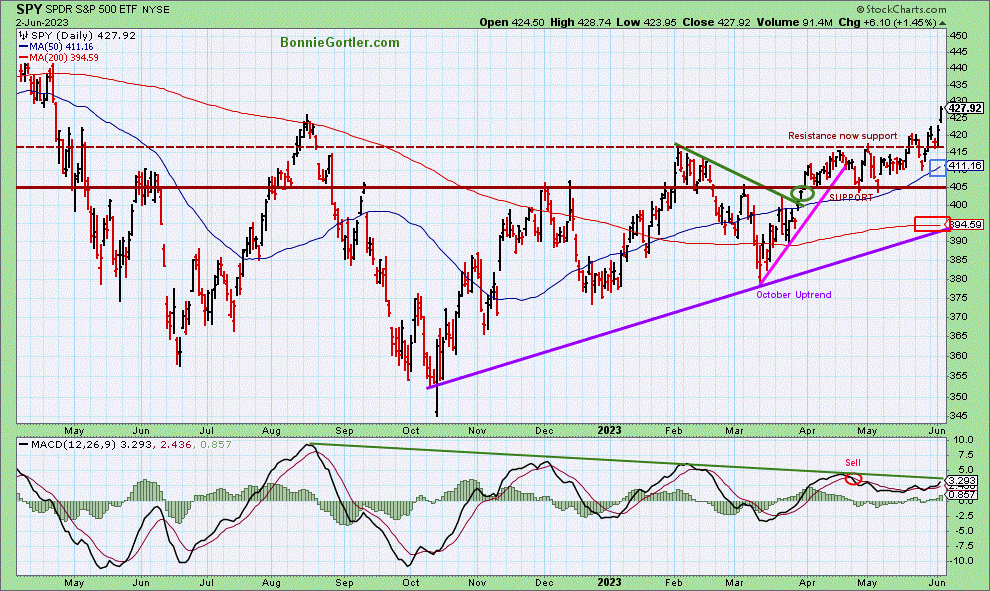
060223 SPY Daily
Source: Stockcharts.com
The S&P 500 (SPY), in an uptrend from October 2022, rose for the third straight week.
SPY rose +1.88 %, closing near its high for the week after penetrating resistance at 325.00, now acting as support.
SPY closed above the 50-Day Moving Average (blue rectangle) and the 200-Day Moving Average (red rectangle), a sign of underlying strength.
MACD (bottom chart) remains on a sell as it never went below 0 to generate a new buy.
Resistance is at 440.00. Support is at 425.00, 415.00, 405.00, and 395.00
The bulls are in control as long as SPY remains above 395.00.
Strength in Small, Mid, and Micro Caps is positive.
Figure 18: Daily SPDR S&P 500 ETF Trust (SPY), (Top) and below SPDR S&P MidCap 400 (MDY), iShares Core S&P Small-Cap (IJR), and iShares Micro-Cap (IWC) ETF
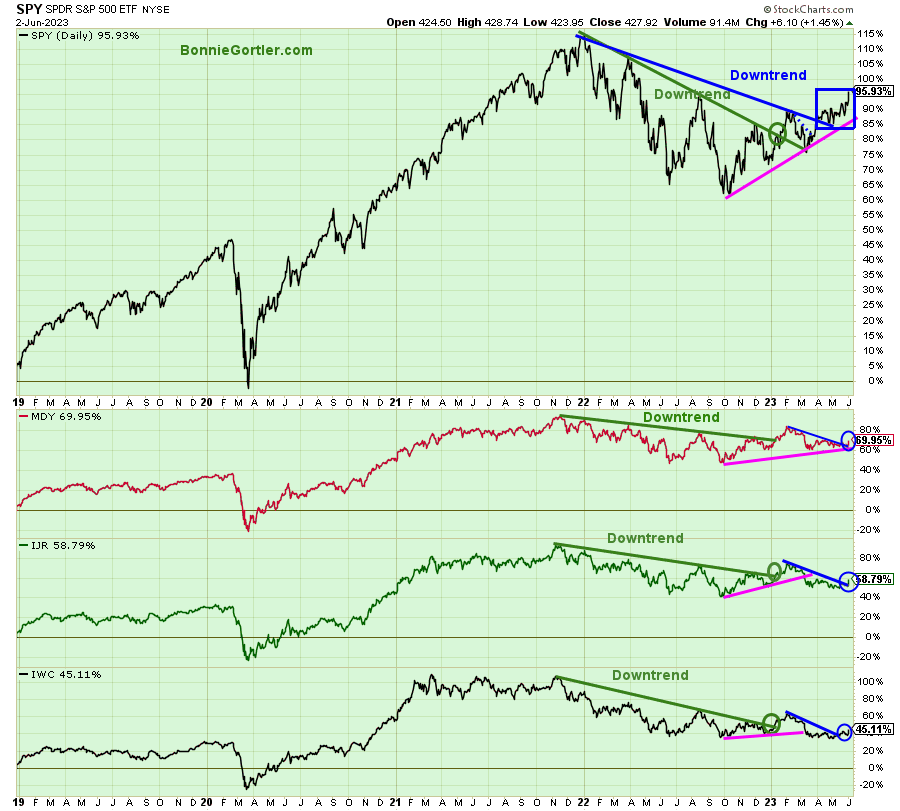
06023 SPY MDY, IJR, and IWC ETF Daily
Source: Stockcharts.com
The above chart is The SPDR S&P 500 ETF Trust (SPY), SPDR S&P MidCap 400 ETF (MDY), iShares Core S&P Small-Cap (IJR), and iShares Micro-Cap (IWC).
All four ETFs broke the longer-term downtrends earlier this year (green lines), but there was no significant follow-through other than the S&P 500 (SPY).
Last week Small and Mid-Cap stocks outperformed the S&P 500 (SPY), which is bullish short term, and all ETFs closed above their downtrends (blue line and circle).
MDY gained +3.23%, IWC was up +3.52%, and IJR was up 3.12%.
To confirm the breakout, you want to see this phenomenon continue where MDY, IJR, and IWC are stronger than the SPY.
Summing Up:
The major averages rose last week to start June with the U.S. debt ceiling agreement completed. It’s bullish the rally expanded into Small and Mid-Cap stocks leading the market higher. Technology and Semiconductors remain in an uptrend but are short-term overbought, so the pace of gains may slow as investors go bargain-hunting into other market sectors. Taking some profits is okay, but it’s too early to go short with positive momentum patterns and higher upside objectives. The bulls remain in control until proven otherwise.
Remember to manage your risk, and your wealth will grow.
Let’s talk investing. You are invited to set up your Free 30-minute Wealth and Well-Being Strategy session by clicking here or emailing me at Bonnie@BonnieGortler.com. I would love to schedule a call and connect with you.
Disclaimer: Although the information is made with a sincere effort for accuracy, it is not guaranteed that the information provided is a statement of fact. Nor can we guarantee the results of following any of the recommendations made herein. Readers are encouraged to meet with their own advisors to consider the suitability of investments for their own particular situations and for determination of their own risk levels. Past performance does not guarantee any future results.


Create more wealth in your life
with these simple strategies.
As an added bonus you will also
receive BG’s Updates and Ezine

Discover how to quickly create more well-being in your life with these simple strategies.
As an added bonus you will also
receive BG’s Updates and Ezine

As an added bonus you will receive BG’s Updates and Ezine

All work listed on BonnieGortler.com is licensed under a Creative Commons Attribution - Noncommercial - No Derivative Works 3.0 Unported License.


Free Report:
Grow and Sustain Your Wealth
Discover how to grow your money with these easy, simple steps.

