

10 Simple Tips for Financial Well-Being
07/01/2026
Choppy trading frustrated both the bulls and the bears last week, with only two S&P SPDR sectors rising. Energy (XLE) and Industrials (XLI) were the strongest, while Real Estate (XLRE) and Health Care (XLV) were the weakest. The SPDR S&P 500 ETF Trust (SPY) fell by -1.14%.
5/27/22 – 6/3/22
S&P SPDR Sector ETFs Performance Summary
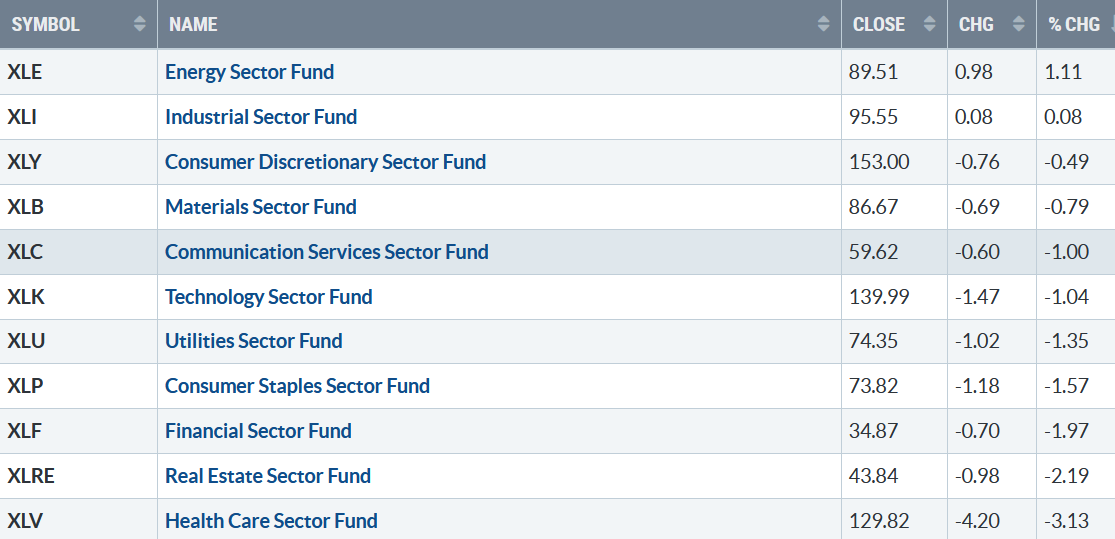
60322 Sectors Week
Source: Stockcharts.com
Figure 2: Bonnie’s Mix of ETFs
Performance Summary 5/27/22 – 6/3/22
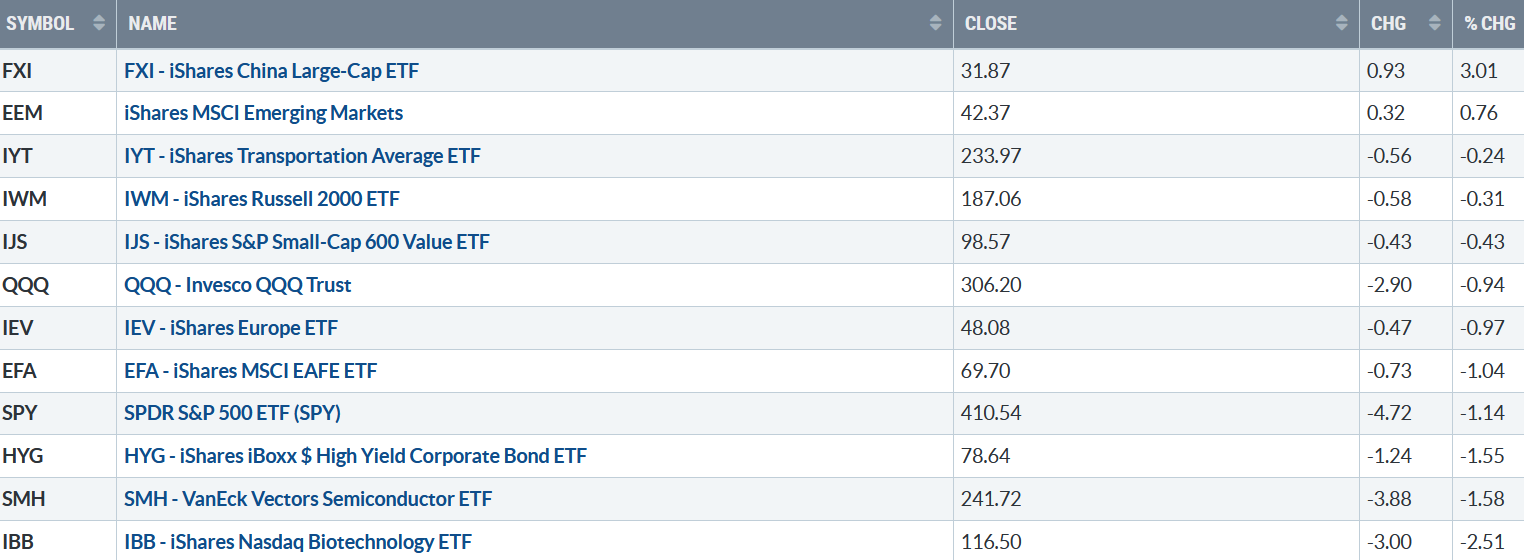
60322 Week ETFs
Source: Stockcharts.com
International markets outperformed the U.S. market. Semiconductors and Biotechnology, high-risk sectors, were under selling pressure. Small Cap stocks, both Growth and Value, fared better than the S&P 500, which, if this trend continues, is bullish for the overall market.
Market sentiment of the CNBC Fear and Greed Index (a contrary indicator) ended the week showing fear, no longer extreme fear. The AAII Sentiment Survey, another contrary indicator, rose from its extreme low optimism reading last week but remains below its historical average.
Figure 3: UST 10YR Bond Yields Daily
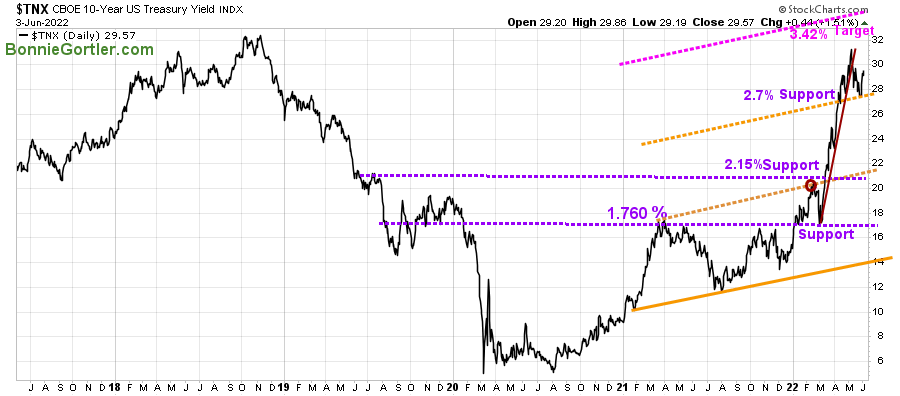
60322 UST 10 Yr Bond Yields Daily
Source: Stockcharts.com
The 10-Year U.S. Treasury yields rose after falling the last three weeks, closing at 2.957%. The upside target remains at 3.42%.
Figure 4: UST 5YR Bond Yields Daily
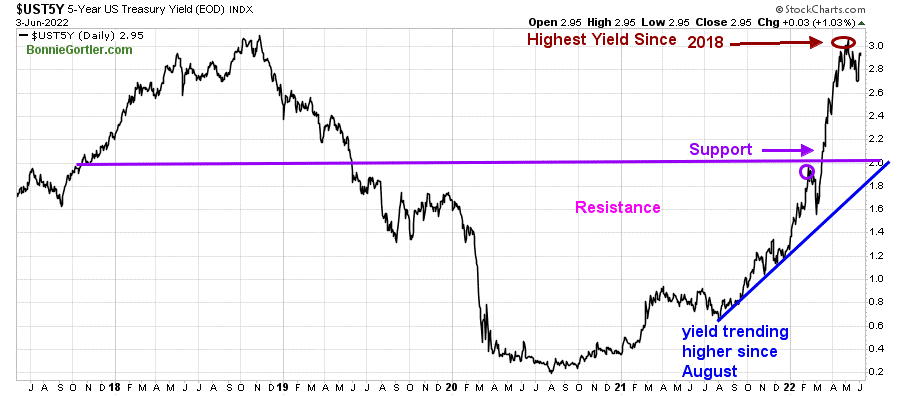
60322 UST 5 Yr Bond Yields Daily
Source: Stockcharts.com
The 5 Year U.S Treasury yield also rose last week, closing at 2.95%,
For the week, The Dow fell -0.94%. The S&P 500 was down -1.20%, and the Nasdaq fell -0.98%. The Russell 2000 Index fell the least, only -0.26%, while The Value Line Arithmetic Index (a mix of approximately 1700 stocks was lower by -0.70%.
Weekly market breadth was negative for the New York Stock Exchange Index (NYSE) and Nasdaq. The NYSE had 1520 advances and 1977 declines with 155 new highs and 112 new lows. There were 2462 advances and 2791 declines on the Nasdaq, with 114 new highs and 436 new lows. Despite negative breadth for the NYSE and Nasdaq, new lows contracted, which is a positive sign for the future, especially if this trend continues.
Figure 5: Nasdaq Advance Decline Line (Daily)
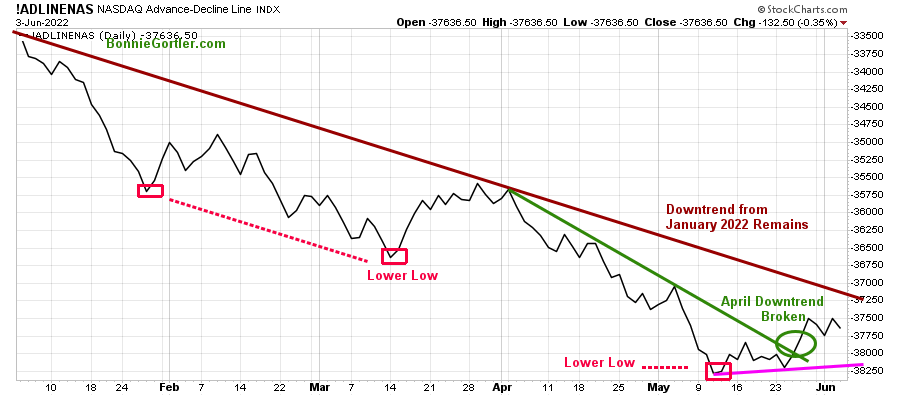
60322 Daily Nasdaq AD-Line
Source: Stockcharts.com
There was a significant improvement in breadth the previous week, breaking its April downtrend (green line), but last week there was no follow through, and the January downtrend remains.
For a sustainable rally over the intermediate term (weeks to months), continued positive breadth is necessary over the next few weeks, ultimately breaking the January downtrend (brown line). On the other hand, if market breadth weakens and the latest low is violated, it will be a clue another leg down is likely.
Trading Tip

Bonnie Gortler Trading Tip
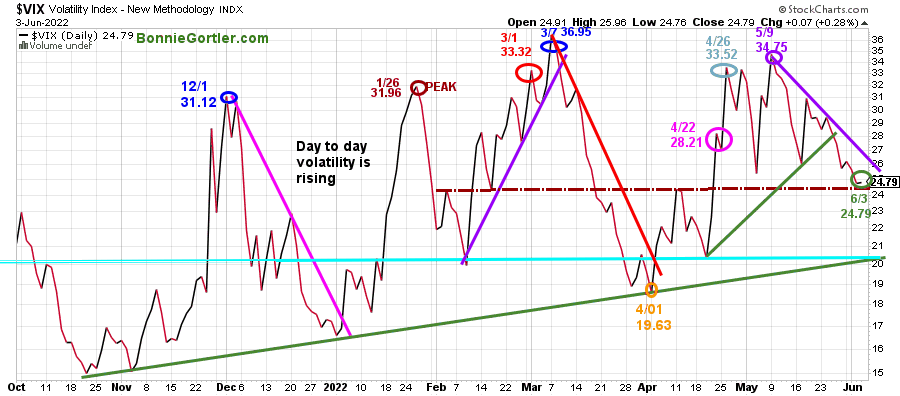
Figure 6: CBOE Volatility Index VIX
60322 VIX Daily
Source: Stockcharts.com
The CBOE Volatility Index ($VIX), a measure of fear, has been trading above 20.00 for most of 2022. In January, VIX made a high at 31.96 on 1/26 (brown circle), on 3/1 at 33.32 (red circle), and peaked at 36.95 on 3/7 (blue circle). VIX, through the sell-off, remained below the March peak.
VIX fell for the third week in a row showing no increased fear, despite the major averages closing lower for the week. VIX closed at 24.79 (green circle), slightly above support at 24.00 (brown dotted line).
Intraday volatility will be less if VIX falls below the 4/01 April low (orange circle) at 19.63. On the other hand, a close above 31 will imply increased day-to-day volatility.
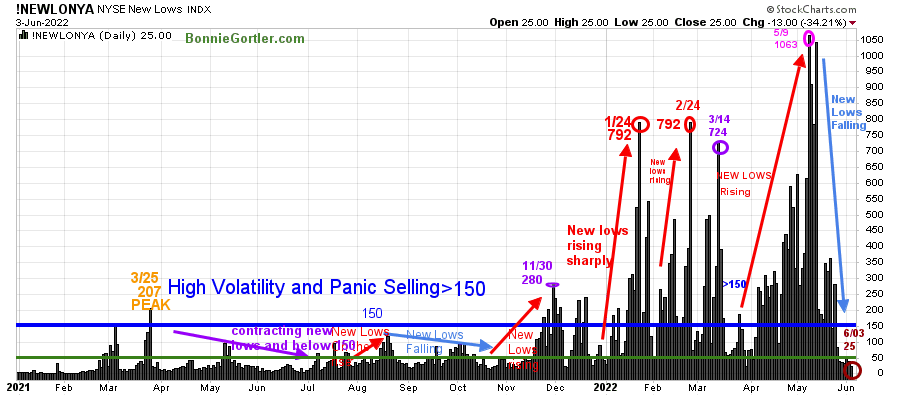
Figure 7: Daily New York Stock Exchange (NYSE) New Lows
60322 NYSE New LOWS Daily
Source: Stockcharts.com
Watching New lows on the New York Stock Exchange is a simple technical tool that helps awareness of the immediate trend’s direction.
New lows warned of a potential sharp pullback, high volatility, and “panic selling” for most of 2022, closing above 150. As the market started to move lower in January, New Lows rose sharply, peaking at 792 on 1/24 (red circle), and then contracted before rising again on 2/24, matching the 1/24 peak, implying the risk increased of further selling pressure. Investors in early May continued to unload stocks, and New Lows made a new high for 2022 of 1063 on 5/9 (pink circle).
Learn more about the significance of New Lows in my book, Journey to Wealth, published on Amazon. Here is an excerpt, The market is very strong when the New Lows are below 25 (Very Low Risk and prices tend to rise). When New Lows are between 25 and 50, the risk is low, and prices tend to rise.
Despite a weaker stock market last week, its bullish New Lows didn’t expand and fell, closing at 25.00 on 6/3 (brown circle), implying Very Low Risk, and prices tend to rise.
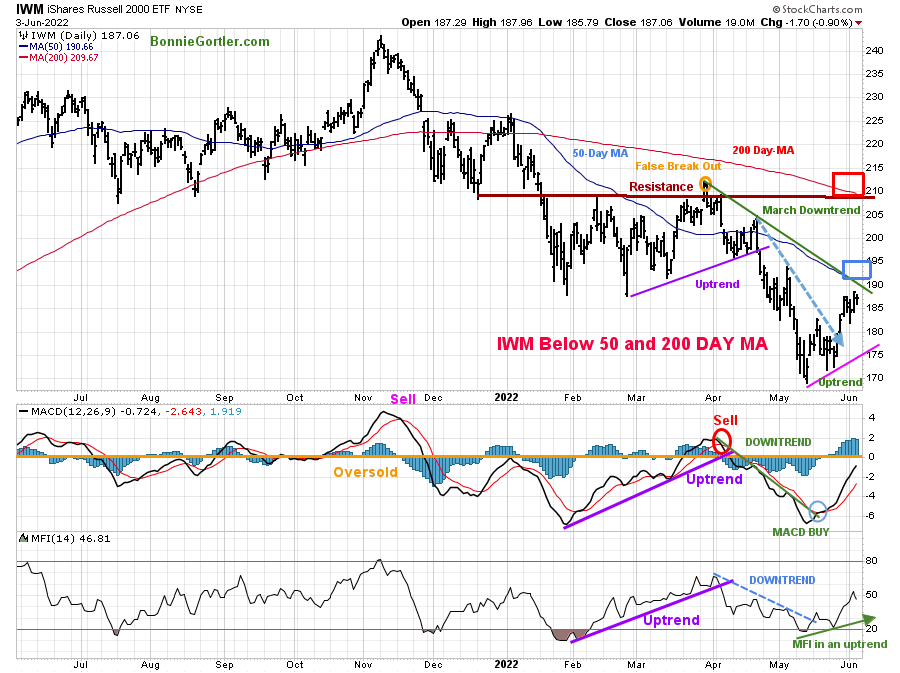
Figure 8: Daily iShares Russell 2000 (IWM) Price (Top) and 12-26-9 MACD (Middle) and Money Flow (Bottom)
60322 IWM Daily
Source: Stockcharts.com
The top portion of the chart is the daily iShares Russell 2000 Index ETF (IWM), the benchmark for small-cap stocks, with a 50-Day Moving Average (MA) (blue line) and 200-Day Moving Average (MA) that traders watch and use to define trends.
At the end of March, IWM failed to break out above resistance at 210.00 (orange circle) and turned sharply lower, forming a downtrend (green line).
IWM’s short-term trend remains up. After rising +6.57% the previous week and breaking the April downtrend (blue dotted line), IWM closed at 187.08, down only -0.31% for the week, closing above support at 183.00.
IWM still has more work to do to close above the 50 and 200-Day Moving Averages (blue and red rectangle). If IWM breaks the March downtrend (green line), closing above 190, IWM will likely move even higher.
Short-term resistance is 190.00, 195.00, 205.00, and 210.00. Support remains at 183.00, 173.00, followed by 170.00.
MACD (middle chart) remains on a buy, slightly below 0 and rising after breaking the April downtrend (green line).
Money Flow (lower chart) broke the April downtrend (dotted blue line). I continue to be optimistic there is more room to the upside with Money Flow rising in an uptrend despite its turn down last week.
ALERT: Relative strength in the Russell 2000 compared to the S&P 500 closed above the March downtrend, favorable for Small Cap stocks in the near term.
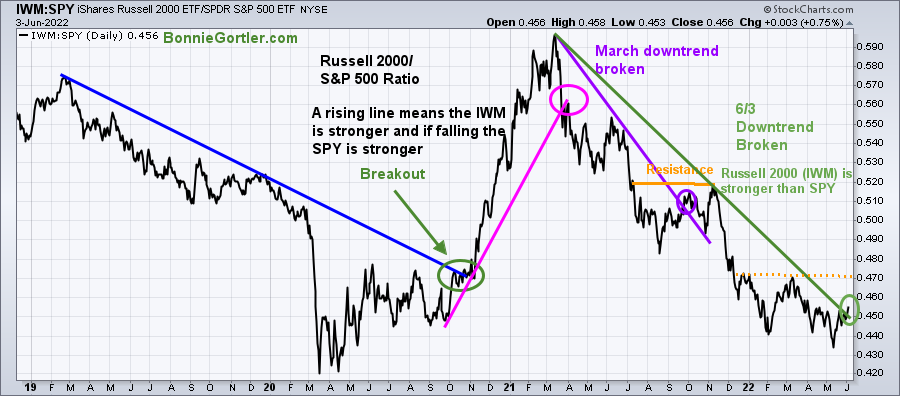
Figure 9: Daily Russell 2000 (IWM)/S&P 500 (SPY) Ratio
60322 Daily IWM SPY relative strength
Source: Stockcharts.com
The top chart is the relative strength ratio of Russell 2000 /S&P 500(SPY). A rising line means the Russell 2000 (IWM) is stronger, and if falling, the S&P 500 (SPY) is stronger.
On Friday, 6/3/22, the IWM/SPY ratio of the March 2021 downtrend broke (green circle), and I’m anticipating continued outperformance of Russell 2000 (IWM) vs. the S&P 500 in the short term.
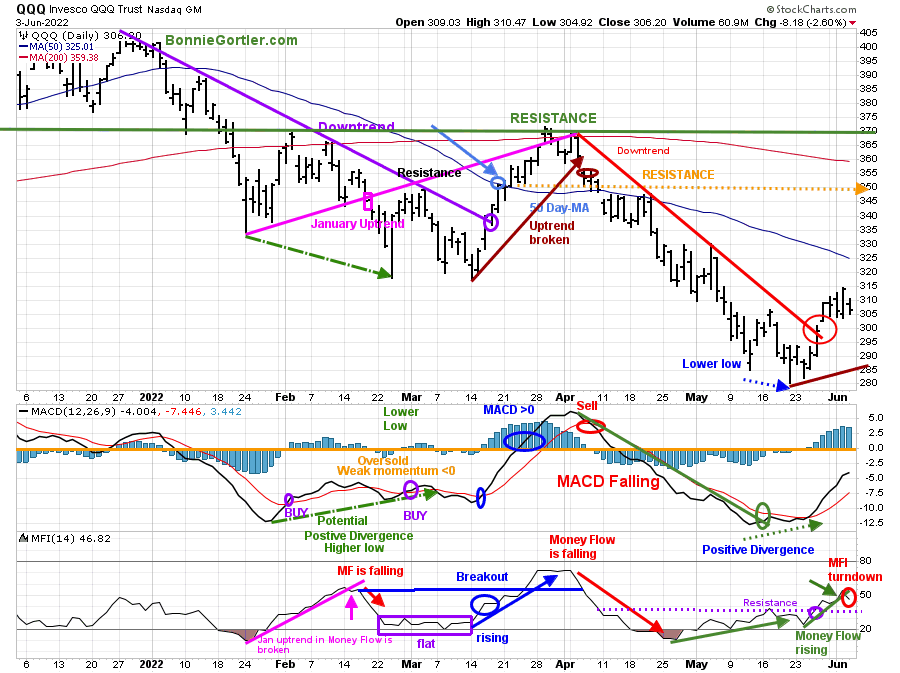
Figure 10: Daily Invesco QQQ Trust (QQQ) Price (Top) and 12-26-9 MACD (Bottom)
60322 QQQ Daily
Source: Stockcharts.com
The chart shows the daily Invesco QQQ, an exchange-traded fund based on the Nasdaq 100 Index with its 50 and 200-Day Moving Average. QQQ accelerated lower after breaking the January uptrend (pink rectangle), penetrating the January lows. After breaking the March uptrend (brown line) at 355.00, QQQ has been under heavy selling pressure.
The short-term trend remains up after breaking the April downtrend (red line). QQQ had worked its way higher but stalled at 315.00 resistance and turned down on Friday, closing down -0.94%, closing at 306.20, below the 50-Day and 200-Day Moving Average.
Resistance is at 315.00, 325.00, and 350.00. Support is at 300.00, 295.00, 285.00, followed by 280.00. Give the benefit of the doubt to the bulls as long QQQ closes above support at 300.00.
The middle chart is MACD (12, 26, 9), a measure of momentum. MACD is on a buy from a deeply oversold condition below 0 and positive divergence, a bullish pattern where QQQ made a lower low and MACD made a higher high. MACD has not had enough strength yet to reach 0 is worrisome. Time will tell if QQQ has enough strength for MACD to rise above 0, which would be positive.
Money Flow (lower chart) remains above resistance (purple dotted line), but after rising in May, has now broken the uptrend (green line) and is a little concerning and bears watching.
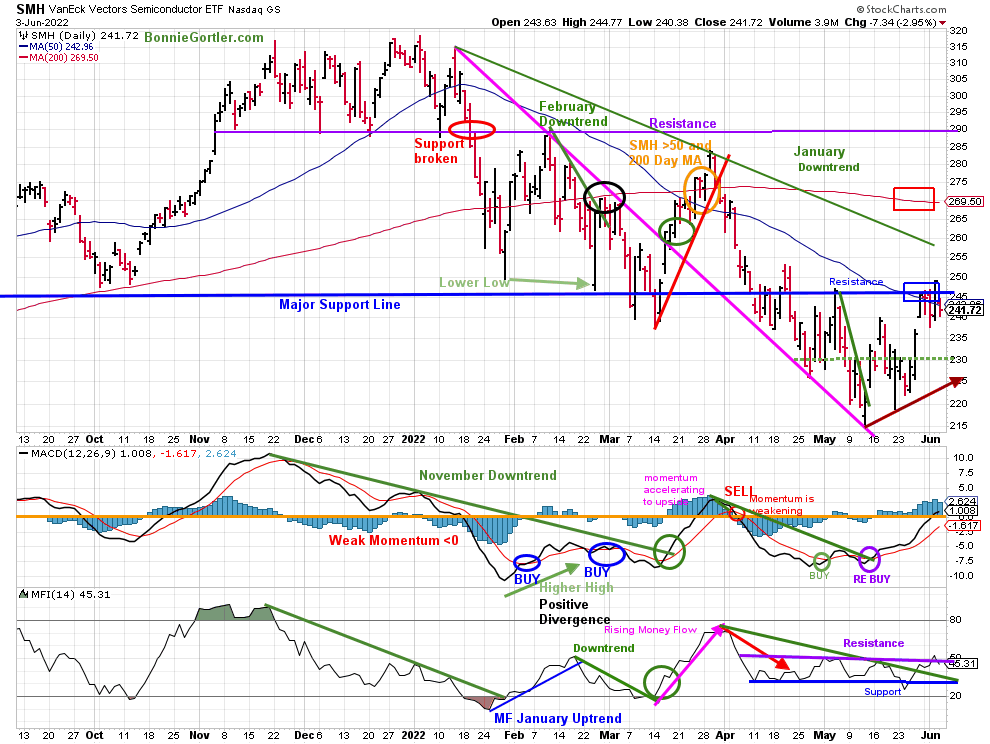
Figure 11: Van Eck Semiconductors (SMH) Daily Price (Top), 12-26-9 MACD (Middle), and Money Flow (Bottom)
60322 SMH Daily
Stockcharts.com
In late January, SMH support was broken (red circle) and then fell sharply but held the October 2021 lows. SMH then rallied but turned down again, closing below support at 240.00 on 3/14/22, a false breakdown. SMH broke the March uptrend (red line) after failing to get above the resistance at 290.00.
SMH fell -by 1.58%, closing at 241.72. SMH gave back some of its gains, unable to get through overhead resistance (blue horizontal line), and closed below the 50 Day (blue rectangle) and 200-Day MA (red rectangle).
The short-term trend remains up. Support is at 236.00, 230.00, and 225.00. Resistance is 249.00 255.00, followed by 270.00 (the 200-Day MA) and 290.00.
MACD (middle chart) is on a buy (green circle) and generated a re-buy (purple circle), continues to accelerate higher, and is now above 0, showing internal strength.
Money Flow (lower chart) had been trending sideways since 4/11 and broke its downtrend (green line) but stalled at resistance (purple line) which would confirm there are more gains ahead.
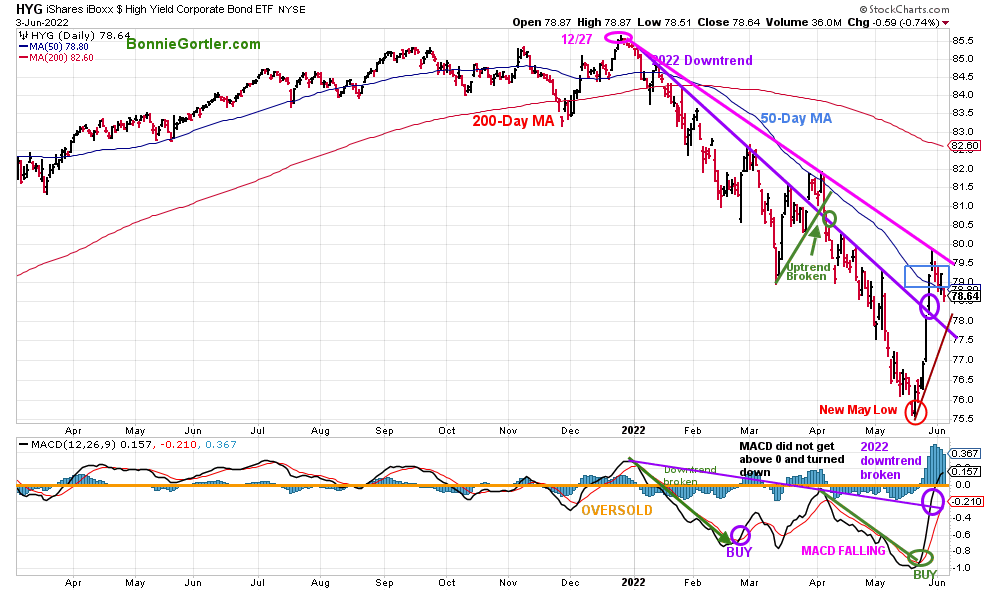
Figure 12: I Shares Hi Yield Corporate Bond (HYG) (Top), and 12-26-9 MACD (Bottom)
60322 HYG Daily
Source: Stockcharts.com
Hi-Yield Bonds (HYG) peaked on 12/27/21, but HYG failed to show much strength after breaking the downtrend in early April (green line), a false breakout.
Last week HYG fell -1.55% for the week giving back some of its gains from the May lows. HYG closed at 78.64, slightly below its 50-Day MA, unable to penetrate its 2022 downtrend (pink line). A close above would be considered bullish.
Support is at 78.00, and resistance is at 80.00 and 82.00.
MACD (lower chart) is on a buy. Its positive HYG broke the downtrend that started in 2022. Continued strength in HYG would be bullish for equities and high yield bonds.
Figure 13: Lord Abbett High Yield Fund (LAHYX)
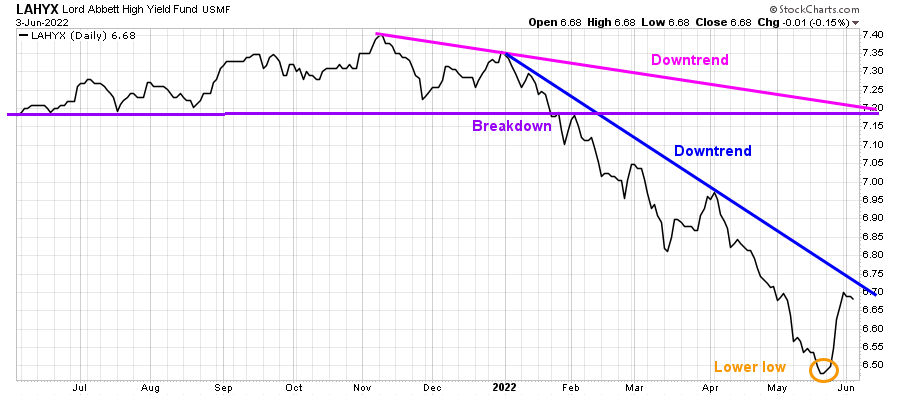
60322 LAYHX Daily
Source: Stockcharts.com
One of my favorite open-end Hi Yield mutual funds, Lord Abbett High Yield (LAHYX), has stabilized after making lower lows in May. With a turnup, LAHYX will have a favorable rising double bottom formation, breaking its 2022 downtrend and confirming the breakout in HYG.
Figure 14: The S&P 500 Index Daily ($SPX)
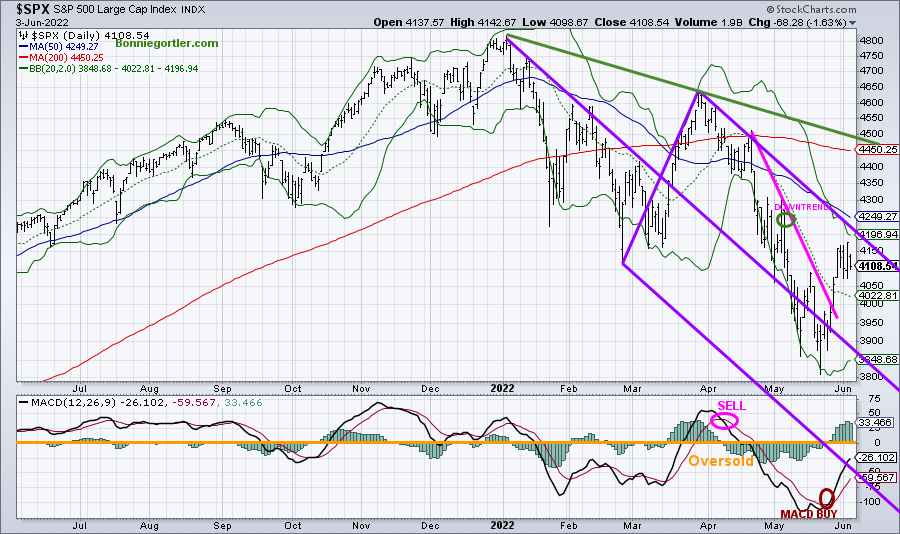
60322 SPX Daily
Source: Stockcharts.com
The S&P 500 (SPX) broke the downtrend (pink line) the previous week but stalled before hitting the short-term objective of 4276.00. So far, only a pullback in what appears to be a consolidation of the recent gains. The best moves are the ones that don’t let you in and keep going higher.
Support is at 4000.00. A close above 4300.00 will generate more believers in the rally, likely tripping the buy stops and causing more investors to cover their shorts.
On the other hand, a close below 3900.00 would imply a test of the May lows, and if they don’t hold, expect another leg down.
If you are interested in this chart, I invite you to join my FB group Wealth Through Market Charts, where I will be posting the updated chart and other charts.
The MACD (lower chart) remains on a buy below 0 and rising
Figure 15: iShares Transportation Average (IYT)
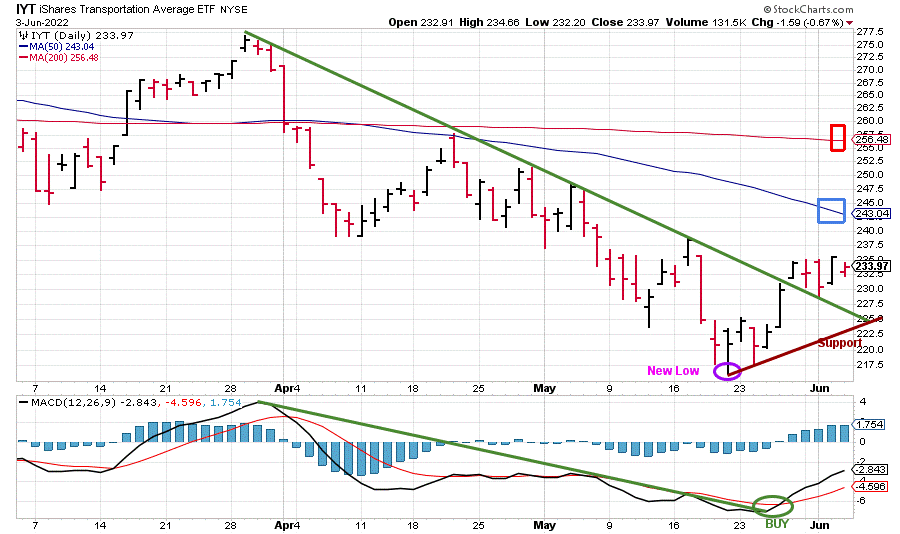
60322 IYT Daily
Source: Stockcharts.com
The Transportation Average (IYT) broke its price downtrend from March on 5/30, shifting the short term to up. IYT consolidated last week, falling only -0.24%. Support is at 227.50, and resistance is at 243.00.
MACD is on a buy and has broken its downtrend confirming the worst of the downside momentum is complete. It would be short-term positive if IYT shows strength and can lead the market higher, starting with closing above its 50-day MA (blue rectangle), which stands at 243.04 as of this writing.
Summing Up:
Investors remain cautious with bad news spotlighted on TV and social media. Stock market volatility remains high with continuing concerns about inflation, interest rates, Ukraine and Russia, the economy, and corporate earnings. Weaker guidance by Microsoft and slower growth projections by Apple put a temporary damper on the rally from following through on the previous week’s gains. The jury is still out, and time will tell who will take control, the bulls or the bears, over the next few months. The best moves in the market are where there is only a slight pullback and prices keep working their way higher. For now, the technicals are supporting the short-term trend. Last week was the pullback, and this week for the bulls to stay in control, the major averages need to continue higher, holding above support and getting through resistance. Continue to watch for Semiconductors, Technology, and Small Cap stocks to lead the market higher on positive breadth.
Remember to manage your risk, and your wealth will grow.
If you liked this article, you will love my Free Grow and Sustain Your Wealth Report. Get it here:

Do you like charts, I invite you to my FB group Wealth Through Market Charts or email me at Bonnie@Bonniegortler.com.
I would love to hear from you. If you have any questions or comments or would like to talk about the market, click here.
Disclaimer: Although the information is made with a sincere effort for accuracy, it is not guaranteed that the information provided is a statement of fact. Nor can we guarantee the results of following any of the recommendations made herein. Readers are encouraged to meet with their own advisors to consider the suitability of investments for their own particular situations and for determination of their own risk levels. Past performance does not guarantee any future results.


Create more wealth in your life
with these simple strategies.
As an added bonus you will also
receive BG’s Updates and Ezine

Discover how to quickly create more well-being in your life with these simple strategies.
As an added bonus you will also
receive BG’s Updates and Ezine

As an added bonus you will receive BG’s Updates and Ezine

All work listed on BonnieGortler.com is licensed under a Creative Commons Attribution - Noncommercial - No Derivative Works 3.0 Unported License.


Free Report:
Grow and Sustain Your Wealth
Discover how to grow your money with these easy, simple steps.

