

10 Simple Tips for Financial Well-Being
07/01/2026
A challenging week for the bulls, the current trading range broke to the downside, with all S&P SPDR sectors falling. Energy (XLE) and Consumer Staples fell the least (XLP) while Technology (XLK) and Financials (XLF) were the weakest. The SPDR S&P 500 ETF Trust (SPY) fell by -5.05%.
S&P SPDR Sector ETFs Performance Summary
6/3/22 – 6/10/22
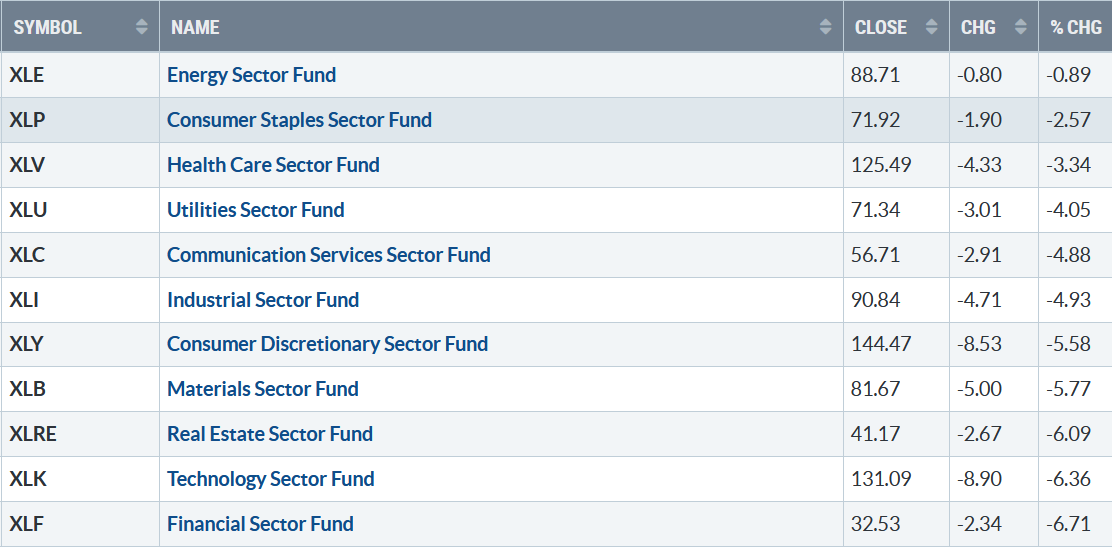
Source: Stockcharts.com
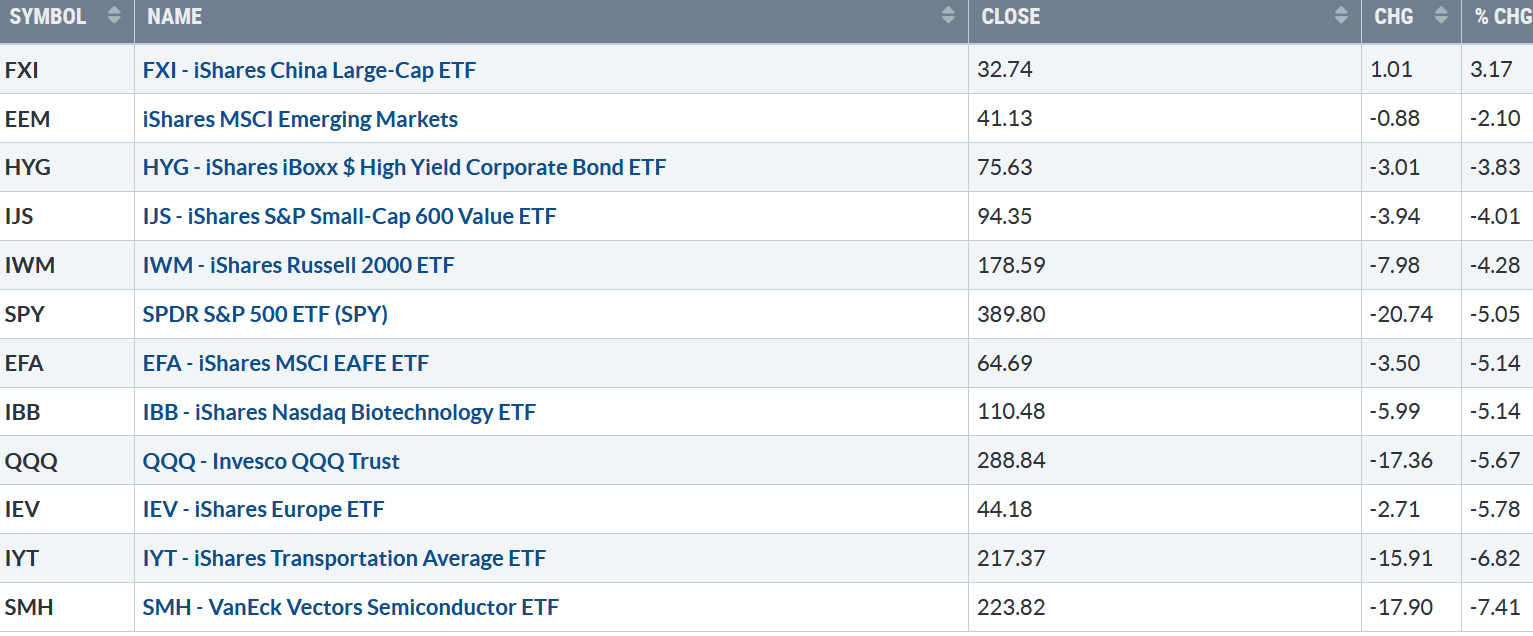
Figure 2: Bonnie’s Mix of ETFs
Performance Summary 6/3/22 – 6/10/22
61022 Week ETFs
Source: Stockcharts.com
China bucked the trend. Semiconductors, Transportation, Technology, and Biotechnology, were all under heavy selling pressure, and the bears took control.
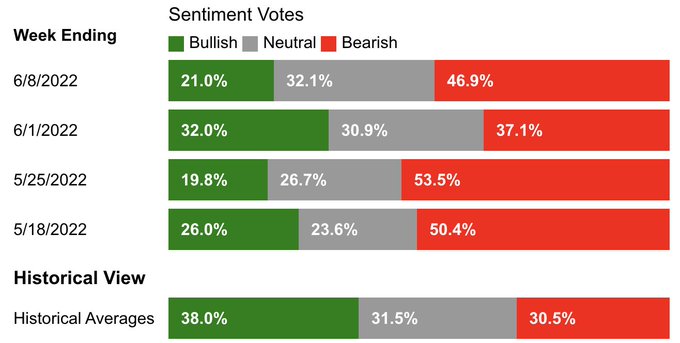
Market sentiment based on the CNBC Fear and Greed Index (a contrary indicator) continued showing fear. The AAII Sentiment Survey showed a significant increase in bears from the previous week, with the Bullish sentiment unusually low and the bearish sentiment historically high.
Figure 3: The AAII Sentiment Survey, week ending 6/8/22
61022 Week ETFs
Source https://www.aaii.com
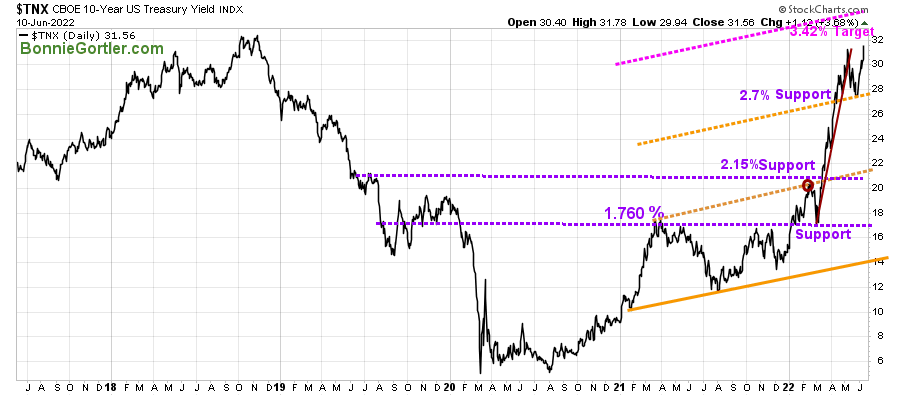
Figure 4: UST 10YR Bond Yields Daily
61022 UST 10 Yr Bond Yields Daily
Source: Stockcharts.com
The 10-Year U.S. Treasury yields rose after falling the last three weeks, closing at 3.156%, fueling selling pressure in U.S. Equities. The upside target remains at 3.42%.
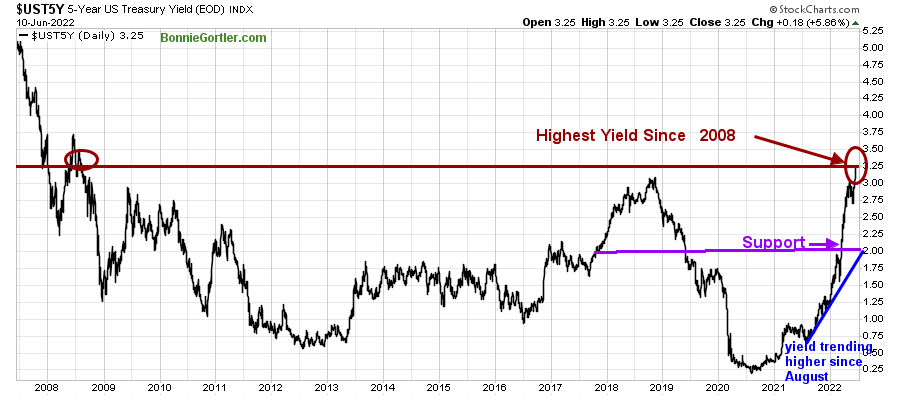
Figure 5: UST 5YR Bond Yields Daily
1022 UST 5 Yr Bond Yields Daily
Source: Stockcharts.com
The 5 Year U.S Treasury yield rose last week to the highest level since 2008, closing at 3.25%,
The Dow fell -4.58% for the week, down ten weeks in the past eleven. The S&P 500 was down -5.05%, and the Nasdaq fell -6.36%, both down nine of the last ten weeks. The Russell 2000 Index declined -4.40%, while The Value Line Arithmetic Index (a mix of approximately 1700 stocks was lower by -4.71%.
Weekly market breadth was negative for the New York Stock Exchange Index (NYSE) and Nasdaq. The NYSE had 666 advances and 2884 declines, with 158 new highs and 336 new lows. There were 1567 advances and 3782 declines on the Nasdaq, with 173 new highs and 757 new lows.
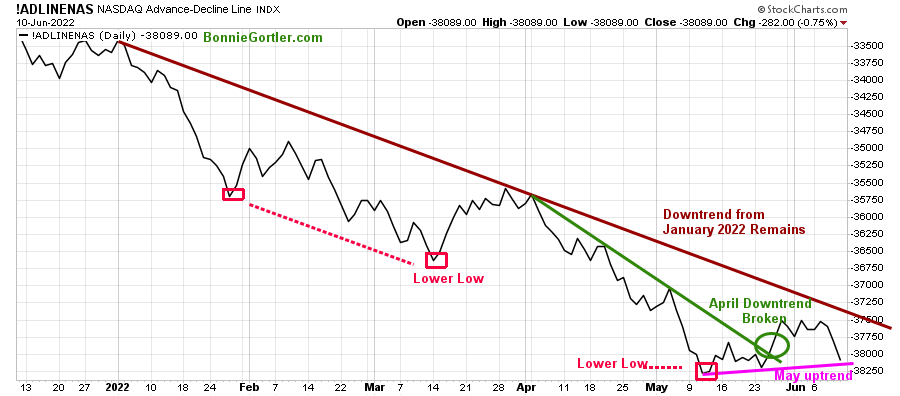
Figure 6: Nasdaq Advance Decline Line (Daily)
61022 Daily Nasdaq AD-Line
Source: Stockcharts.com
The improvement in breadth at the end of May and early June after breaking its April downtrend (green line) ended quickly, and the January downtrend remains (brown line).
If market breadth weakens next week, the May uptrend will no longer be in effect and increase the chances the decline is not over in the short term.
Positive breadth is necessary for a sustainable rally over the intermediate term (weeks to months) over the next few weeks, ultimately breaking the January downtrend (brown line).
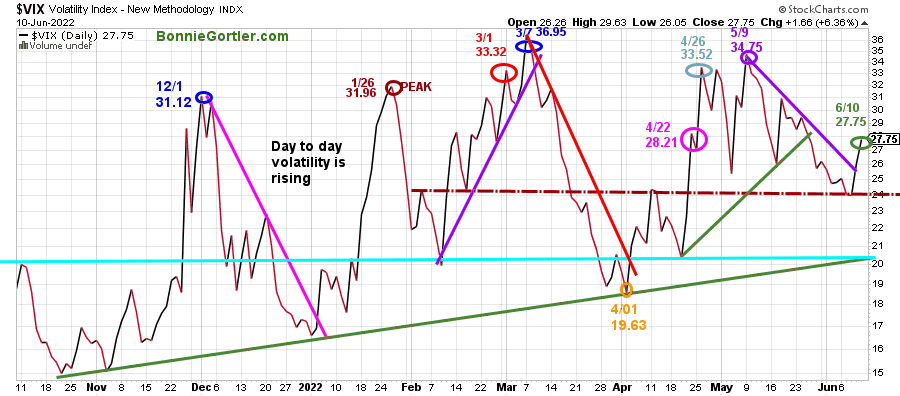
Figure 7: CBOE Volatility Index VIX
61022 VIX Daily
Source: Stockcharts.com
The CBOE Volatility Index ($VIX), a measure of fear, has been trading above 20.00 for most of 2022. In January, VIX made a high at 31.96 on 1/26 (brown circle), on 3/1 at 33.32 (red circle), and peaked at 36.95 on 3/7 (blue circle). VIX, through the sell-off, remained below the March peak.
VIX rose last week, breaking the May downtrend, closing at 24.75 (green circle), with fear increasing as the decline accelerated after VIX could not break below support at 24.00 (brown dotted line).
A close above 31 will imply increased day-to-day volatility. On the other hand, intraday volatility will be less if VIX closes below 24.00, indicating a potential test of the 4/01 April low (orange circle) at 19.63.
Wealth Tip

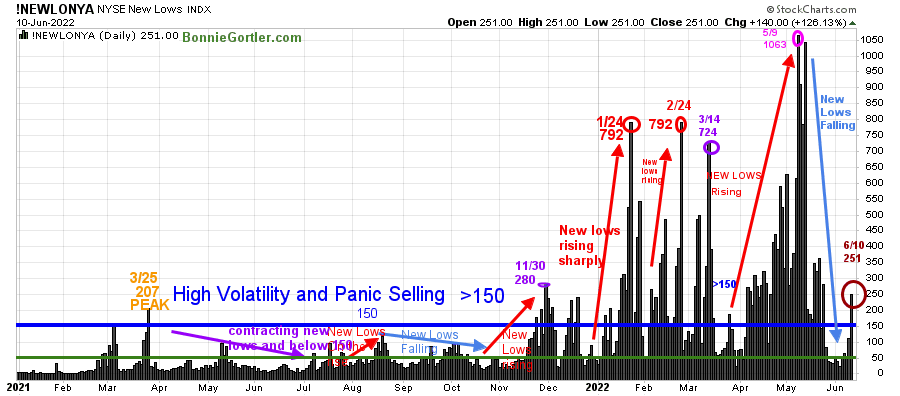
Figure 8: Daily New York Stock Exchange (NYSE) New Lows
61022 NYSE New LOWS Daily
Source: Stockcharts.com
Watching New lows on the New York Stock Exchange is a simple technical tool that helps awareness of the immediate trend’s direction.
New lows warned of a potential sharp pullback, high volatility, and “panic selling” for most of 2022, closing above 150. As the market started to move lower in January, New Lows rose sharply, peaking at 792 on 1/24 (red circle) and again on 2/24, implying an increased risk of further selling pressure. Investors in early May continued to unload stocks, and New Lows made a new high for 2022 of 1063 on 5/9 (pink circle).
Learn more about the significance of New Lows in my book, Journey to Wealth, published on Amazon. Here is an excerpt, when new lows are above 150, the market is negative, higher risk, and selling is taking place. Sometimes it could be severe, and sometimes on a very nasty day, you can have “panic selling,” and big wild swings (high volatility) to the downside may occur.
New lows rose last week, closing at 161 on 6/10 (brown circle), well below the May peak but above 150, and no longer in the low-risk zone.
Risk remains of further downside in the near term until New Lows contract to below 150 and then fall between 25 and 50.
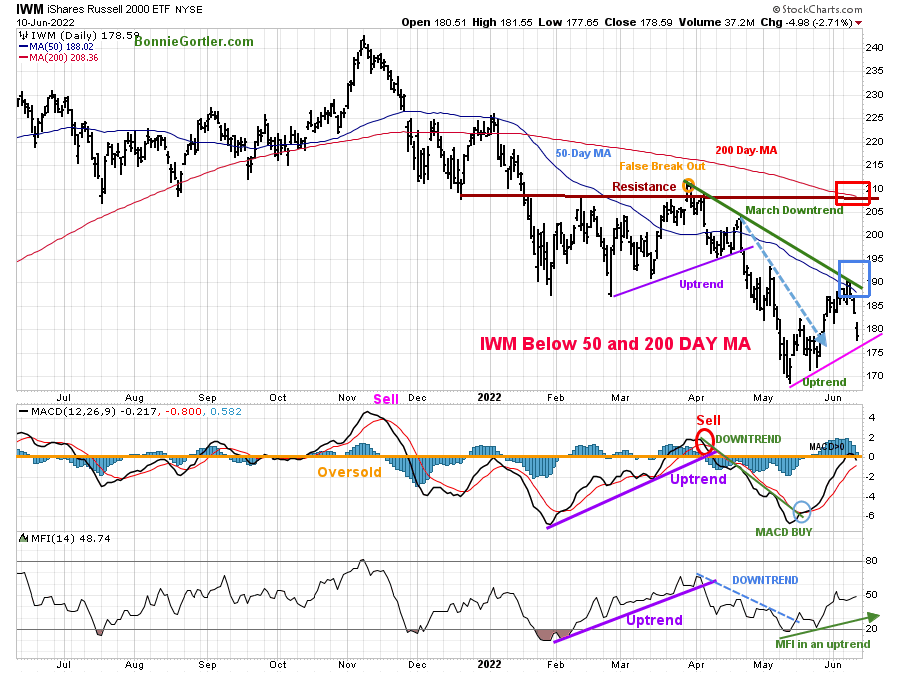
Figure 9: Daily iShares Russell 2000 (IWM) Price (Top) and 12-26-9 MACD (Middle) and Money Flow (Bottom)
61022 IWM Daily
Source: Stockcharts.com
The top portion of the chart is the daily iShares Russell 2000 Index ETF (IWM), the benchmark for small-cap stocks, with a 50-Day Moving Average (MA) (blue line) and 200-Day Moving Average (MA) that traders watch and use to define trends.
At the end of March, IWM failed to break out above resistance at 210.00 (orange circle) and turned sharply lower, forming a downtrend (green line).
IWM’s uptrend remains intact after breaking the April downtrend (blue dotted line). The May uptrend (pink line) is in jeopardy of being broken after heavy selling pressure on Thursday and Friday,
IWM fell below support at 183.00, and selling accelerated closing at 178.59, down -4.28% for the week, closing below the 50 and 200-Day Moving Averages (blue and red rectangle).
Short-term resistance is 183.00, 190.00, 195.00, 205.00, and 210.00. Support is at 175.00, 173.00, followed by 170.00. Two closes below 170.00 will imply lower downside projections.
MACD (middle chart) remains on a buy, falling and close to generating a sell on any weakness.
Money Flow (lower chart) broke the April downtrend (dotted blue line) and rose to make me more optimistic there was more room to the upside. However, I’m concerned that IWM could not sustain any upside momentum to get above resistance or the 50-Day MA and now MACD is close to giving a sell.
On the other hand, two closes above 190.00 would be positive.
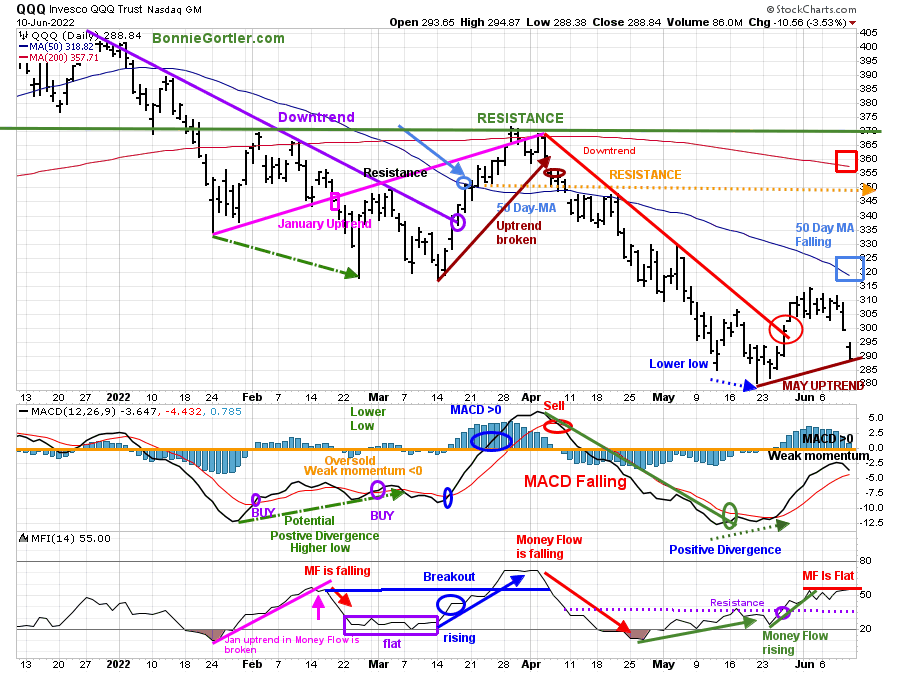
Figure 10: Daily Invesco QQQ Trust (QQQ) Price (Top) and 12-26-9 MACD (Bottom)
61022 QQQ Daily
Source: Stockcharts.com
The chart shows the daily Invesco QQQ, an exchange-traded fund based on the Nasdaq 100 Index with its 50 and 200-Day Moving Average. QQQ accelerated lower after breaking the January uptrend (pink rectangle), penetrating the January lows. After breaking the March uptrend (brown line) at 355.00, QQQ declined sharply.
At the end of May, the short-term trend turned up after breaking the April downtrend (red line). QQQ had worked its way higher but stalled at 315.00 resistance, and QQQ lacked the strength to close above the 50-Day Moving Average.
For the week, QQQ fell sharply, closing down -5.67%, closing at 288.94 below the 50-Day and 200-Day Moving Average. QQQ accelerated lower after a short-term consolidation breaking to the downside on 6/9.
Resistance is at 295.00, 300.00, and 315.00. Support is at 285.00 and 280.00.
The middle chart is MACD (12, 26, 9), a measure of momentum. MACD remains on a buy from a deeply oversold condition below 0 and positive divergence, a bullish pattern where QQQ made a lower low and MACD made a higher high. However, MACD has not had enough strength yet to reach 0, implying weak momentum. Therefore, time and strength in QQQ are necessary for MACD to rise above 0. At this point, unless there is a reversal, it’s unlikely.
Money Flow (lower chart) remains above resistance (purple dotted line) and is flat, not giving a clear signal.
To manage risk if the decline accelerates, use 279.00 as a stop for those of you who have investments in QQQ.
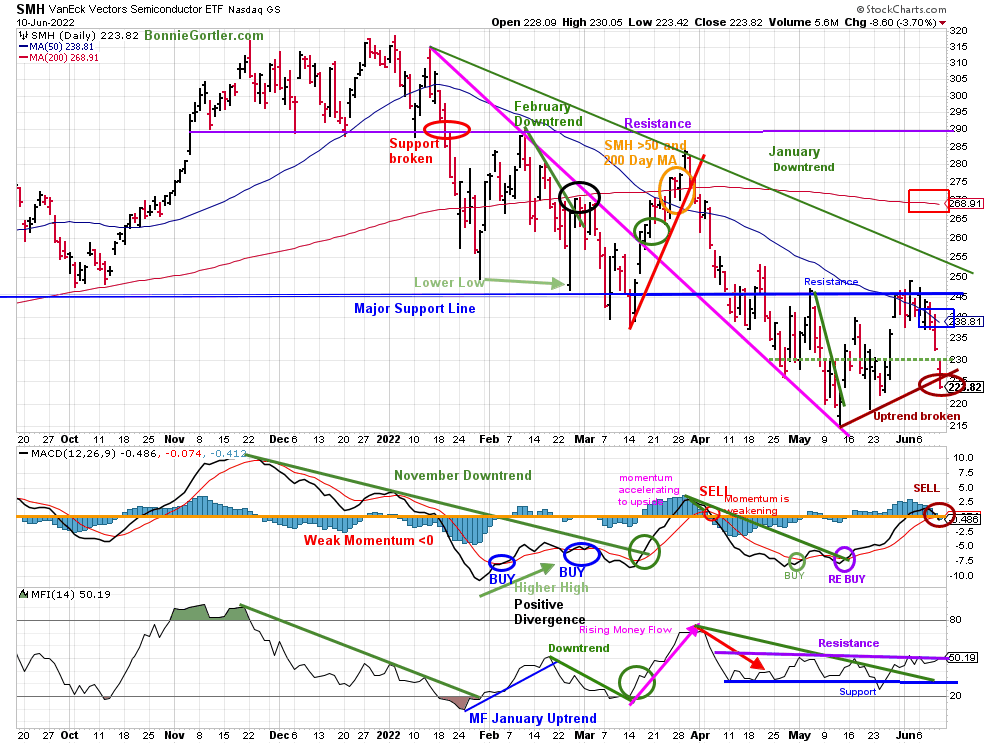
Figure 11: Van Eck Semiconductors (SMH) Daily Price (Top), 12-26-9 MACD (Middle), and Money Flow (Bottom)
61022 SMH Daily
Stockcharts.com
In late January, SMH support was broken (red circle) and fell sharply but held the October 2021 lows. SMH then rallied but turned down again, closing below support at 240.00 on 3/14/22, a false breakdown. SMH broke the March uptrend (red line) after failing to get above the resistance at 290.00.
SMH led the decline on Wednesday, Thursday, and Friday. For the week, SMH fell -7.41%, breaking the May uptrend. SMH closed near its lows at 223.82, unable to sustain any follow-through above overhead resistance (blue horizontal line) and closed below the 50-Day (blue rectangle) and 200-Day MA (red rectangle).
Support is at 220.00 and 215.00 with a potential downside target of 200.00 if SMH breaks the low. Resistance is 230.00 2238.00, followed by 246.00.
MACD (middle chart) was strong enough to get over 0, unlike the QQQ (brown circle), and generated a sell.
Money Flow (lower chart) has been trending sideways since 4/11 and remains under resistance (purple line).
For now, the bears are in control until SMH closes above 230.00.
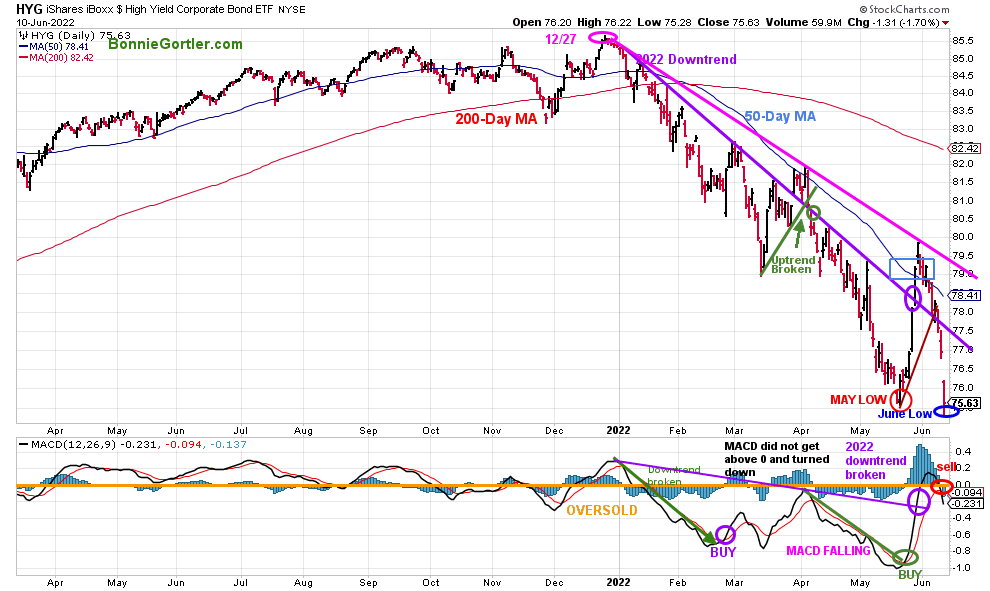
Figure 12: I Shares Hi Yield Corporate Bond (HYG) (Top), and 12-26-9 MACD (Bottom)
61022 HYG Daily
Source: Stockcharts.com
Hi-Yield Bonds (HYG) peaked on 12/27/21, and HYG broke the downtrend in early April (green line), which turned out to be a false breakout followed by a new low in May, and a sharp rally followed.
For the second week in a row, HYG fell, down -3.83%, closing below the May low at 75.63 and below its 50-Day MA, unable to penetrate its 2022 downtrend (pink line).
Support is at 74.00 and 72.00. Resistance is at 78.00, 80.00, and 82.00.
MACD (lower chart) is on a sell; continued weakness in HYG would be bearish for Equities and High Yield bonds.
Figure 13: Lord Abbett High Yield Fund (LAHYX)
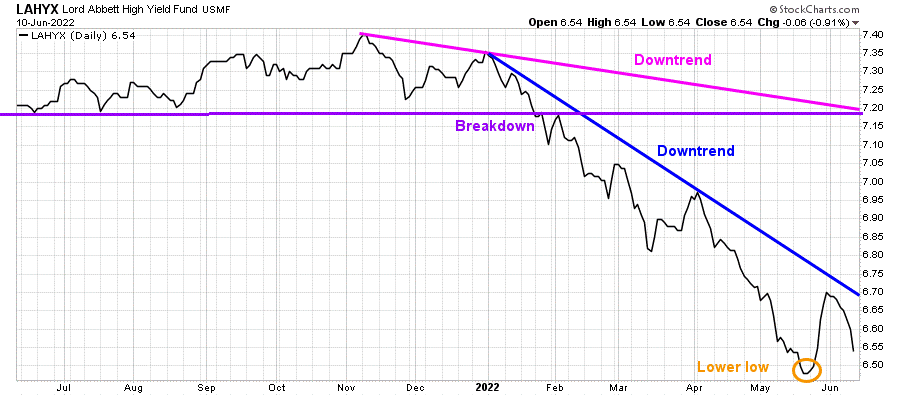
61022 LAHYX Daily
Source: Stockcharts.com
One of my favorite open-end Hi Yield mutual funds, Lord Abbett High Yield (LAHYX), had stabilized after making lower lows in May. Notice how LAHYX did not make a lower low, confirming the low in HYG.
It will be favorable if a turnup in LAHYX with a trend line break (blue line) occurs, which would form a rising double bottom formation. Time will tell.
Figure 14: The S&P 500 Index Daily ($SPX)
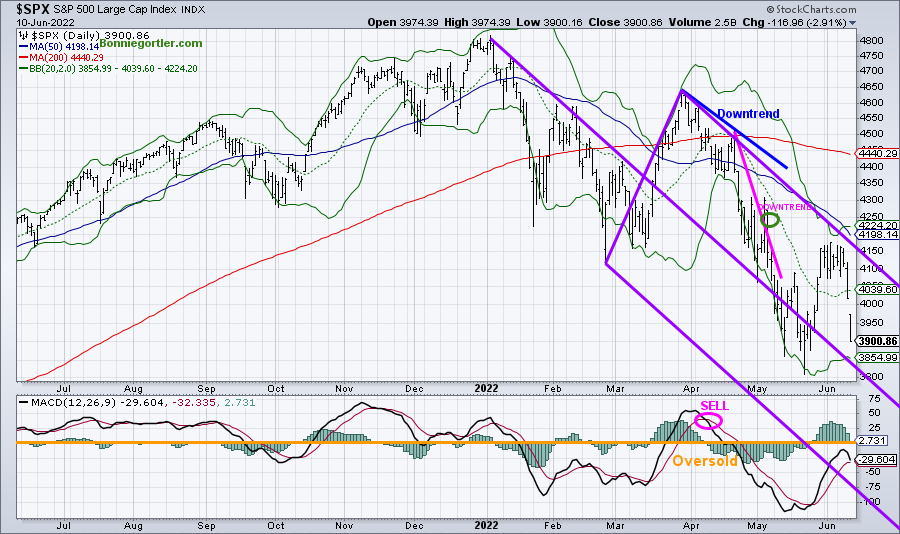
61022 SPX Daily
Source: Stockcharts.com
The S&P 500 (SPX) broke the downtrend (pink line) but stalled before hitting the short-term objective of 4276.00. What appeared to be a consolidation of the gains from the May low changed quickly to heavy selling last week after breaking through support at 4000.00 and closing at 3900.86.
Support is at 3855.00. Resistance is at 4000.00, followed by A close above 4200.00
If you are interested in this chart, I invite you to join my FB group Wealth Through Market Charts, where I will be posting the updated chart and other charts.
The MACD (lower chart) remains on a buy below 0 and falling, and a test of the May low is likely early in the week as traders await the news from the Fed meeting on 6/14-6/15.
Figure 15: iShares Transportation Average (IYT)
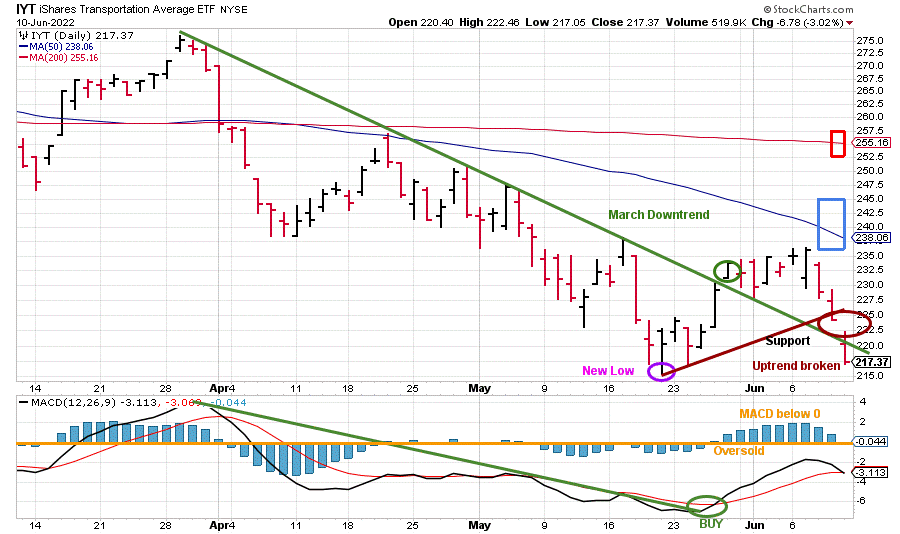 Source: Stockcharts.com
The Transportation Average (IYT) broke its price downtrend from March 5/30, shifting the short term to up (green circle) at the end of May and then consolidated.
IYT broke the May uptrend after breaking below support and sold off sharply, closing down – 6.82%.
Resistance is at 225.00, 238.00, and 255.00.
MACD remains on a buy, falling below 0 implying internal weakness. It would be short-term positive if IYT shows strength and can lead the market higher, starting with closing above its 50-day MA (blue rectangle), which stands at 238.06 as of this writing.
Summing Up:
A disappointing week for the bulls as the bears came out of hiding late Thursday and Friday after the major averages failed to get above resistance overhead. Major averages had their worst week since January on heavy downside volume. Stock market volatility remains high with continuing concerns about inflation, interest rates, Ukraine and Russia, the economy, and corporate earnings. What was encouraging technicals supporting the short-term trend has now turned negative with support broken, and others are in question if they will hold. For an upside reversal to occur and a sustainable rally, Semiconductors, Technology, and Small Cap stocks need to reverse quickly and lead the market higher on positive breadth.
Remember to manage your risk, and your wealth will grow.
If you liked this article, you will love my Free Grow and Sustain Your Wealth Report. Get it here:
 Do you like charts, I invite you to my FB group Wealth Through Market Charts or email me at Bonnie@Bonniegortler.com.
 I would love to hear from you. If you have any questions or comments or would like to talk about the market, click here.
Disclaimer: Although the information is made with a sincere effort for accuracy, it is not guaranteed that the information provided is a statement of fact. Nor can we guarantee the results of following any of the recommendations made herein. Readers are encouraged to meet with their own advisors to consider the suitability of investments for their own particular situations and for determination of their own risk levels. Past performance does not guarantee any future results.


Create more wealth in your life
with these simple strategies.
As an added bonus you will also
receive BG’s Updates and Ezine

Discover how to quickly create more well-being in your life with these simple strategies.
As an added bonus you will also
receive BG’s Updates and Ezine

As an added bonus you will receive BG’s Updates and Ezine

All work listed on BonnieGortler.com is licensed under a Creative Commons Attribution - Noncommercial - No Derivative Works 3.0 Unported License.


Free Report:
Grow and Sustain Your Wealth
Discover how to grow your money with these easy, simple steps.

