

10 Simple Tips for Financial Well-Being
07/01/2026
A strong week to begin 2021 despite the world chaos. For the week ending 1/08/21, 8 of the 11 S&P sectors finished the week higher. Energy (XLE) and Materials (XLB) were the best sectors gaining +9.29% and 5.69%, respectively. Financials (XLF) continued its strength as investors continue to buy value stocks. Real Estate (XLRE) was the big loser, down -2.46%. The S&P 500 (SPY), in comparison, gained +1.97%.
S&P SPDR SECTOR SUMMARY
Week of 01/08/21
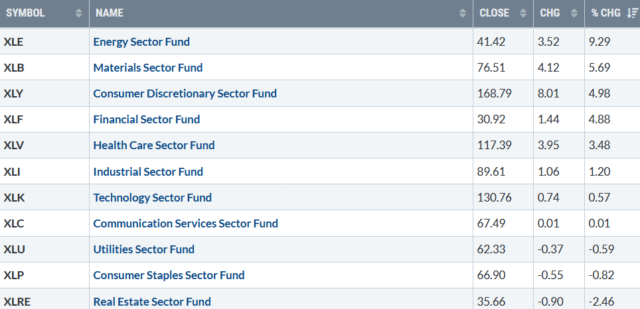
Chart Source: Stockcharts.com
Investors shrugged off the weaker-than-expected jobs report Friday, a Democratic sweep of the Georgia Senate run-off races, and a breach of the U.S. Capitol. The week started with stocks down sharply, causing fear to increase for a day with a sharp spike in volatility to 29.19 as measured by the CBOE Volatility Index $VIX), closing the week at 21.56. All three major averages, Dow, S&P 500, and the Nasdaq, closed at record highs. The Russell 2000, the benchmark for small-cap stocks, was the star performer of the week up, +5.9% to close at 2091.66, its best start to a year since 1987.
The rally has been broad. Market breadth during the rally continues to be positive. International and Emerging markets are breaking out to the upside, joining the U.S. Equity market. New Lows on Friday on the New York Stock Exchange Index was 0, a rare reading. On the contrary, some short momentum indicators are slowing down their rate of rising, optimism is at high levels in various stock market sentiment polls, and fundamentals such as PE ratios for many stocks are out of site as an economic recovery is expected later in the year and 2022.
What Sector to Watch for A Clue of a change in the Short-Term Trend? Watch Financials
Daily Financial Select Sector SPDR (XLF) Price (Top) and 12-26-9 MACD (Bottom)
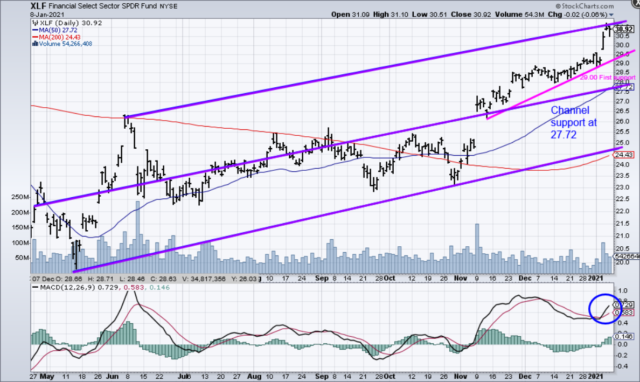
The top part chart shows the daily Financial Select Sector SPDR (XLF)1, an exchange-traded fund that is concentrated in large banks, with its 50-Day Moving Average (in purple) and 200-Day Moving Average (in red). (*See below for top holdings).
Banks rose sharply with the XLF breaking out of its trading range in early November, as investors began to shift assets to undervalued assets. The XLF has been a leader of the advance closing just under its upper channel 1/08/21. It’s positive XLF is above the 50-Day MA (blue line) at 27.72, which is also the channel support.
If the XLF closes below the 50-Day Moving Average, this would imply more weakness to occur and a test of the 200-Day MA at 24.43 (red line) which lines up with the lower channel.
The lower portion of the chart is the 12-26-9 Daily MACD, a measure of momentum. During the rally last week, MACD turned up (blue circle) but did not reset and go below 0, generating an oversold condition. No new buy is generated. However, MACD is rising, which is positive for now. However, be aware MACD has not confirmed the high in price. If MACD falters and turns down, a negative divergence is possible, and potential short-term weakness may occur.
In Sum:
As long as XLF is above 27.72, look for the present rally to continue and test their 2/2/19 high of 31.38. A close above would imply higher prices to 34.00. For now, there are more positives than negatives implying a market top is not in place. Continue to enjoy the ride. However, be alert to a change in the short-term trend. Have a risk management strategy in place that you are comfortable with to reduce your holdings. Take profits, or reallocate out of some of your high-risk assets if stocks start to fall.
I would love to hear from you. If you have any questions or comments, click here or Email me at Bonnie@bonniegortler.com.
1The XLF, top holdings as of 1/8/21, the top three holdings are Berkshire Hathaway Inc. Class B13.06%, JPMorgan Chase & Co.11.94%, and Bank of America Corp 7.21% totaling 32.21%. Source: https://www.etf.com/XLF#overview
Disclaimer: Although the information is made with a sincere effort for accuracy, it is not guaranteed that the information provided is a statement of fact. Nor can we guarantee the results of following any of the recommendations made herein. Readers are encouraged to meet with their own advisors to consider the suitability of investments for their own particular situations and for determination of their own risk levels. Past performance does not guarantee any future results.
If you like this article you would love the free
excerpt chapter of my book Journey to Wealth.
Get instant access here


Create more wealth in your life
with these simple strategies.
As an added bonus you will also
receive BG’s Updates and Ezine

Discover how to quickly create more well-being in your life with these simple strategies.
As an added bonus you will also
receive BG’s Updates and Ezine

As an added bonus you will receive BG’s Updates and Ezine

All work listed on BonnieGortler.com is licensed under a Creative Commons Attribution - Noncommercial - No Derivative Works 3.0 Unported License.


Free Report:
Grow and Sustain Your Wealth
Discover how to grow your money with these easy, simple steps.

