

10 Simple Tips for Financial Well-Being
07/01/2026
The stock market advance continued last week. Eight of the 11 S&P sectors for the week ending 2/12/21 finished higher. Energy (XLE) was the leading sector gaining 4.96%. Technology (XLK), Communication Services (XLC), and Financial (XLF), also had substantial gains, over 2% stronger than the S&P 500 (SPY which gained 1.23% in comparison. Consumer Discretionary (XLY) and Utilities (XLU) were the weakest sectors losing -1.11% and -1.53%, respectively.
S&P SPDR SECTOR ETFs SUMMARY
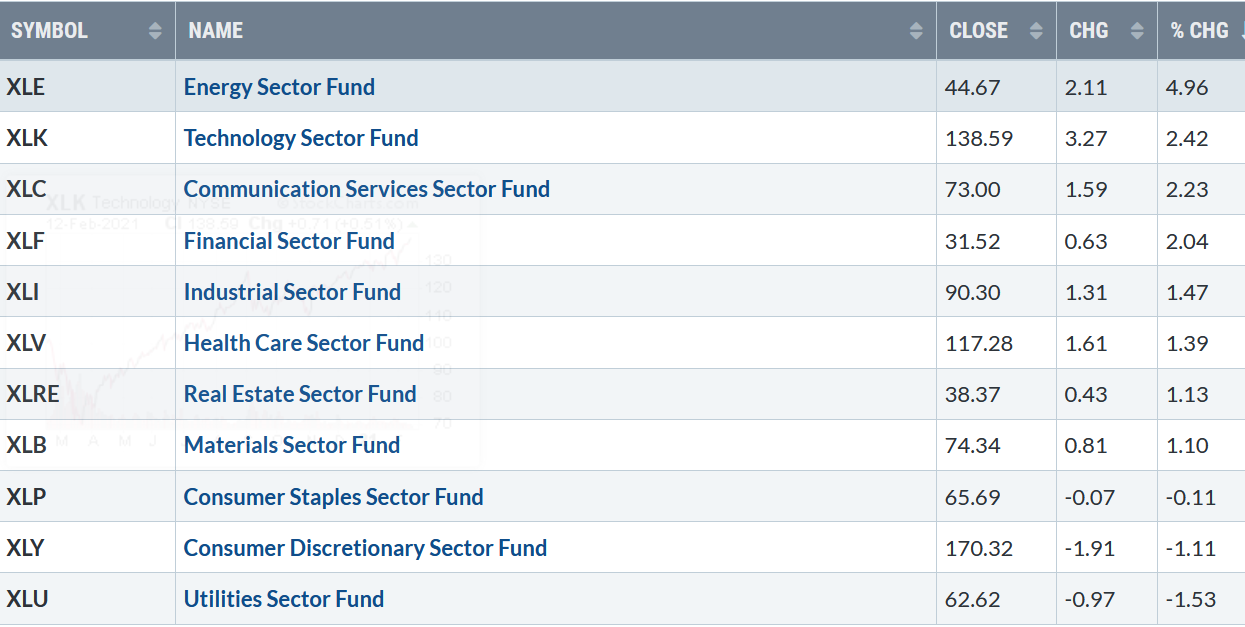
Chart Source: Stockcharts.com
Strong earnings results and expectations of more fiscal stimulus fueled the three major averages to close the week at record highs. Heavy buying occurred at the close on Friday as investors continued to buy into stocks before the President’s Day holiday.
The Dow gained 1.00%, S&P 500 up +1.23% for the week, and the Nasdaq rose +1.73%. The Russell 2000, the benchmark for small-cap stocks, continued its hot start to the year, gaining 2.51%, now up 15.93% year to date.
Market internals continues to be positive. Weekly market breadth on the New York Stock Exchange Index was solid, with 2117 advances and 1171 declines. A new high was once again made in the cumulative advance-decline line, showing the advance’s underlying strength. On 2/8/21, the Nasdaq had 706 stocks make new 52-week highs an all-time record. The fear-gauge CBOE Volatility Index (VIX) closed at 19.97, its lowest close since the peak on 2/21/20. Global markets are also participating in the rally, including the Emerging Markets (EEM), a positive sign there is more room to the upside and the advance continuing.
What Sector to Keep an eye on for a potential rally.
Daily Material Select Sector SPDR Fund (XLB) Price (Top) and 12-26-9 MACD (Bottom)
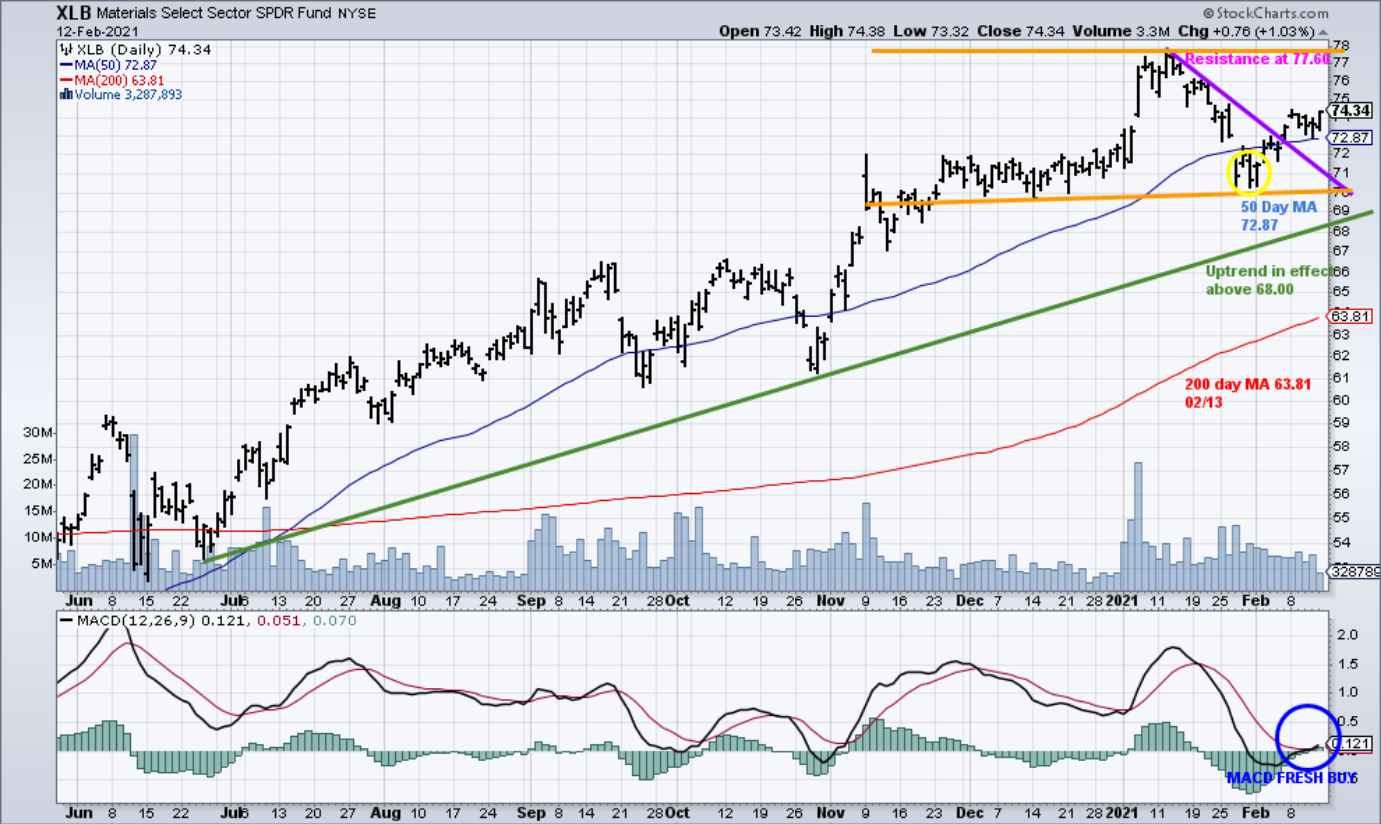
The top part chart shows the daily Materials Select Sector SPDR (XLB),1 an exchange-traded fund that includes securities of large-cap companies in chemicals, metals and mining, paper and forest products, containers and packaging, and construction materials industry. XLB is in an uptrend from July 2020 (green line).
After making a high on 1/12/21, XLB declined for a few weeks digesting its previous gains as the major U. S. averages moved higher. XLB closed under its 50-Day Moving Average (yellow circle) on 2/5, making an intra-day low on 1/27/21 at 70.01. No severe selling pressure followed. It appears that last week XLB successfully tested its 50 Day-MA, and has turned up breaking its downtrend (purple line), and is ready to rally again. Resistance is at 77.60. A close above the upper will imply a potential rally to 84.70. On the other hand, if XLB closes below the 1/27/01 low of 70.01, this would negate the short-term outlook for XLB.
The lower portion of the chart is the 12-26-9 Daily MACD, a technical indicator that measures momentum. With the recent strength in XLB last week, a new MACD buy signal (blue circle) has been generated, confirming the rise in XLB, implying potentially more gains to follow.
Historically, there has been a bull market in the commodities every 20 or 30 years. – Jim Rogers
Summing Up:
The Materials sector (XLB) could be ready for the next leg up as a new MACD buy signal has been generated. The major averages continue to make new highs with little pullback. Market internals remains very positive. The Volatility Index (VIX) is below 20 for the first time since last February. The cumulative advance-decline line made a new high showing the advance’s underlying strength. For now, the uptrend remains in effect, with the bulls in control until proven otherwise.
1The XLB top holdings as of 2/12/21 are Linde Plc (LIN) 15.79% Sherwin-Williams Company (SH) 6.86%, and Air Products and Chemicals, Inc (APD) 6.62%, totaling 29.27%. Source: https://www.etf.com/XLB#overview
I would love to hear from you. If you have any questions or comments, click here.
If you liked this article, you would love my Free report, Grow and Sustain Your Wealth. Please get it here
Disclaimer: Although the information is made with a sincere effort for accuracy, it is not guaranteed that the information provided is a statement of fact. Nor can we guarantee the results of following any of the recommendations made herein. Readers are encouraged to meet with their own advisors to consider the suitability of investments for their own particular situations and for determination of their own risk levels. Past performance does not guarantee any future results.


Create more wealth in your life
with these simple strategies.
As an added bonus you will also
receive BG’s Updates and Ezine

Discover how to quickly create more well-being in your life with these simple strategies.
As an added bonus you will also
receive BG’s Updates and Ezine

As an added bonus you will receive BG’s Updates and Ezine

All work listed on BonnieGortler.com is licensed under a Creative Commons Attribution - Noncommercial - No Derivative Works 3.0 Unported License.


Free Report:
Grow and Sustain Your Wealth
Discover how to grow your money with these easy, simple steps.

