

10 Simple Tips for Financial Well-Being
07/01/2026
The stock market advance slowed last week. Four of the eleven S&P sectors for the week ending 2/19/21 finished higher. Energy (XLE) and the Financial (XLF) sectors were the leading sectors gaining +3.38% and +2.82%. Materials (XLB) and Industrials were positive, stronger than the S&P 500 (SPY), which lost -0.66% in comparison. Utilities (XLU) and Health Care (XLV) were the weakest sectors losing -1.93% and -2.45%, respectively. The S&P 500 Index didn’t have much of a loss considering it was down four days in a row. Support held as price consolidated.
S&P SPDR SECTOR ETFs SUMMARY
Week of 2/19/21
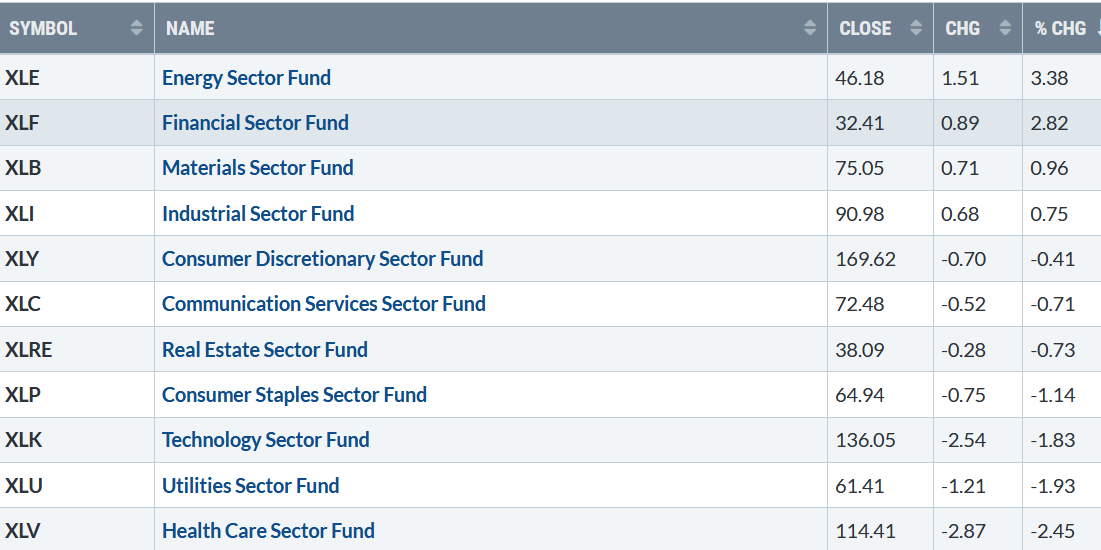
Chart Source: Stockcharts.com
Market internals was not as strong last week when the major averages all closed at new record highs. The fear-gauge CBOE Volatility Index (VIX) increased closing at 22.05 after closing below 20.00 last week, its lowest close since the peak on 2/21/20. Traders continue watching the yield on 10-year Treasuries, which closed at 1.34%, its highest level in a year, on concern that rising borrowing costs could hurt the economic recovery.
The Dow gained +0.11%, S&P 500 was down -0.71%, and the Nasdaq lost -1.57% for the week. There were wide swings of more than 10% in some stocks, although not visible in the major averages. The S&P 500 and the Nasdaq had their first weekly loss in three weeks while the Dow eked out its third straight weekly gain. The Russell 2000, the benchmark for small-cap stocks, was down -0.99% but finished strong on Friday, gaining +2.18%, outperforming the S&P 500, which fell -0.19% up +14.76% year to date.
I think we’re in the beginning of a bull market. When a bull market begins, nine months later the economy turns around. ~Sumner Redstone
Where do we go from here?
Keep an eye on the action in the Russell 2000 Index (IWM) for a clue of a shift in trend
Figure 2: Daily iShares Russell 2000 (IWM)
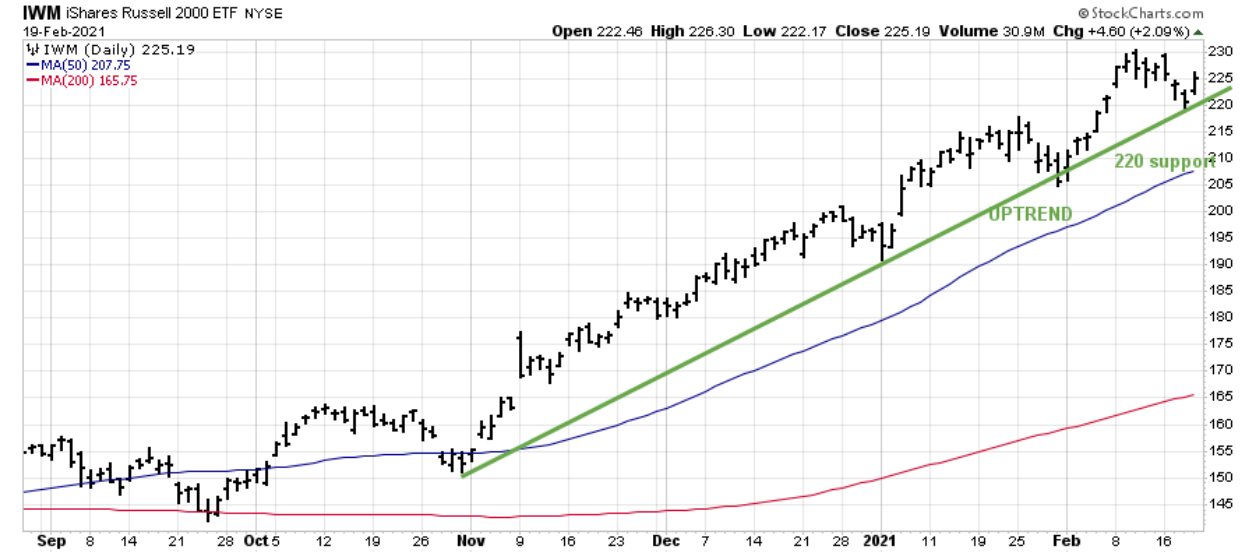
Chart Source: Stockcharts.com
The chart above is The Daily iShares Russell 2000 Index ETF (IWM)1 with a 50-Day Moving Average (blue line) and 200-Day Moving Average (red line) that traders watch and use to define trends.
The IWM is in a clear uptrend (green line). The first support is at 220.00. As long as IWM closes above 220.00, expect more strength to follow in the short term.
Since November 2020, IWM has rallied sharply and continues to trade above the 50-Day Moving Average (blue line). Notice how the 50-Week Moving Average (blue line) slope is rising (positive momentum) compared to September and October last year when the slope was flat.
Until IWM closes below the uptrend line for two days, selling is likely to be contained. If IWM breaks the uptrend, the next support is at the 50-Day MA at 207.75 (02/19/21).
Figure 3: Weekly iShares Russell 2000 Index (IWM)/S&P 500 Index (SPY) Ratio
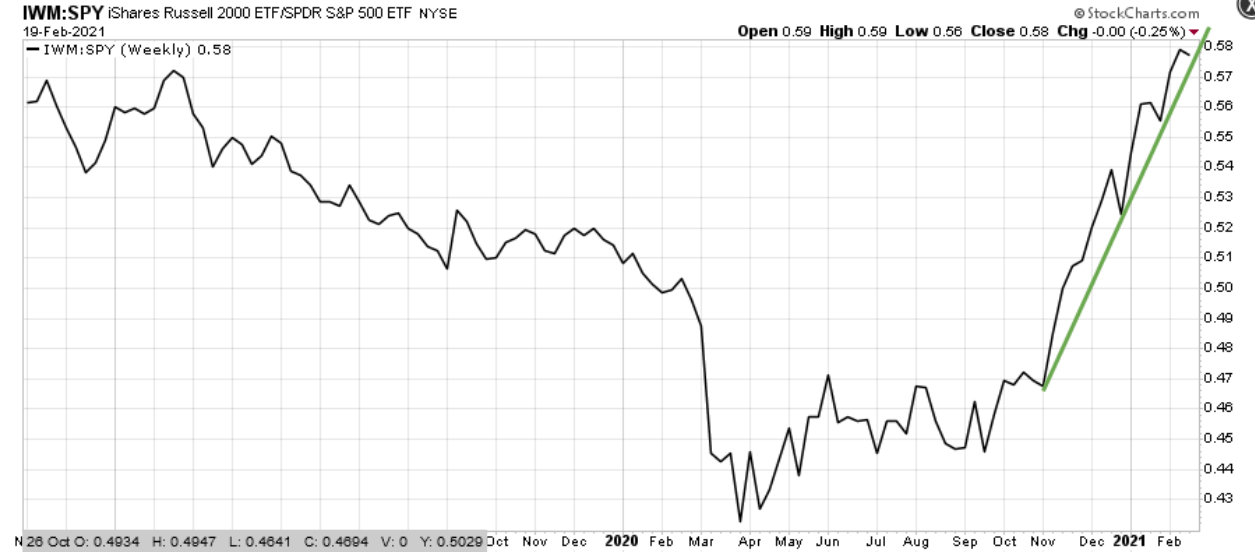
Chart Source: Stockcharts.com
The chart above is the weekly Russell 2000 Index / S&P 500 Index Ratio (IWM/SPY). A rising line means the IWM is stronger, and if falling, the SPY is stronger.
Since November last year, the IWM/SPY ratio is in an uptrend (green line). The IWM/SPY ratio set a new high last week, showing signs of strength compared to the S&P 500 (SPY). Small caps leading in relative strength bodes well for the broad market. As long as the RSI ratio favors the IWM, there is a likelihood of further gains ahead.
Figure 4: Weekly iShares Russell 2000 (IWM)
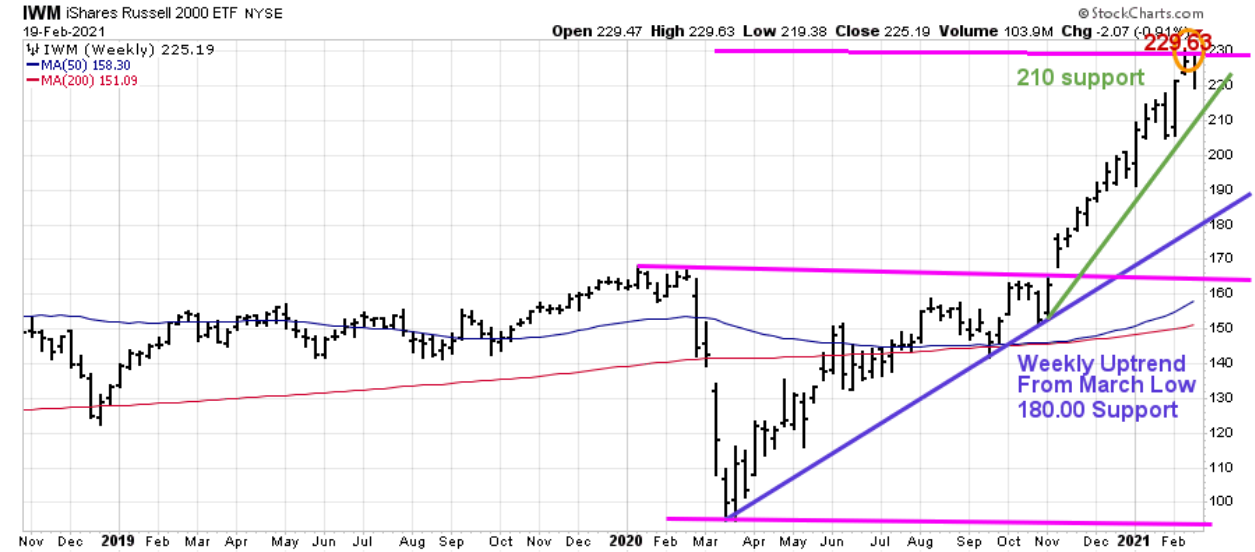
The weekly chart (Figure 3) of the Russell 2000 (IWM) remains positive. IWM peaked at 229.63 (orange circle), hitting its upper channel objective, and then declined to 219.38 before closing at 225.19, -1.93% below the high.
IWM has two significant up trendlines to track. The weekly uptrend from November (green line) where the first support lies at 210.00 and the uptrend from the March the lows where there is support at 180.00 (blue line).
A weekly close below 210.00 would increase the odds of a pullback to 180.00. A weekly close above 230.00 would give a new upside channel objective to 295.00, a 31% potential gain from current levels.
Summing Up:
Small caps lead in relative strength compared to the S&P 500 (SPY) since last November. Keep an eye if the uptrend is broken on the Russell 2000 Index (IWM) to provide a clue of a shift in trend or if IWM powers ahead and gives a new upside objective implying the major averages will move substantially higher. A close below 220.00, breaking the daily downtrend, would turn me more cautious, increasing the odds of a pullback. For now, the uptrend remains in effect, with the bulls in control until proven otherwise.
1 The iShares Russell 2000 Index ETF (IWM) comprises companies with a market capitalization of between $300 million and $2 billion. The portfolio top 5 sector holdings as of 2/19/21 are Financials 21.17%, Health Care 20.44%, Technology 14.94%, Consumer Cyclicals 14.31%, and Industrials 13.21%, totaling 84.07% https://www.etf.com/IWM.
I would love to hear from you. If you have any questions or comments, click here.
If you liked this article, you would love my Free report, Grow and Sustain Your Wealth. Please get it here
Learn more about Bonnie
Disclaimer: Although the information is made with a sincere effort for accuracy, it is not guaranteed that the information provided is a statement of fact. Nor can we guarantee the results of following any of the recommendations made herein. Readers are encouraged to meet with their own advisors to consider the suitability of investments for their own particular situations and for determination of their own risk levels. Past performance does not guarantee any future results.


Create more wealth in your life
with these simple strategies.
As an added bonus you will also
receive BG’s Updates and Ezine

Discover how to quickly create more well-being in your life with these simple strategies.
As an added bonus you will also
receive BG’s Updates and Ezine

As an added bonus you will receive BG’s Updates and Ezine

All work listed on BonnieGortler.com is licensed under a Creative Commons Attribution - Noncommercial - No Derivative Works 3.0 Unported License.


Free Report:
Grow and Sustain Your Wealth
Discover how to grow your money with these easy, simple steps.

