

10 Simple Tips for Financial Well-Being
07/01/2026
After falling over -3%, the major averages had their best weekly gains since November. The Dow, S&P 500, and Nasdaq all closed at new record highs. All 11 S&P sectors for the week ending 2/05/21 finished higher. Stocks that were under pressure last week reversed sharply to the upside. Investor’s risk appetite changed quickly from fear to greed. Energy (XLE), Communication Services (XLC), Financial (XLF), and Consumer Discretionary (XLY) all were up over 6% stronger than the S&P 500. Utilities (XLU) and Healthcare (XLV) were the weakest sectors gaining 2.32% and 0.56%, respectively. The S&P 500 (SPY), in comparison, gained +3.05%.
S&P SPDR SECTOR ETFs SUMMARY
Week of 2/5/21
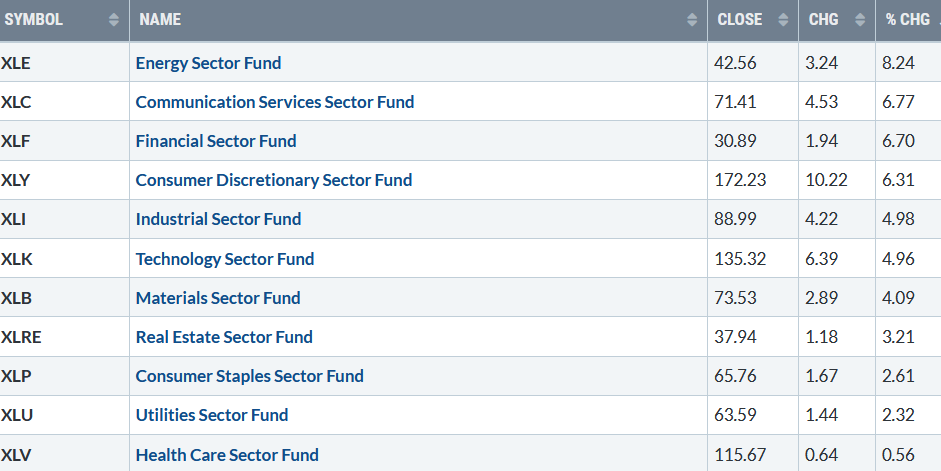
Chart Source: Stockcharts.com
Stocks rocked to the upside last week in a broad market rally. The Dow gained 3.89%, S&P 500 up +4.65 %, and the Nasdaq rose +6.01%. All three major averages, Dow, S&P 500, and the Nasdaq, are now profitable year to date. The Russell 2000, the benchmark for small-cap stocks, rose five days in a row, the star performer gaining 7.7% after a 5-day losing streak the previous week.
Weekly market breadth on the New York Stock Exchange Index was strong, with 2845 advances and 459 declines. A new high was made in the cumulative advance-decline line, showing the advance’s underlying strength.
New York Stock Exchange Advance-Decline Line Top and S&P 500 Index Bottom 02/05/21
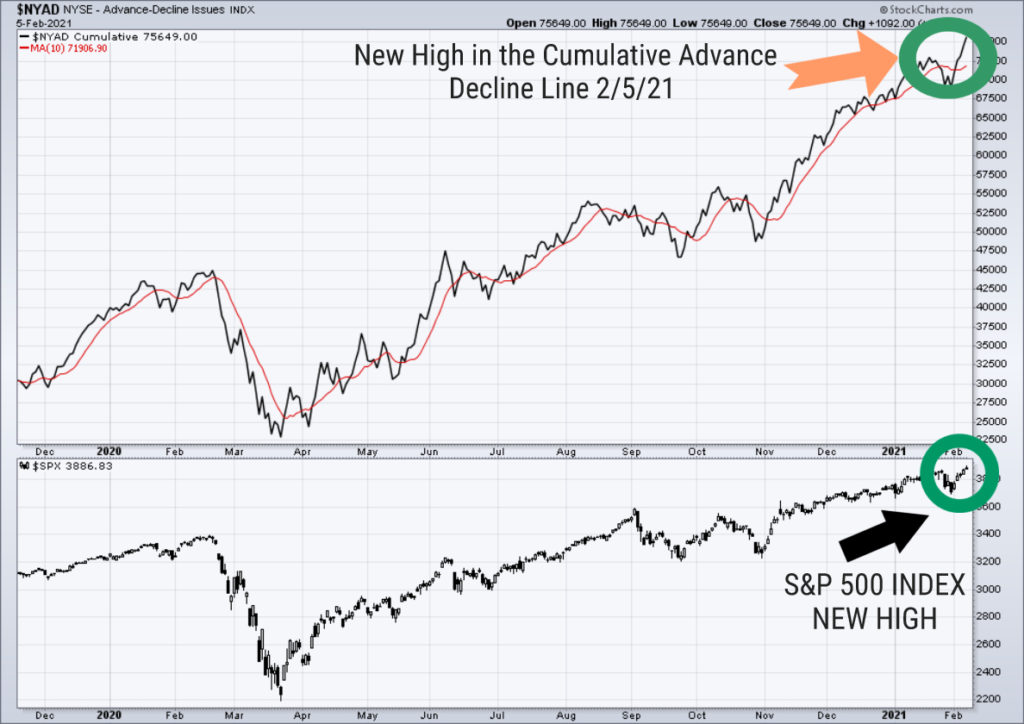
Chart Source: Stockcharts.com
The advance/decline line (A/D) is a technical indicator that measures market breadth. The A/D line shows how many stocks are participating in a stock market rally or decline. It represents a cumulative total of the number of stocks advancing versus the number of stocks declining. When the A/D Line rises, it means that more stocks are rising than declining (and vice versa).
The NYSE A/D line made a new high (green circle top chart ). The S&P 500 Index also made a new high (lower chart green circle). Historically, this is bullish. Rarely does the market make a final peak when the cumulative advance-decline line makes a new high.
What to watch now for a potential trend reversal?
Watch SPDR S&P 500 ETF (SPY) and Volatility Index (VIX)
Daily SPDR S&P 500 (SPY) Price (Top) and 12-26-9 MACD (Bottom)
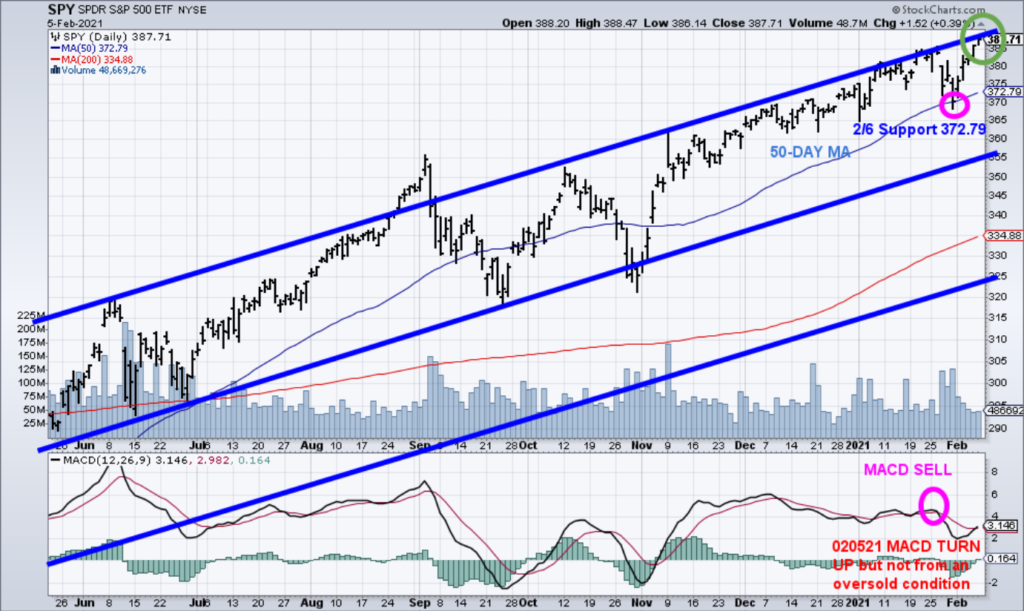
Chart Source: Stockcharts.com
The top chart shows the S&P 500 (SPY), its 50-Day MA, and its active price channel. As mentioned on the 1/29 Market Update, SPY turned up immediately following last week’s decline after falling below its 50-Day MA on 1/29/21, causing intraday stops hit (pink circle). A significant upside reversal followed where the SPY closed at the top of its daily trading channel once again.
MACD, a momentum indicator, remains on a sell (pink circle in the lower chart) but turned up with the SPY rise. No new buy signal occurred as MACD did not reset to an oversold condition falling below 0.
Notice MACD has not yet confirmed the new high made in the SPY. MACD has a potential negative divergence forming, a higher high in price, but MACD failing to make a high if the SPY continues to rise.
A close below 372.79 and a turndown in MACD would not be a healthy sign. First support is at 372.79 (50 Day-MA), followed by 355.00 (mid-channel) and 325.00, the lower channel if the selling pressure accelerates. Opposite of last week after last week’s rise, the hourly charts are overbought. Therefore, if the rally were to stall over the next few days, a short-term decline is more likely to occur.
Volatility Index (VIX)
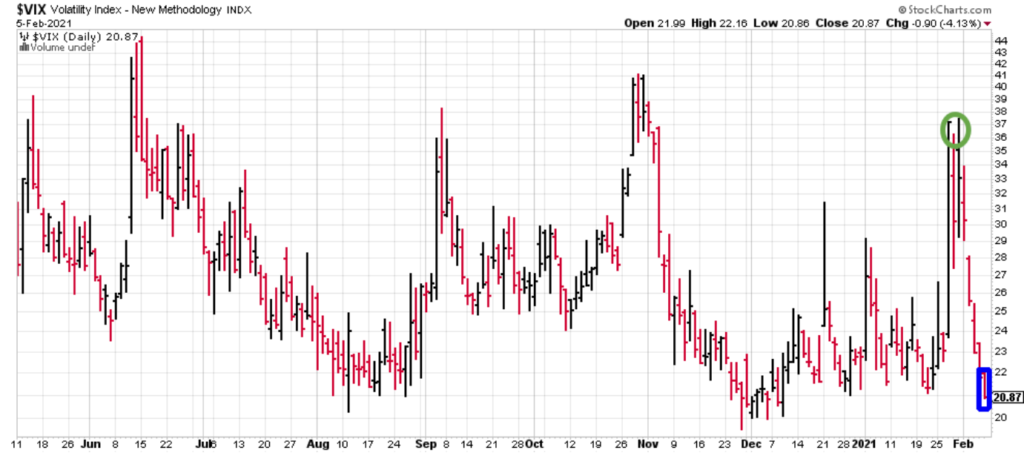
Chart Source: Stockcharts.com
Daily volatility fell sharply last week as measured by the CBOE Volatility (VIX), the fear index (a contrary market indicator). VIX fell 36.93% from 33.09 (green circle) last week and is now down 49.30% from the high on 1/29/20 to close at 20.87 on 2/5/21 (blue rectangle).
High VIX readings suggest high risk, while low VIX readings suggest lower or minimal risk.
It appears to be the market has bottomed since VIX fell sharply from its extreme reading after the recent -3% decline on the major averages. It would be a positive sign if VIX falls below 20 this week and remains there. However, the Fear and Greed Index has quickly moved to greed and is concerning (see chart below).
Fear and Greed Index
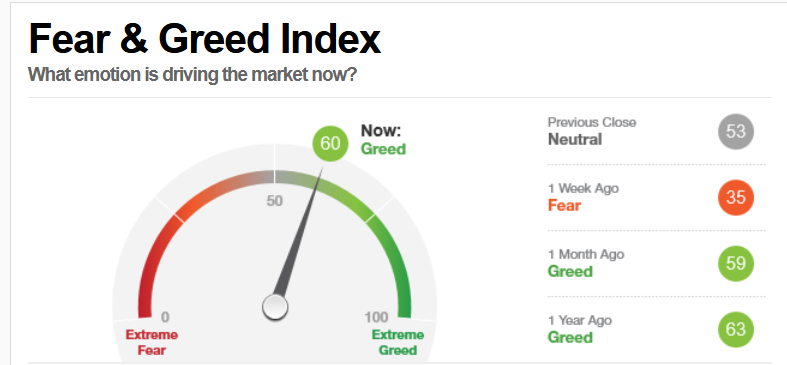
Source: CNN.com
In one week, the CNN fear and greed index (a contrary indicator) rose from 35 to 60. Emotions of investors shifted in one week from fear to greed. It’s a bearish sign that investor sentiment changed so quickly and no longer shows high greed levels, indicating a correction could be sooner rather than later.
“The price of inaction is far greater than the cost of a mistake”. – Meg Whitman
Summing Up:
The market rose sharply last week, ending the short-term decline. Market breadth confirmed the new highs implying the likelihood the final top has not yet been seen. There are low levels of fear among investors, some momentum indicators have not confirmed the record highs, and the short term is extended. If you are overly exposed to high volatile aggressive sectors, I would not be adding new investments at this time, and to take some profits and wait for a lower risk buying opportunity.
For now, the uptrend remains in effect with the bulls in control. Watch the S&P 500 (SPY) for a close below 372.79 (50 Day-MA) as a first warning that a shift in the short term trend could change, and more caution is needed.
If you are concerned with the stock market volatility, unsure of what to do next, and would like some simple strategies to follow, learn how here:
If you liked this article, you would love my Free report, Grow and Sustain Your Wealth. Please get it here.
Disclaimer: Although the information is made with a sincere effort for accuracy, it is not guaranteed that the information provided is a statement of fact. Nor can we guarantee the results of following any of the recommendations made herein. Readers are encouraged to meet with their own advisors to consider the suitability of investments for their own particular situations and for determination of their own risk levels. Past performance does not guarantee any future results.


Create more wealth in your life
with these simple strategies.
As an added bonus you will also
receive BG’s Updates and Ezine

Discover how to quickly create more well-being in your life with these simple strategies.
As an added bonus you will also
receive BG’s Updates and Ezine

As an added bonus you will receive BG’s Updates and Ezine

All work listed on BonnieGortler.com is licensed under a Creative Commons Attribution - Noncommercial - No Derivative Works 3.0 Unported License.


Free Report:
Grow and Sustain Your Wealth
Discover how to grow your money with these easy, simple steps.

