

10 Simple Tips for Financial Well-Being
07/01/2026
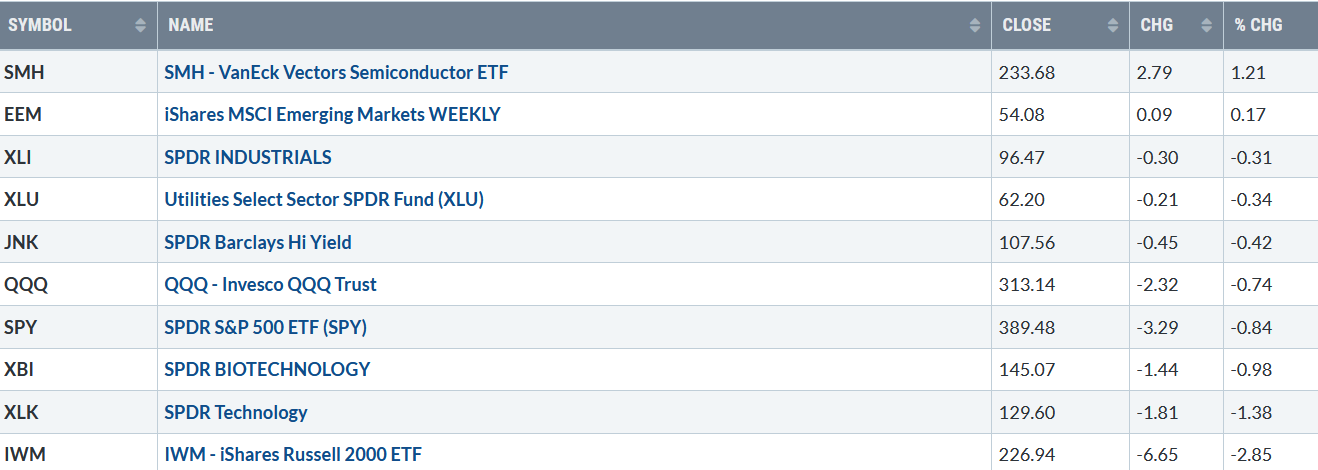
Intraday volatility and heavy volume were higher than usual because of triple witching, stock index, stock options, and stock futures contracts, all expiring as the bulls and the bears battled for control. Only three of the eleven S&P sectors rose for the week ending 3/19/21. Communications (XLC) and Health Care (XLV) lead the way up +0.96% and +0.41%, respectively. Energy (XLE), the weakest sector, fell sharply down -7.54%, while Financials (XLF), down -1.58%. The SPDR S&P 500 ETF Trust (SPY), in comparison, fell -0.84%, including the 1.278 dividends, pay date 4/30/21.
S&P SPDR SECTOR ETFs SUMMARY
Week of 3/19/21
Source: Stockcharts.com
Figure 1:10-Year Treasury Yields

Source: Stockcharts.com
10-Year Treasury yields remain concerning to investors, rising to close at 1.732 %, the highest reading since January 2020.
If rates stabilize, it’s likely to attract buying high growth stocks, which could fuel the broad market higher into the end of the quarter. A close below 1.60 would be a positive sign that rising rates will pause in the near term.
On the other hand, if $TNX continues to increase, more weakness in growth stocks could expand into other sectors of the market.
Market internals weakened considerably compared to the fall in the major averages. Weekly market breadth on the New York Stock Exchange Index was negative, with 1222 advances and 2155 declines. Nasdaq was negative with 1509 advances and 2694 declines. The Dow gained lost -0.46% for the week, the S&P 500 was down -0.77%, and the Nasdaq was lower by -0.79%, its fourth weekly decline in the past five weeks. The Russell 2000, the benchmark for small-cap stocks, was the weakest major average, down -2.77% last week (see Figure 6 below).
What to watch now?
There was not much change in the sentiment indicators that I follow, such as The CBOE Volatility Index (VIX), fear-gauge (a contrary indicator), which closed at 20.95 after rising from its lowest level last week since 2/12 at 19.97. Be alert to VIX rising to close for two days above 24.00, which I would view as a clue for further downside.
The Fear and Greed Index, another measure of investor sentiment (a contrary indicator), rose by only one last week, to end the week at 60, remaining at greed. It was somewhat concerning during the week when the Nasdaq fell 3%, and the index did not show fear.
Figure 2: Nasdaq New Lows
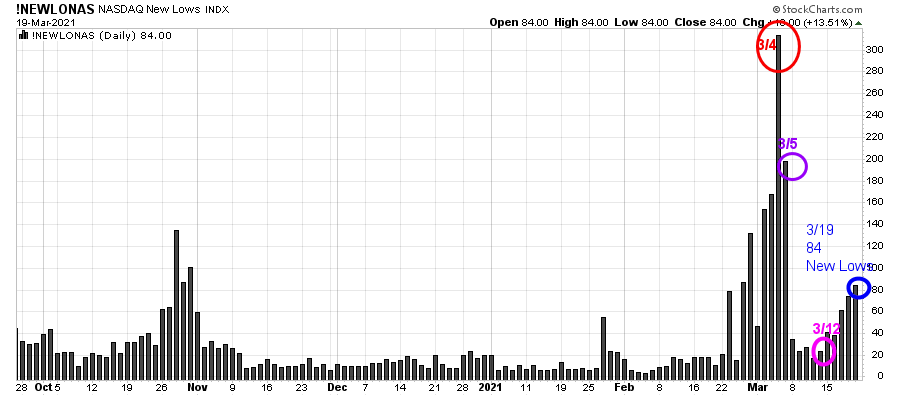
Source: Stockcharts.com
It was a volatile week where Friday ended with Nasdaq recovering some of its losses after its worst day in three weeks. New lows inched higher each day, closing at 84, well under the peak reading of over 300 new lows on 3/4/21. Keep an eye out if New lows expand or contract this week. It would a positive sign the Nasdaq could rally further if the new lows contract.
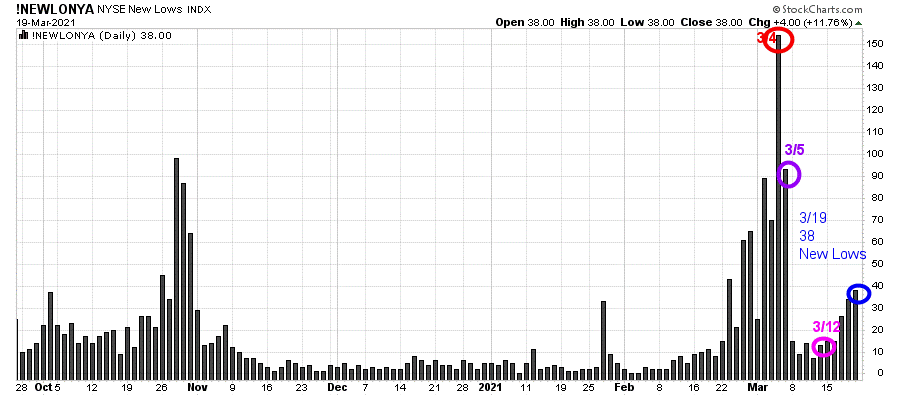
Figure 3: New York Stock Exchange New Lows
 Source: Stockcharts.com
The New York Stock Exchange Index rallied after New lows peaked just over 150 on 3/4/21.
Last week similar to the Nasdaq, NYSE new lows inched higher each day but closed on 3/19 with only 38 new lows. Watching the New lows on the New York Stock exchange is a simple technical tool that helps awareness about the direction of the immediate trend. In my book Journey to Wealth, when the New Lows are below 50, the market is positive (low risk and prices tend to rise).
As long as New lows remain low, I continue to give the benefit of the doubt to the bulls. Keep an eye out if New lows expand or contract this week.
“Financial freedom is available to those who learn about it and work for it” ~Robert Kiyosaki
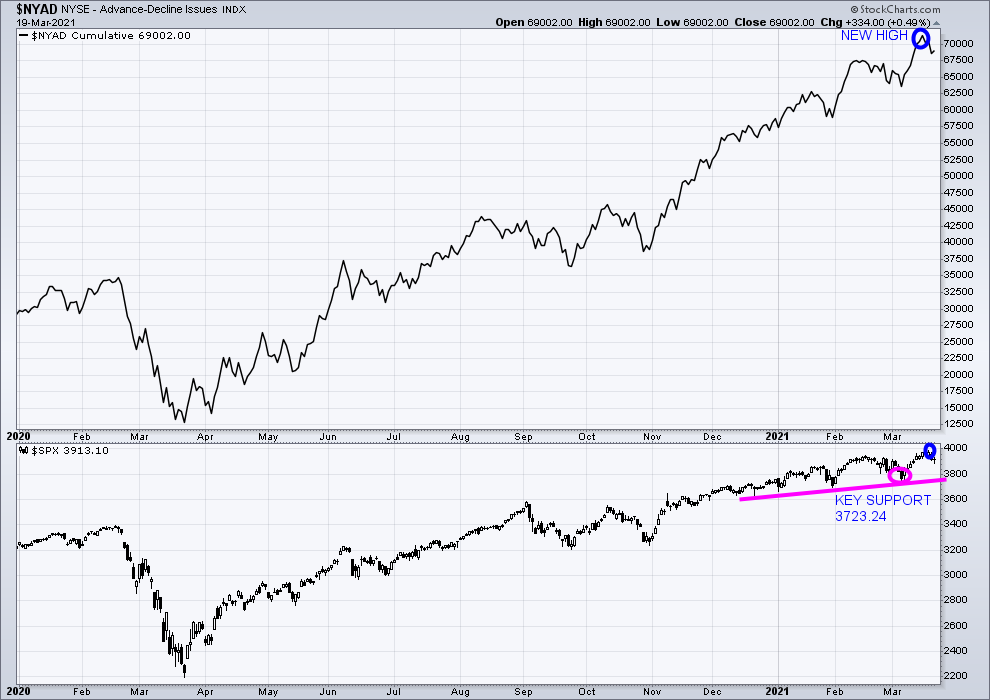
Figure 4: New York Stock Exchange Advance-Decline Line Top and S&P 500 Index Bottom
Source: Stockcharts.com
The advance/decline line (A/D) is one of my favorite technical indicators that measures market breadth. The A/D line shows how many stocks are participating in a stock market rally or decline. It represents a cumulative total of the number of stocks advancing versus the number of stocks declining. When the A/D Line rises, it means that more stocks are rising than declining (and vice versa).
The NYSE A/D line made a new high (blue circle top chart), confirming the new high in the S&P 500 Index (lower chart blue circle). Historically, this is bullish. Rarely does the market make a final peak when the cumulative advance-decline line makes a new high.
Support for the S&P 500 is 3723.34. A close below is likely to trip the sell stops and increase selling.
Figure 5: ETFs to observe for the near term
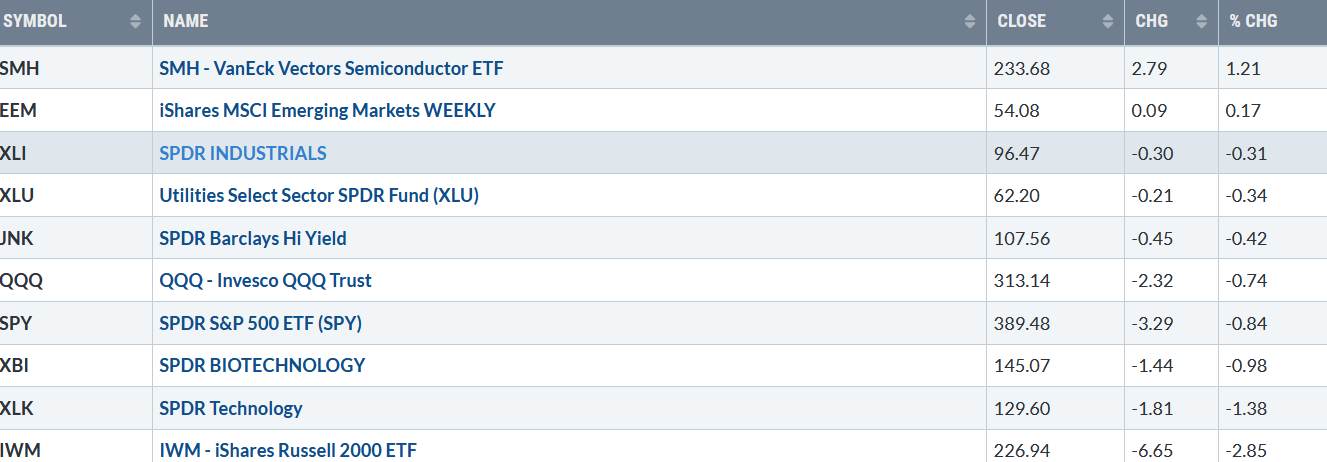
Source: Stockcharts.com Week of 3/19/21
Positives
Negatives
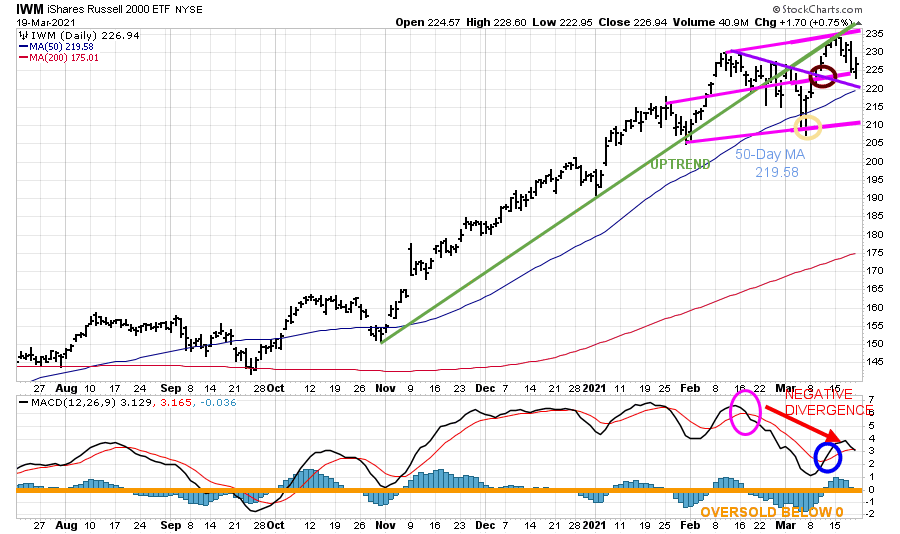
Figure 6: Daily iShares Russell 2000 (IWM) Price (Top) and 12-26-9 MACD (Bottom)
Source: Stockcharts.com
The top portion of the chart is the daily iShares Russell 2000 Index ETF (IWM) with a 50-Day Moving Average (blue line) and 200-Day Moving Average (red line) that traders watch and use to define trends.
After slightly penetrating the bottom of the channel at 209.00 and the 50-Day Moving Average (yellow circle), IWM rallied to break the daily downtrend (purple line) penetrating resistance at 220.00 (brown circle). IWM then rallied towards the top of the channel at 235.00, with a high of 234.15. IWM stalled at the old uptrend line from November (in green) and failed to close above the upper trend channel at 235.00 last week, giving higher projections to 260.00.
After falling to 222.95 intraday and holding above the 50-Day MA (blue line), IWM rallied to close at 1.8% above the low at 226.94, a positive sign.
The bottom half of the chart is MACD (12, 26, 9), a measure of momentum. MACD generated a sell (pink circle), but on the decline did not get below 0, an oversold condition (orange line) where a proper reset and buy would occur before turning up (blue circle). Its disturbing MACD has turned down after IWM made a high at 234.15, forming a bearish negative divergence. A negative divergence forms when price makes a higher high, and MACD forms a lower high. MACD did not confirm the high, a clear sign of weakening momentum. A close below 220.00 would be undesirable and imply at least a test of the March 4 low.
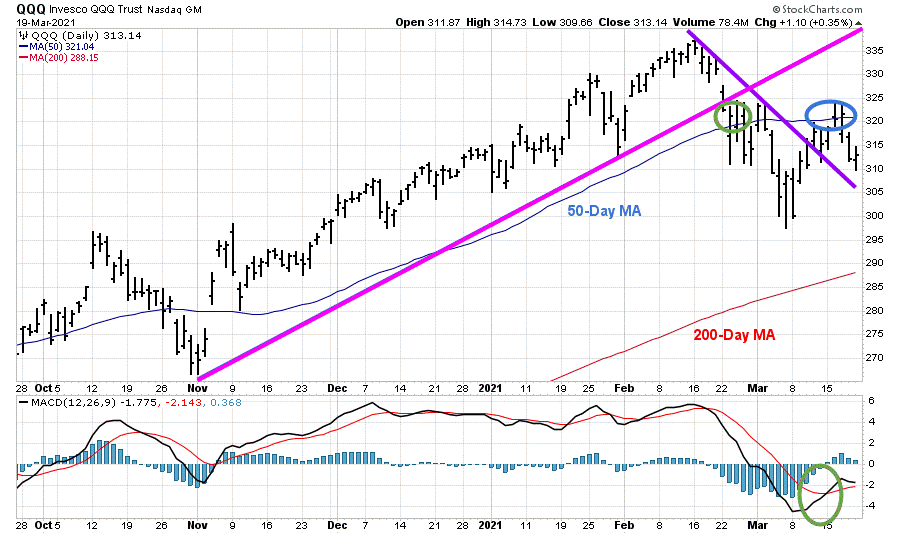
Figure: 7 Daily Invesco QQQ Trust Nasdaq (QQQ) Price (Top) and 12-26-9 MACD (Bottom)
Source: Stockcharts.com
The top part of the chart shows the daily Invesco QQQ, an exchange-traded fund based on the Nasdaq 100 Index with its 50-Day Moving Average and 200-Day Moving Average.
The daily uptrend of QQQ from November (pink line) was violated in February (green circle), shifting the daily trend down.
On 3/12, QQQ broke the downtrend (purple line), a positive sign, but failed to sustain enough momentum to stay above the 50-Day MA (blue circle) and turned lower this past week.
Support is at 305.00. A close below 305.00 would likely mean the recent rally only alleviated the short-term oversold condition, and further downside is likely.
Resistance is at 321.00, followed by 325.00.
The bottom half of the chart is MACD (12, 26, 9, a measure of momentum. MACD turned up from below 0, an oversold condition generating a buy (green circle). It will be favorable now if QQQ closes above resistance at 325.00, which would form a favorable double bottom formation.
Summing Up:
10-year Treasury yields closed at their highest level in 2021, putting a damper on the rally from the previous week. QQQ trading back below its 50-day moving average. Russell 2000 (IWM), a relative strength leader in 2021, shows clear signs of weakening momentum, which does not bode well for the bread market.
On the other hand, it’s a positive sign the major averages ended above the March 4th lows and above key intermediate support levels. New Lows on both the Nasdaq and New York Stock Exchange remain low.
The end of the quarter window dressing is near, which could help support the market, especially if 10-year yields fall. The current week is key whether the advance will gather steam after a pause or more selling pressure will occur. I nervously give the benefit of the doubt to the bulls until there is a weekly close below 207.21 for IWM and below 300.00 for QQQ. Remember to manage your risk, and your wealth will grow.
I would love to hear from you. If you have any questions or comments, click here.
Book a Free Strategy session here
If you liked this article, you would love my Free report, Grow and Sustain Your Wealth. Please get it here

Disclaimer: Although the information is made with a sincere effort for accuracy, it is not guaranteed that the information provided is a statement of fact. Nor can we guarantee the results of following any of the recommendations made herein. Readers are encouraged to meet with their own advisors to consider the suitability of investments for their own particular situations and for determination of their own risk levels. Past performance does not guarantee any future results.
Learn more about Bonnie


Create more wealth in your life
with these simple strategies.
As an added bonus you will also
receive BG’s Updates and Ezine

Discover how to quickly create more well-being in your life with these simple strategies.
As an added bonus you will also
receive BG’s Updates and Ezine

As an added bonus you will receive BG’s Updates and Ezine

All work listed on BonnieGortler.com is licensed under a Creative Commons Attribution - Noncommercial - No Derivative Works 3.0 Unported License.


Free Report:
Grow and Sustain Your Wealth
Discover how to grow your money with these easy, simple steps.

