

10 Simple Tips for Financial Well-Being
07/01/2026
Five of the eleven S&P sectors finished higher for the week ending 05/21/21, with defensive sectors finishing at the top of the rankings. Real Estate (XLRE) and Healthcare (XLV) were the leading sectors, +0.93% and +0.74%, respectively. Industrials (XLI) and Energy (XLE) were the weakest sectors, down -1.61% and -2.49%. The SPDR S&P 500 ETF Trust (SPY), in comparison, was down -0.39%.
S&P SPDR Sector ETFs Performance Summary
Week Ending 5/21/21
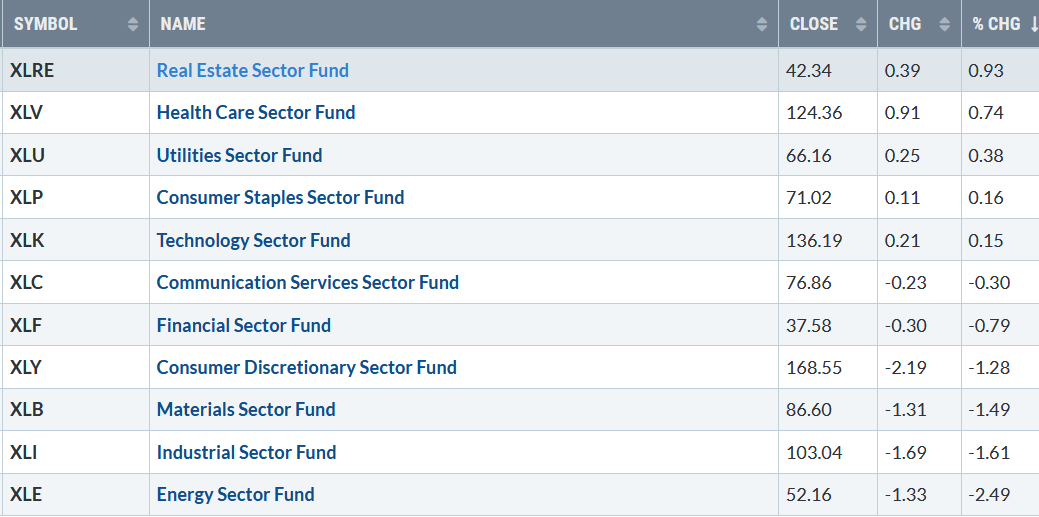
Source: Stockcharts.com
A volatile trading week that ended reasonably well as continued inflation concerns remain. 10-Year Treasury yields closed slightly higher for the week at 1.63%, staying in a trading range for now.
Technology and small-cap stocks’ downside momentum appears to have slowed, a hopeful sign for the bulls that another advance to the old highs and potentially even higher will occur sooner rather than later.
For the week, the Dow fell -0.51%, S&P 500 down -0.43%, and Nasdaq was up + 0.31%, breaking its four-week losing streak. The Russell 2000 index fell -0.42%.
Weekly market breadth improved. Both the Nasdaq and New York Stock Index (NYSE) had more stocks rise than fell. The New York Stock Exchange Index had 1906 advances and 1596 declines. Nasdaq breadth had 2688 advances and 1785 declines. New lows on the NYSE contracted, a positive sign more gains lie ahead in the near term.
Figure 2: Daily New York Stock Exchange New Lows
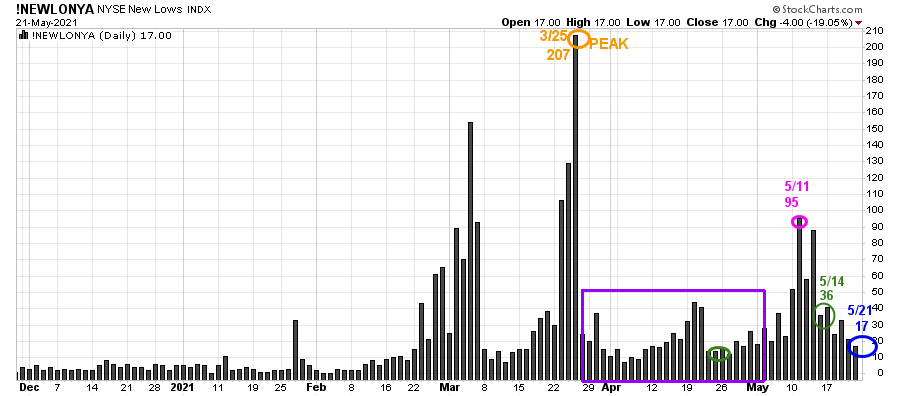
Source: Stockcharts.com
On 3/25, the NYSE New Lows peaked at 207 (orange circle) and immediately contracted (purple rectangle). Watching New lows on the New York Stock exchange is a simple technical tool that helps awareness about the immediate trend’s direction.
In my book, Journey to Wealth, when the New Lows are below 25, the market is very strong (Very Low Risk and prices tend to rise). When New Lows are between 25 and 50, risk is low, and the odds of a further rally are likely.
On 5/11, New lows on New York Stock exchange jumped to 95, their highest level since late March flashing a warning sign of possible weakness or a change in the market’s tone. However, New lows contracted immediately to 36 on 5/14 and closed on 5/21 at 17; the most bullish zone shows healthy underlying internal strength.
Continue to monitor the New Lows on the New York Stock Exchange. If New Lows begin to expand and have a succession of days over 95, the 5/11 high will imply a more severe correction may occur. On the other hand, if they remain low, the odds favor the advance will continue.
“Know what you own, and know why you own it.” – By Peter Lynch
ETFs to Monitor
Figure 3: Performance week of 5/14- 05/21
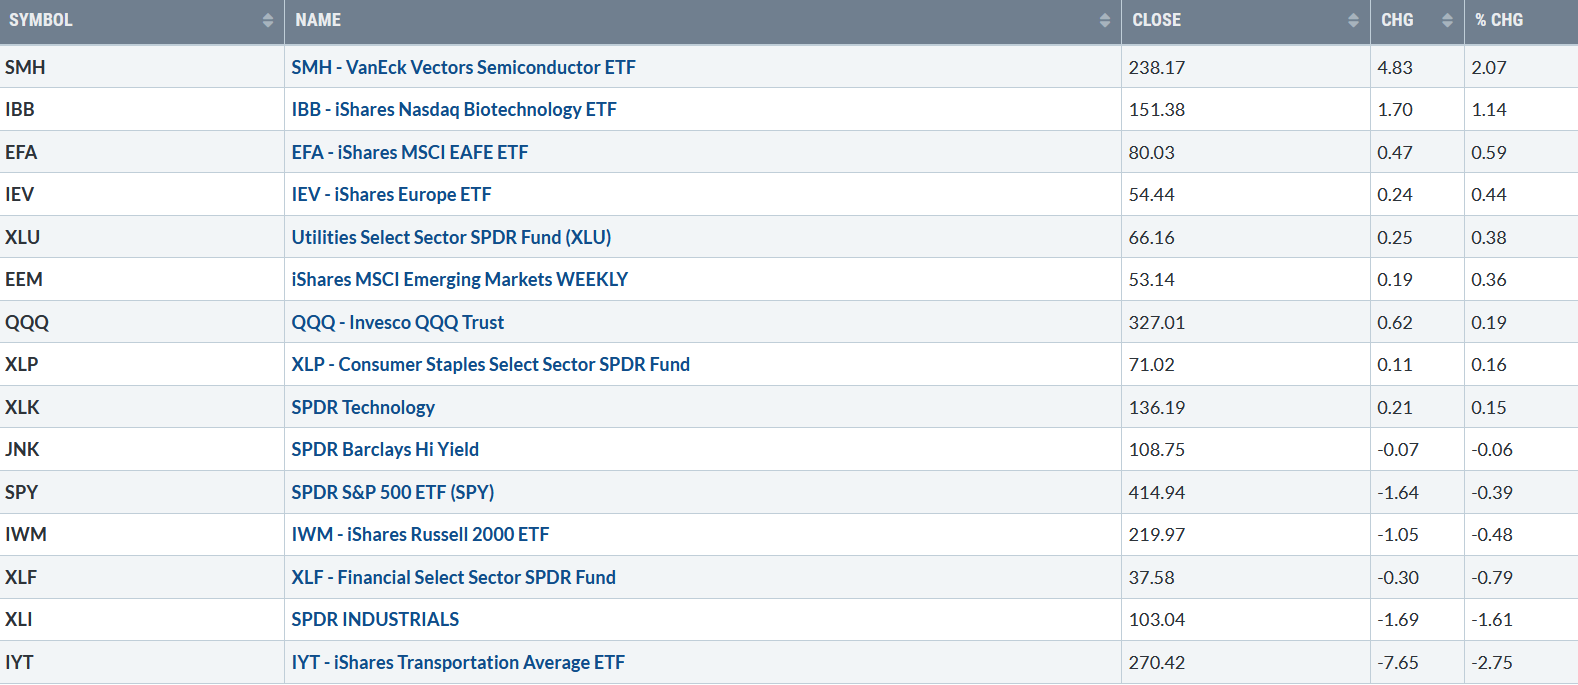
Source: Stockcharts.com
Positives
Figure 4: CNN Fear and Greed Index
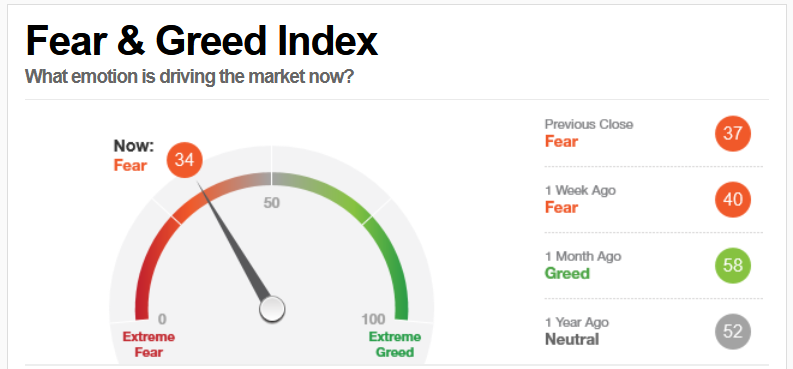
Source: CNN Business
Negatives
Figure 5: The Nasdaq Advance-Decline Line
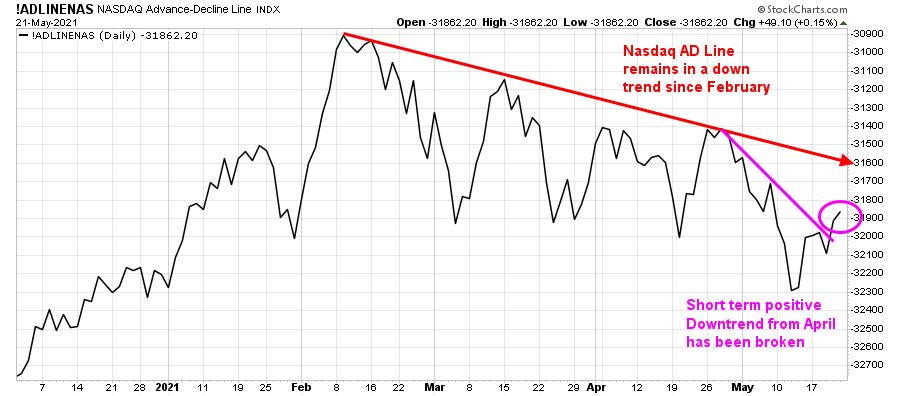
Source: Stockcharts.com
Figure 6: Ishares Transportation Average
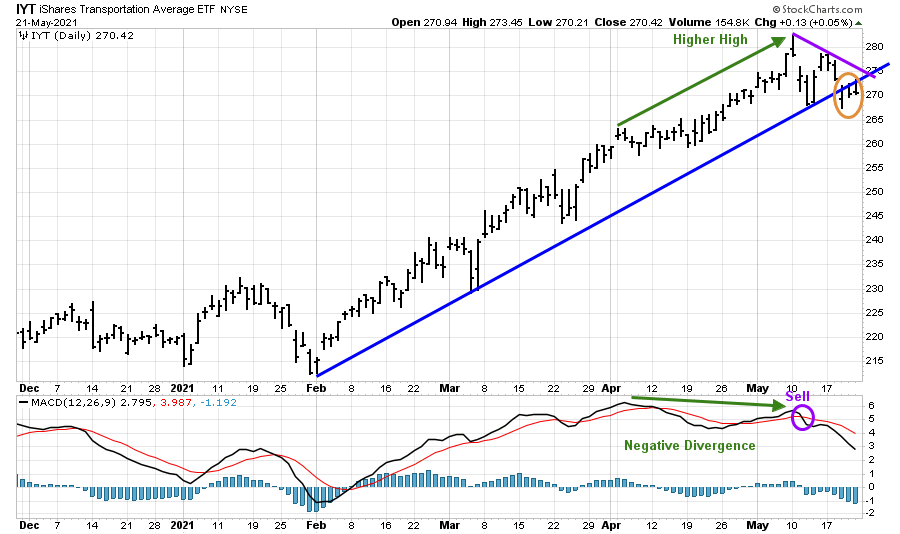 Source: Stockcharts.com
Key ETFs to pay attention 5/24 – 5/28
Watch if the Russell 2000 (IWM), Invesco Trust Nasdaq (QQQ), and Semiconductor (SMH) start to outperform the S&P 500 (SPY) for confirmation of a short-term bottom.
Figure 7: Daily iShares Russell 2000 (IWM) Price (Top) and 12-26-9 MACD (Bottom)
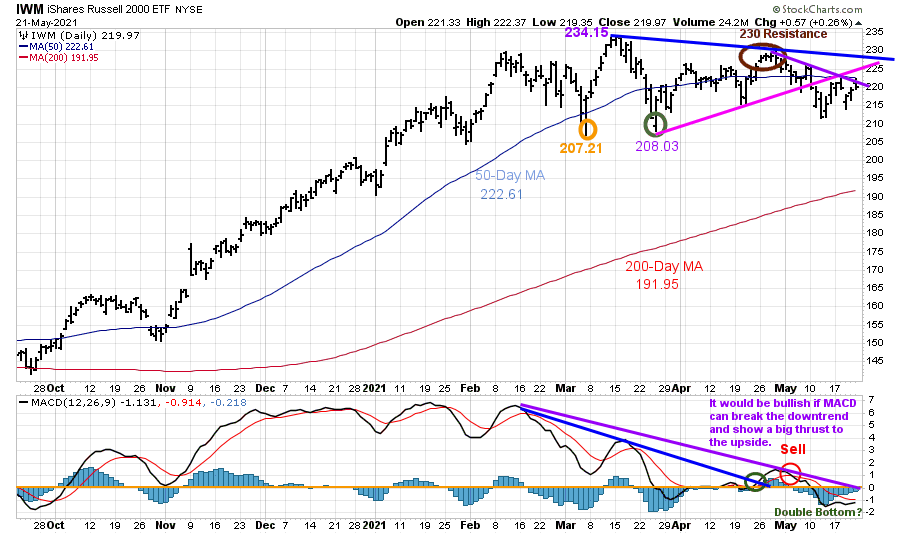
Source: Stockcharts.com
The top portion of the chart is the daily iShares Russell 2000 Index ETF (IWM), the benchmark for small-cap stocks, with a 50-Day Moving Average (blue line) and 200-Day Moving Average (red line) that traders watch and use to define trends.
IWM made a low on 3/5 at 207.21 (orange circle), then rallied to 234.15 but stalled. On 3/25 successfully tested its low at 208.03 (green circle). After, IWM rose but stalled at 230.00 resistance (brown circle). IWM then declined, breaking the uptrend and falling below support at 215.00.
IWM remains below the uptrend (pink line), and it closed below its 50-Day Moving Average of 222.6. IWM is at a critical point. It would be positive if IWM can close above its 50-Day MA at 222.61 for two days. This would also break the short-term downtrend from April (purple line).
Two key areas of resistance are just above, 225.00 followed by 230.00. A close above resistance at 230.00 (blue line) would break the March downtrend and imply a test of the old high and potentially more. On the other hand, a close below the March low at 207.21 would indicate a more serious decline is likely.
The bottom half of the chart is MACD (12, 26, 9), a measure of momentum. After MACD broke the short-term downtrend from February (blue line), there was no thrust to the upside, and MACD gave a sell signal, turning down from above 0. Now, there is a favorable rising double bottom as downside momentum has waned and MACD is close to generating a new buy.
In Sum
IWM no longer has a pattern of lower lows which is positive. If IWM can turn up and close above 222.61, the next target would be 225.00 and then 230.00. On the other hand, a close below 207.21 would imply more downside ahead.
Figure 8: Daily Invesco QQQ Trust Nasdaq (QQQ) Price (Top) and 12-26-9 MACD Bottom)
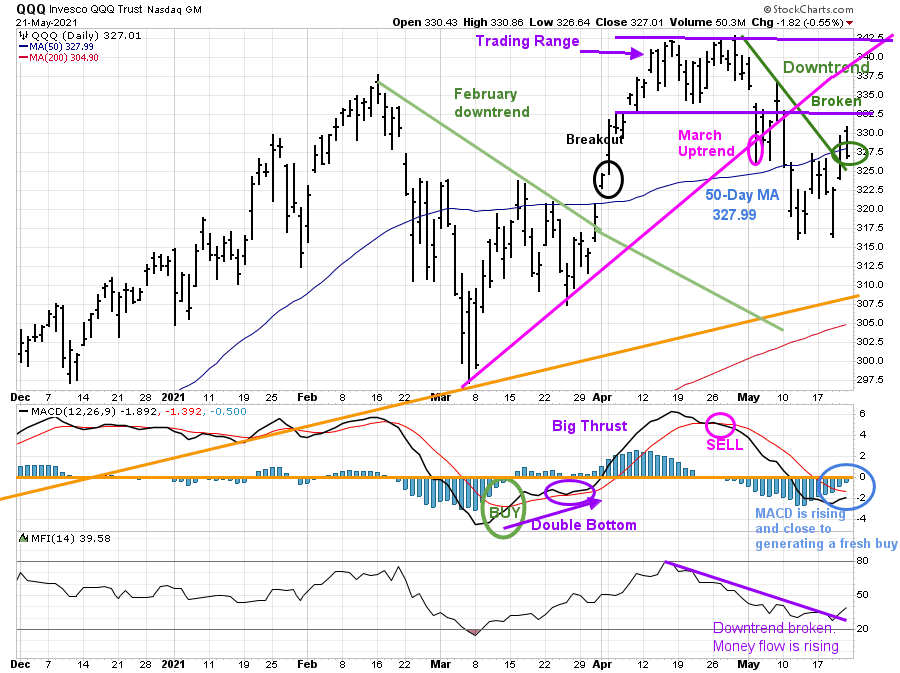
Source: Stockcharts.com
The top part of the chart shows the daily Invesco QQQ, an exchange-traded fund based on the Nasdaq 100 Index with its 50-Day Moving Average and 200-Day Moving Average. On 3/31, QQQ broke the downtrend from February (green line) and then gapped higher (black circle), breaking out to the upside. QQQ then stayed within a trading range for three weeks (purple) before a downtrend developed, turning the short-term trend down.
It’s bullish that last week the downtrend was broken (green line), shifting the short-term trend to up. It’s also bullish that money flow (the bottom chart) is rising and has broken its downtrend from April.
On the other hand, QQQ closed slightly below the 50 Day MA at 327.99 and remained below key resistance at 332.50 and 335.00. A close above 332.50 for two days would be positive and get the bulls excited.
The bottom half of the chart is MACD (12, 26, 9), a measure of momentum. After the March buy (green circle) and big thrust to the upside, MACD gave a quick sell, and MACD accelerated to the downside.
A different picture now. MACD is oversold, below 0, and is rising with diminishing downside momentum close to generating a new buy on strength.
QQQ is now in a short-term uptrend. A close below 307.50 would break the November uptrend (orange line) and imply a more serious decline and negate the bullish pattern that has developed.
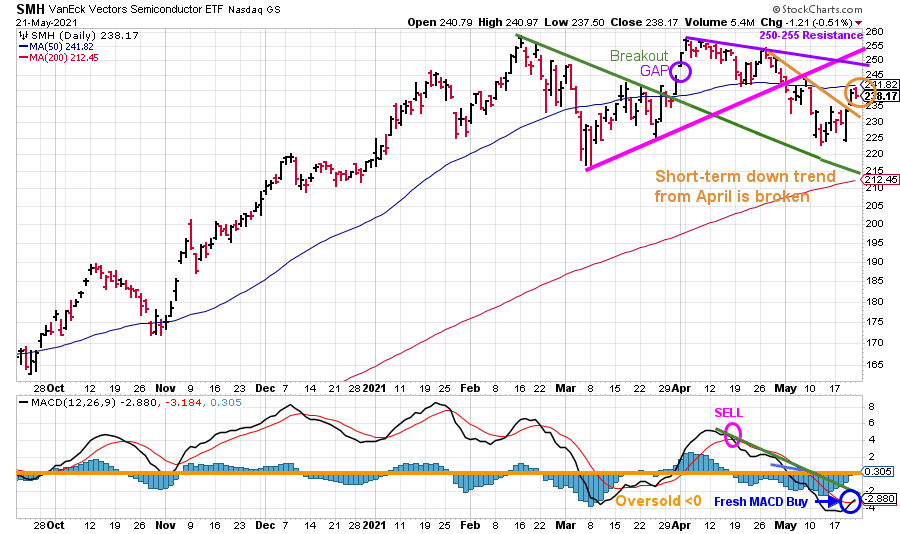
Figure 9: Daily Vaneck Vectors Semiconductor (SMH) Price (Top) and 12-26-9 MACD (Bottom)
Source: Stockcharts.com
The top chart shows Semiconductors (SMH) broke its March downtrend on 3/26 (green line). SMH then gapped up (purple circle), breaking out to a high of 256.68 on 4/8. SMH did not follow through to the upside and reversed.
Semiconductors (SMH) rose 2.07%, a leading sector for the week. Similar to QQQ, SMH broke its April downtrend, shifting the trend to up, bullish for the near term.
Resistance is at 241.00, followed by 245.00. Support is at 230.00 followed by 222.00.
The lower chart is MACD, a measure of momentum. MACD gave a fresh buy, the first sign that downside momentum has slowed. I expect the MACD downtrend to be broken over the next several days. Look for continued strength in SMH, which bodes well for the broad market. A close below 222.00 would negate my bullish outlook.
Summing Up:
The Dow and S&P 500 finished the week slightly lower while the Nasdaq had a small gain. Short-term downtrends in Technology (QQQ) and (XLK), as well as Semiconductors (SMH), have been broken, shifting the short-term trend to up. Momentum patterns show selling pressure has waned. Small caps which have been underperforming are also looking better. Bitcoin’s decline was the story last week. This week’s story may be a resurgence in growth and small-cap stocks. Time will tell. If the major averages close above the overhead resistance, the likelihood of another rally toward the old highs exists. On the other hand, if there is no follow-through to the upside and the early March lows are violated, then expect day-to-day volatility to increase substantially and a more serious correction to occur. The key closing numbers to watch for potentially a significant decline are below 207.21 for IWM and below 307.50 for QQQ.
Remember to manage your risk, and your wealth will grow.
I would love to hear from you. If you have any questions or comments click here.
Schedule a free 30 Minute Wealth and Well-Being strategy session now
If you liked this article, you would love my Free report, Grow and Sustain Your Wealth. Please get it here.

Disclaimer: Although the information is made with a sincere effort for accuracy, it is not guaranteed that the information provided is a statement of fact. Nor can we guarantee the results of following any of the recommendations made herein. Readers are encouraged to meet with their own advisors to consider the suitability of investments for their own particular situations and for determination of their own risk levels. Past performance does not guarantee any future results.


Create more wealth in your life
with these simple strategies.
As an added bonus you will also
receive BG’s Updates and Ezine

Discover how to quickly create more well-being in your life with these simple strategies.
As an added bonus you will also
receive BG’s Updates and Ezine

As an added bonus you will receive BG’s Updates and Ezine

All work listed on BonnieGortler.com is licensed under a Creative Commons Attribution - Noncommercial - No Derivative Works 3.0 Unported License.


Free Report:
Grow and Sustain Your Wealth
Discover how to grow your money with these easy, simple steps.

