

10 Simple Tips for Financial Well-Being
07/01/2026
It’s been a very difficult December for the bulls, one of the worst performances of the S&P 500 since 1931. On 12/19 the major averages S&P 500, Russell 2000, and Nasdaq all made new closing lows for the year after breaking below support levels, as they re-tested the October low. Selling has intensified in a normally favorable historical period. Almost 77% of stocks greater than or equal to $5.00 have had a 20% drawdown in 2018 through 12/14, based on a research study from our database by Glenn Gortler, Head of Research.
Market breadth remains weak,volatility is increasing and tape action remains poor. The CBOE Volatility Index (VIX), (the fear index) increased in December by 36% closing at 25.58 on 12/19. Even with the decline to date, stocks remain overvalued based upon earnings. Intraday rallies have had no upside momentum and are unable to be sustained. It’s troublesome the major averages have a pattern of giving back early gains and reversing mid-day, then closing near their lows. On the other hand, the broad market is very oversold for the short and intermediate term, market sentiment is improving with pessimism increasing, (a contrary indicator) and end of year tax selling could be winding down. However, right now the sellers remain in control more patience is needed for signs the decline is over. Even in the worst of markets,opportunities do occur.
At the time of this writing, there is not much for the bulls to be excited about, but 2019 is only a few days away for new opportunities in stocks and bonds. A recovery in the major averages now would be from a deeply oversold condition on both short and intermediate term momentum patterns, levels that have not been seen since 2016. Additional time is required for more favorable chart patterns to develop. The first thing needed is for prices to stop falling and begin a pattern of higher lows.
Where do we go from here?
Figure: Weekly iShares Russell 2000 Index (IWM) (top) and 12-26-9 MACD (bottom)
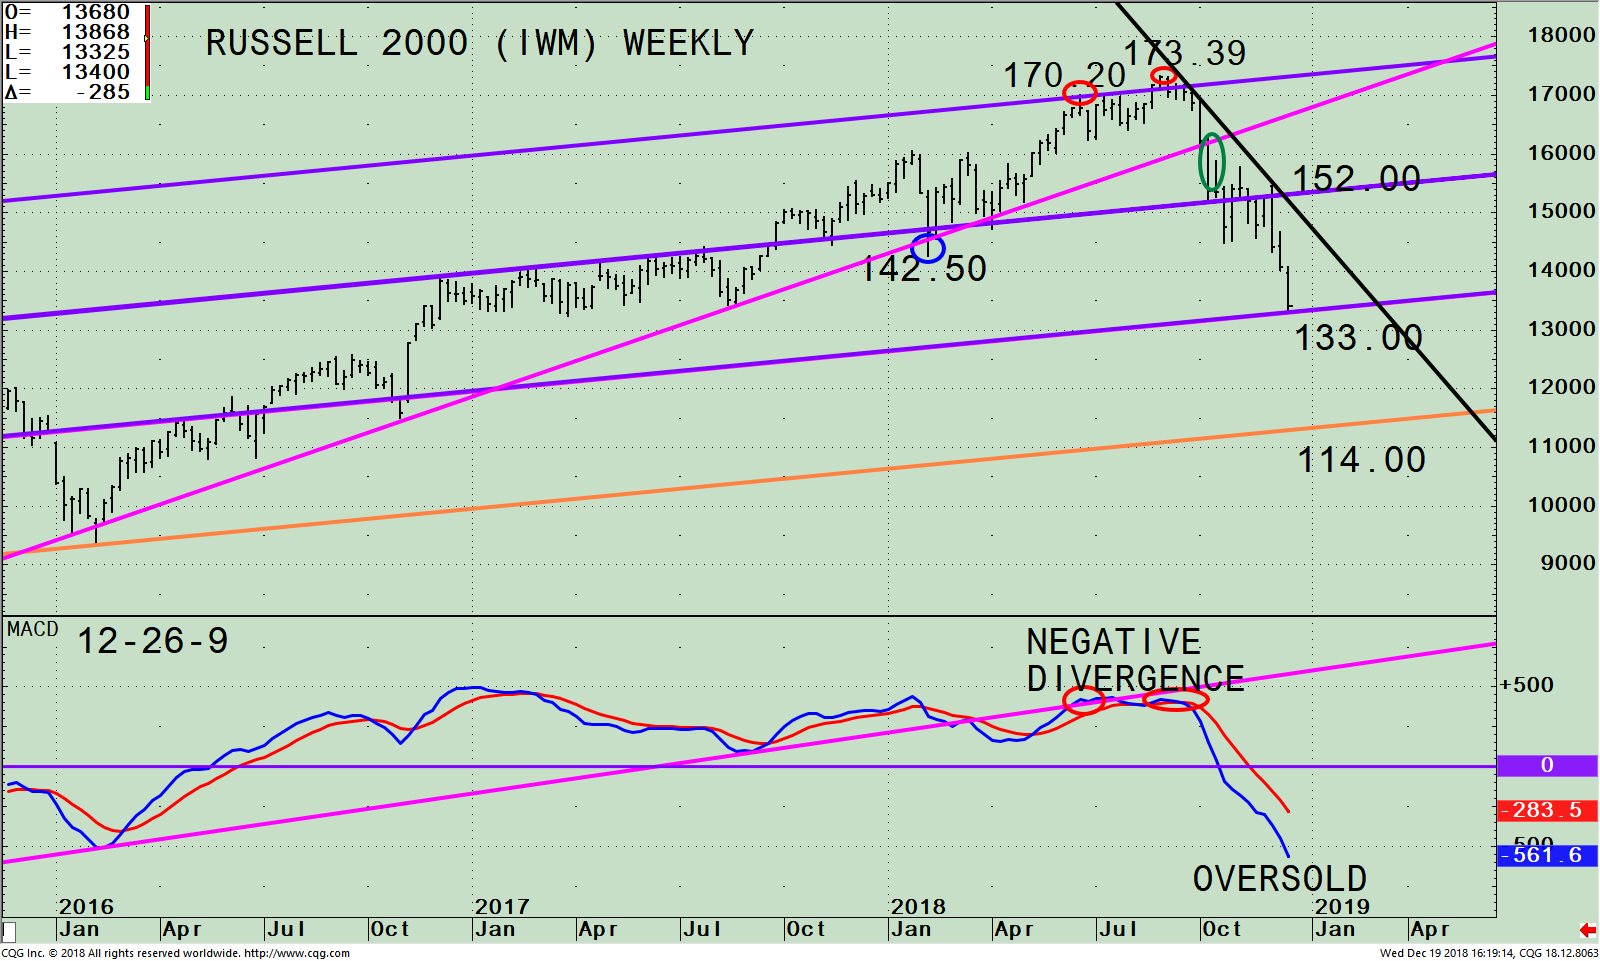
The top portion of the chart shows the weekly (intermediate-term) Russell 2000 (IWM)*** and its price channel (purple and orange lines), along with an equidistant channel giving a possible downside objective to 114.00. The IWM was in a clear uptrend (pink line) since February 2016 where it made a low at 142.50 (blue circle) except for one slight breach on 2/9/18. The IWM then rose to the upper channel on 6/20/18 at 170.20 (red circle), before peaking at 173.39 on 8/31/18 (second red circle). After the uptrend was violated on 10/10/18 (pink line) selling began and accelerated after breaking below support at 152.00. The IWM today, (12/19) made a low just above the lower channel objective at 133.00. The IWM continues to be weaker than the S&P in relative strength, not a good sign. The IWM has no clears signs of a bottom formation now presently. If the IWM has a weekly close below 133.00, a new downside objective to 114.00, approximately 14% down from today’s closing price of 133.96 will be given.
The lower portion of the chart is MACD, a technical indicator that measures momentum. MACD gave an initial sell signal in June 2018 (red circle on left) that was unconfirmed by any declining tops or negative divergences. Since IWM was in an uptrend at the time of this initial sell, it is recommended to disregard the initial sell signal and wait for a second sell to occur. MACD made a lower high, that did not confirm (red circle on right) the IWM price high of 173.39 on 8/31/18, forming a negative divergence. Since then, MACD has accelerated lower and the IWM has declined to new lows. MACD is now below 0, (purple line), very oversold, at the lowest reading since 2016. A bounce is due. However, with MACD still pointing down and no positive divergence in place, the risk remains high.
Summing Up:
Small caps have been lagging in relative strength compared to the S&P 500 (SPY) after sharp gains were made in the Russell 2000 early in the year. It’s likely the first rally attempt will fail and test the low. Until weekly MACD flattens at a minimum, or a turn up occurs, bottom fishing is dangerous. Market volatility will likely continue in 2019. Concerns remain about the economy, rising interest rates, and corporate profits. A safer sustainable rally is possible in 3 – 6 weeks after the low is made. If the IWM has a weekly close below 133.00, which I’m expecting, I would look for more volatility and the decline to accelerate to a potential downside objective of 114.00 approximately 14% lower than 12/19 closing price of 133.96. For now, don’t be in a rush to buy until you see several days where the IWM outperforms the S&P 500.
Investment Tip:
Age doesn’t matter, whether you are 20, 50, or 80 years old, you don’t want to worry about your investments. You want to be able to sleep at night. My rule is if you are not sleeping at night and are waking up thinking about your investments; your investments are too volatile and are not the correct investments for you. Consider taking some immediate action making a change to your portfolio. Even a small reduction or change can make a difference. You can decrease in phases to reduce volatility. This will reduce your risk, give you more peace of mind, and still allow you the capability to make money.
I would love to hear from you. Please call me at 516-829-6444 or email at bgortler@signalert.com to share your thoughts or ask me any questions you might have.
I want to wish you and your family a very Happy Holiday Season and a Prosperous New Year.
**The iShares Russell 2000 Index ETF (IWM) is made up of companies with a market capitalization of between $300 million and $2 billion. The portfolio top 5 sector holdings as of 12/18/18 are Financials 24.18%, Health Care 14.84%, Industrials 14.69%, Consumer Cyclicals 14.30%, and Technology 12.55%. (Source: http://www.etf.com/IWM)
Sign up for a FREE 3 issue trial of
SYSTEMS AND FORECASTS Click here
******Article published in Systems and Forecasts by Bonnie Gortler December 21, 2018
Disclaimer: Although the information is made with a sincere effort for accuracy, it is not guaranteed that the information provided is a statement of fact. Nor can we guarantee the results of following any of the recommendations made herein. Readers are encouraged to meet with their own advisors to consider the suitability of investments for their own particular situations and for determination of their own risk levels. Past performance does not guarantee any future results.

If you like this article you would love the free
excerpt chapter of my book Journey to Wealth.
Get instant access here


Create more wealth in your life
with these simple strategies.
As an added bonus you will also
receive BG’s Updates and Ezine

Discover how to quickly create more well-being in your life with these simple strategies.
As an added bonus you will also
receive BG’s Updates and Ezine

As an added bonus you will receive BG’s Updates and Ezine

All work listed on BonnieGortler.com is licensed under a Creative Commons Attribution - Noncommercial - No Derivative Works 3.0 Unported License.


Free Report:
Grow and Sustain Your Wealth
Discover how to grow your money with these easy, simple steps.

