

10 Simple Tips for Financial Well-Being
07/01/2026
The summer rally seems to be picking up steam. The S&P 500 and the Nasdaq have made record highs. The Dow Industrial is not as strong as other indices is now near its February highs. The Russell 2000 (IWM) and Mid-Cap Growth (MDY) indices are performing well suggesting further gains lie ahead. They recently broke through their resistance levels at 170.00 and 367.00 respectively, now acting as good support areas. The technology sector (QQQ) has regained its luster, led by Apple (AAPL) and a rebound in semiconductor stocks (SMH). Weekly market breadth has been improving the last few weeks, also showing signs that the rally is intensifying as more and more stocks are participating. If market breadth is favorable, this would bode well for further gains in 2018 including additional sectors of the market to participate.
A buying opportunity in Healthcare (XLV)
Figure: Health Care Select SPDR (XLV) Weekly Price Channel, top) and 12-26-9 MACD (bottom)
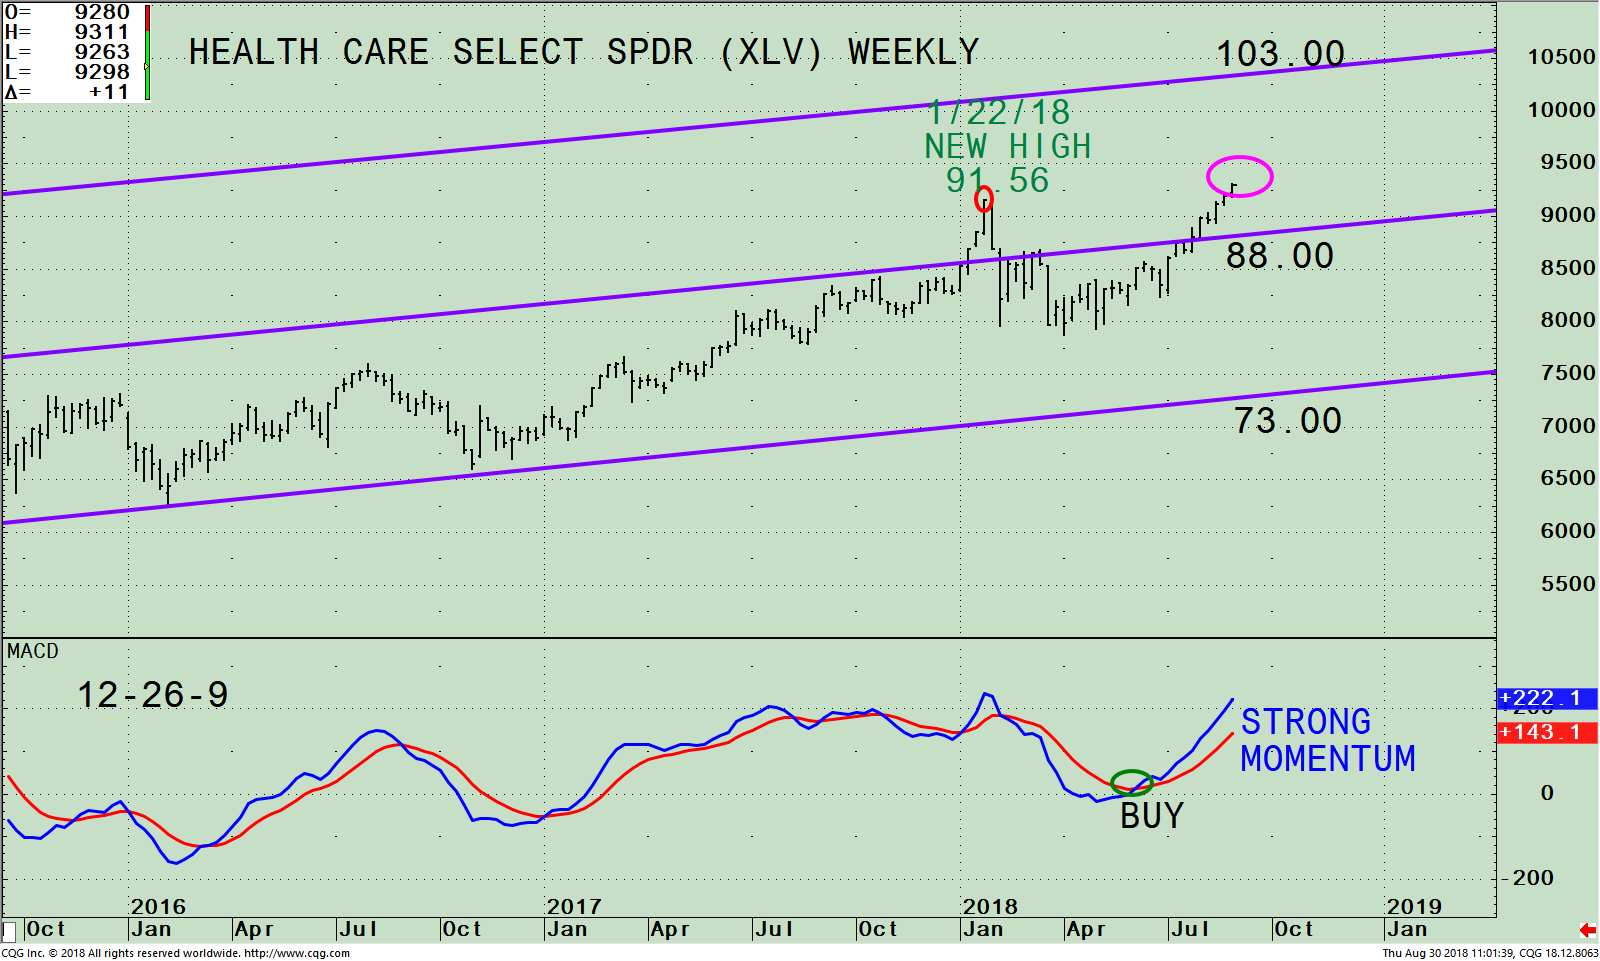
The chart above is the weekly (intermediate) price channel (purple lines) of the SPDR Health Care (XLV) ETF. The Health Care Select Sector SPDR tracks healthcare stocks from within the S&P 500 Index predominantly in the Pharmaceutical industry and Healthcare Equipment & Supplies totaling 66.73%. The top 5 holdings as of 08/29/18 are Johnson & Johnson 10.10%, (JNJ), UnitedHealth Group Incorporated 7.16% (UNH), Pfizer Inc. 6.79% (PFE), Merck & Co., Inc. 5.18% (MRK) and AbbVie, Inc.4.15% (ABBV) totaling 33.38%. Source: https://www.etf.com/XLV#overview This week XLV surpassed its old high on 1/22/18 of 91.56 trading at 92.74. The upside objective is 103.00, approximately a 10% potential gain.
It’s not uncommon after a new high is made, a short-term pullback occurs. Support is at 88.00, an ideal buy area if there is a weakness in the near term, a likely area where the XLV should hold. If you are looking for a MACD oversold condition in XLV, you would have to wait for the weekly MACD fell below zero which is not likely over the next several months.
Summing Up:
The XLV is trading near its highs for 2018 and is clearly gaining momentum. Now is the time to buy healthcare for your investment portfolio. Key support area on any near-term weakness is 88.00.
Figure: Monthly Health Care Select SPDR (XLV) / S&P 500 (SPY) Index Ratio (Top) 12-26-9 MACD of XLV/SPY Ratio (Bottom)

The top part of the chart is the monthly Health Care Select SPDR (XLV) / S&P 500 Index Ratio (XLV/SPY). The XLV/SPY ratio peaked in July 2015 (blue circle). A rising line means the XLV is stronger, and if falling, the SPY is stronger.
In July 2018 the XLV/SPY ratio turned up (red circle), is no longer falling. Also, the downtrend from July 2015 (orange line) has been broken. This is bullish for healthcare, XLV is now stronger than the S&P 500 (SPY).
The lower portion of the chart is MACD of XLV/ SPY. Momentum has stopped falling and a MACD buy signal (blue circle) has been generated confirming a change of leadership from SPY to XLV.
Summing Up:
Healthcare compared to the S&P 500 has been in a long-term downtrend since July 2015. The downtrend from July 2015 has been broken. You can now look forward to a potential change of leadership and outperformance to healthcare over the next several weeks to months. With the trend favorable, if you have cash on the sidelines, or if you are overly exposed in one sector, now is a good time to invest 5-10% in healthcare (XLV) where the long-term trend will be supporting your investment.
Drop me a line! I’d love to hear from you. Please call me at 516-829-6444 or email at bgortler@signalert.com to share your thoughts or ask me any questions you might have.
Sign up for a FREE 3 issue trial of
SYSTEMS AND FORECASTS Click HERE
******Article published in Systems and Forecasts by Bonnie Gortler August 31, 2018
Disclaimer: Although the information is made with a sincere effort for accuracy, it is not guaranteed that the information provided is a statement of fact. Nor can we guarantee the results of following any of the recommendations made herein. Readers are encouraged to meet with their own advisors to consider the suitability of investments for their own particular situations and for determination of their own risk levels. Past performance does not guarantee any future results.


Create more wealth in your life
with these simple strategies.
As an added bonus you will also
receive BG’s Updates and Ezine

Discover how to quickly create more well-being in your life with these simple strategies.
As an added bonus you will also
receive BG’s Updates and Ezine

As an added bonus you will receive BG’s Updates and Ezine

All work listed on BonnieGortler.com is licensed under a Creative Commons Attribution - Noncommercial - No Derivative Works 3.0 Unported License.


Free Report:
Grow and Sustain Your Wealth
Discover how to grow your money with these easy, simple steps.

