

10 Simple Tips for Financial Well-Being
07/01/2026
Breakout in Midcap Growth (MDY) Suggests More Profits Ahead
September, historically a weak month is off to a negative start. However, the intermediate-term outlook remains positive. Despite the recent short-term sell-off, the major averages remain near all-time highs. News of tariffs, trade wars, and rising interest rates have caused some day to day increased volatility. However, no significant decline to alter the bullish trend of the U.S. market.
Where do we go from here?
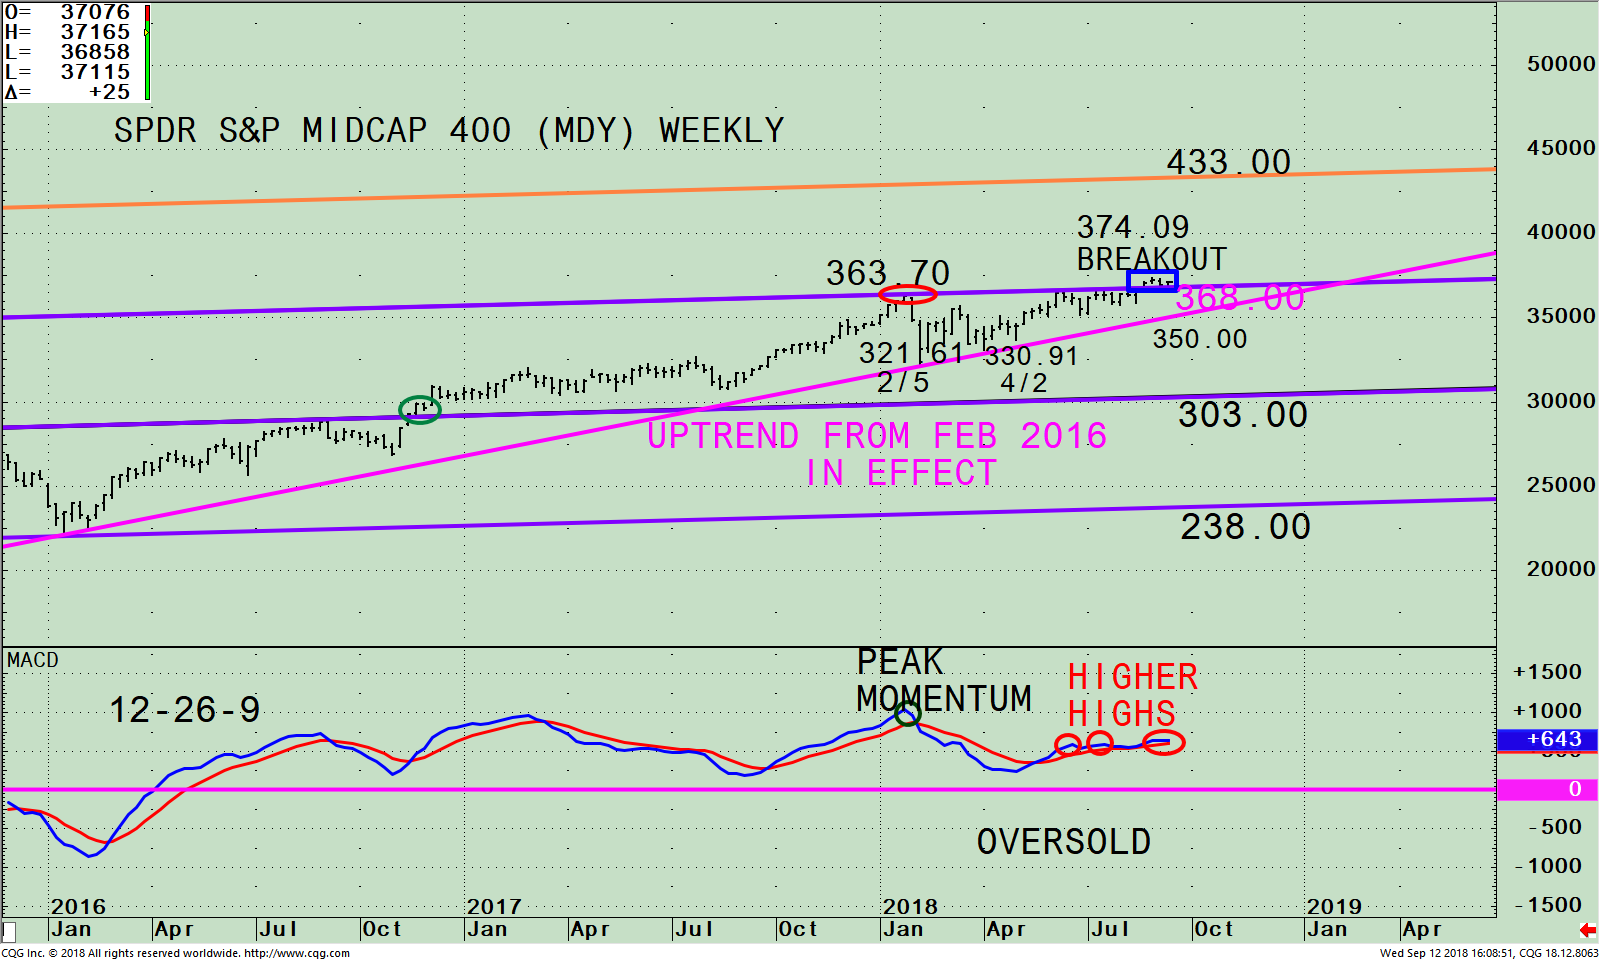
Figure: The SPDR S&P MidCap 400 (MDY) Weekly and Trend Channels (Top), and MACD 12-26-9 (Bottom)
The SPDR S&P MidCap 400 Index Trust ETF (MDY) tracks a market-cap-weighted index of mid-cap U.S. companies, made up of 400 stocks in a broad mix of major industry groups without either a growth or value bias. As of 9/12/18, the top 5 sectors in the S&P Mid-Cap 400 Index are Technology 16.00%, Financials 16.00%, Industrials 15.00%, Consumer Cyclicals 13.00% and Healthcare 9.0%.Source http://etfdb.com/etf/MDY/
The chart above is the weekly SPDR S&P Mid-Cap 400 Index ETF (MDY) and its weekly (intermediate-term) price channel (purple lines) along with an additional channel giving an upside objective to 433.00 (orange line). The MDY has been trading above the middle-channel since November 2016 (green circle). In late January 2018, the MDY hit its upper channel objective at 363.70 (red circle) but was unable to get through the upper channel. A decline of almost 12% followed where the MDY bottomed at 321.61 on 2/5. The MDY remained in a trading range for several weeks, before successfully testing the February low on 4/2 at 330.91. Another rally attempt began, but once again stalled at the upper channel.
A bullish development has occurred. The MDY has penetrated its upper channel (blue rectangle) which has been resistance and has now closed above the channel the past several weeks. This suggests the likelihood that the MDY will work its way higher towards the upper channel at 433.00. It’s also positive that the MDY has been in a weekly uptrend (pink line) since February 2016 without being broken. This is a sign of strength. I am expecting near-term support at 368.00 to hold, also coinciding with the daily breakout on the MDY daily chart.
The bottom half of the chart shows MACD, a measure of momentum. MACD peaked in momentum in January (green circle). MACD rose to an extreme reading of almost 1,000, but when it turned down, it didn’t fall enough to reach go below 0 (pink line) to generate a fresh entry. After turning up, notice how MACD made higher highs as MDY made new highs (red circles) on the recent rally.
I am interpreting the most recent highs in MACD as a sign of underlying strength, rather than focusing on the fact that MACD has been unable to make a higher momentum high compared to the peak reading in January. The breakout in Midcap Growth (MDY) suggests more profits ahead as the pullback in September is a normal retracement after breaking out of its channel.
Summing Up.
It’s not a time to get too bearish. A favorable seasonal period will be starting in October. I would be concerned only if the MACD falls sharply now to generate a sell and MDY breaks below the May 9 low at 349.95. Our U.S. equity market models indicate a generally favorable investment climate now and is in position to be moving to the best level where risk is low. Any near-term weakness that may occur, most likely would be limited and would be a buying opportunity.
Drop me a line! I’d love to hear from you. Please call me at 516-829-6444 or email at bgortler@signalert.com to share your thoughts or ask me any questions you might have.
Sign up for a FREE 3 issue trial of SYSTEMS AND FORECASTS Click HERE
******Article published in Systems and Forecasts by Bonnie Gortler September 13, 2018
Disclaimer: Although the information is made with a sincere effort for accuracy, it is not guaranteed that the information provided is a statement of fact. Nor can we guarantee the results of following any of the recommendations made herein. Readers are encouraged to meet with their own advisors to consider the suitability of investments for their own particular situations and for determination of their own risk levels. Past performance does not guarantee any future results.


Create more wealth in your life
with these simple strategies.
As an added bonus you will also
receive BG’s Updates and Ezine

Discover how to quickly create more well-being in your life with these simple strategies.
As an added bonus you will also
receive BG’s Updates and Ezine

As an added bonus you will receive BG’s Updates and Ezine

All work listed on BonnieGortler.com is licensed under a Creative Commons Attribution - Noncommercial - No Derivative Works 3.0 Unported License.


Free Report:
Grow and Sustain Your Wealth
Discover how to grow your money with these easy, simple steps.

