

10 Simple Tips for Financial Well-Being
07/01/2026
What a difference a month made. The bulls disappeared. The bears came out of hibernation. Foreign and United States markets fell sharply in October. Traders focused on rising interest rates, trade tensions with China and the midterm-election. The S&P 500 Index fell 6.9%, its biggest one-month loss since 2011. The Nasdaq lost 9.2%, the biggest decline since November 2008. Volatility rose sharply, measured by the fear index (VIX), rising 96.7%, (12.12 – 23.35). However, VIX closed the month well-below its peak reading at 28.84 on October 11, not making a higher high, when all the major averages fell to a new low. This is a positive sign for the near term that the worst may be behind us for now. However, some technical damage has been done for the intermediate term on several major indices that bears watching closely. Keep an eye on technology stocks in the near term to see if they gain strength and show leadership as they did early in the year, or if technology stocks show weakness and start to decline.
Where do we go from here? Watch Technology closely.
Figure: PowerShares QQQ (Nasdaq 100 Index) Weekly Price and Trend Channels (top), and the 12-26-9-week MACD (bottom)
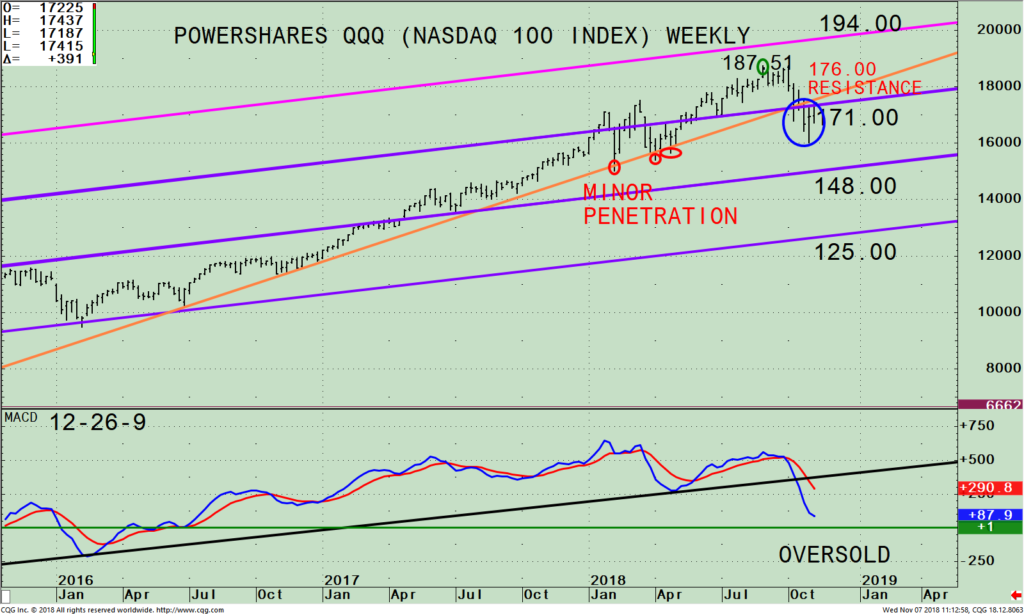
The top part chart shows the weekly PowerShares (QQQ), an exchange-traded fund based on the Nasdaq 100 Index, and its active trend channels (purple line). *** See below for top holdings.
The technology sector has been one of the strongest areas of the stock market until the recent decline. There were only a few minor intra-week penetrations in January and in March (see red circle). Each time the QQQ immediately went back above the trendline and recovered to make new all-time highs. This time the pattern is different. The QQQ has remained below the uptrend line (blue circle) for several weeks, and so far, is unable to get enough upside momentum to get above the upside trendline. This bears watching. If the QQQ rises now and gets above the uptrend line, the odds favor another test of the old highs. On the other hand, if the QQQ doesn’t hold and turns down taking out the recent low, the selling pressure could increase.
Resistance is 171.00 followed by 176.00. Support is at 160.00 followed by 148.00. If the QQQ falls below support at 160.00 on a weekly close this would mean the year-end rally may not occur. The next downside targets are 148.00 followed by 125.00.
The bottom half of the chart is MACD (12, 26, 9), a measure of momentum. MACD is falling, not yet below 0, an oversold condition. MACD is still showing signs of weak momentum with MACD pointing down with no sign of a bottoming formation, which could take a few weeks.
Summing Up/Recommendation
Favorable seasonality suggests higher prices lie ahead. The short-term is oversold in position for a short-term rally. However, it’s a bit of a mixed picture as the intermediate momentum patterns in the QQQ and other major averages suggest a bumpier ride may be in store over the next several weeks, as momentum patterns still are falling. Because of the thrust to the downside in price and poor market breadth, the odds favor another test of the October low in late November or early December.
I recommend keeping an eye on the top holdings in the QQQ (see below***). The top holdings rising are important for the QQQ to recover and close above the intermediate trendline that was violated. The Nasdaq is no longer leading in relative strength compared to the S&P 500 on a daily, weekly and monthly time frame. This is a sign of weakening underlying momentum that implies increased risk. If you are heavily invested in technology stocks, I recommend lightening up your technology exposure into any strength over the next few weeks. Be alert if the present rally stalls and the QQQ falls below support at 160.00 on a weekly close. This would imply your opportunity to sell into strength will have passed and potentially a serious decline could occur.
*** The QQQ includes 104 of the largest domestic and international nonfinancial companies listed on the Nasdaq. As of 11/6/18, the top holdings are Apple, (AAPL) 12.19%, Microsoft Corp (MSFT) 10.32%, Amazon.com, Inc. (AMZN) 9.94%, Alphabet Inc. (GOOG) 4.56%, Facebook, Inc. (FB) 4.49%, and Alphabet Inc. (GOOGL), 3.95% totaling 45.45%.
I would love to hear from you. Please call me at 516-829-6444 or email at bgortler@signalert.com to share your thoughts or ask me any questions you might have.
Sign up for a FREE 3 issue trial of
SYSTEMS AND FORECASTS
Click here
******Article published in Systems and Forecasts by Bonnie Gortler November 8, 2018
Disclaimer: Although the information is made with a sincere effort for accuracy, it is not guaranteed that the information provided is a statement of fact. Nor can we guarantee the results of following any of the recommendations made herein. Readers are encouraged to meet with their own advisors to consider the suitability of investments for their own particular situations and for determination of their own risk levels. Past performance does not guarantee any future results.

If you like this article you would love the free
excerpt chapter of my book Journey to Wealth.
Get instant access here


Create more wealth in your life
with these simple strategies.
As an added bonus you will also
receive BG’s Updates and Ezine

Discover how to quickly create more well-being in your life with these simple strategies.
As an added bonus you will also
receive BG’s Updates and Ezine

As an added bonus you will receive BG’s Updates and Ezine

All work listed on BonnieGortler.com is licensed under a Creative Commons Attribution - Noncommercial - No Derivative Works 3.0 Unported License.


Free Report:
Grow and Sustain Your Wealth
Discover how to grow your money with these easy, simple steps.

