

10 Simple Tips for Financial Well-Being
07/01/2026
The Dow Industrials, S&P 500, and Nasdaq all showed gains for the quarter. The Nasdaq was the strongest while the Dow Industrials were the weakest. Most overseas markets, especially emerging markets are underperforming the U.S. this year. Trade war tensions remain with the European Union (EU) and China which has kept investors cautious in recent weeks. Market internals are not as strong as early in the year. Market breadth has shown signs of weakening with new 52-week lows increasing and new 52-week highs shrinking. (Editor’s note: the advance-decline line is solid however.) Volume patterns that were favorable have turned down and are in oversold condition. Although rallies often begin from oversold conditions when indicators turn up to indicate that the weakness is abating, such a turn has not begun. It is nonetheless and encouraging sign the decline has held key support levels and the long-term trend remains up, nowhere close to breaking down.
Where do we go from here?
Figure: S&P 500 SPDR ETF Monthly Price (SPY, top) and MACD 12-26-9 (bottom)
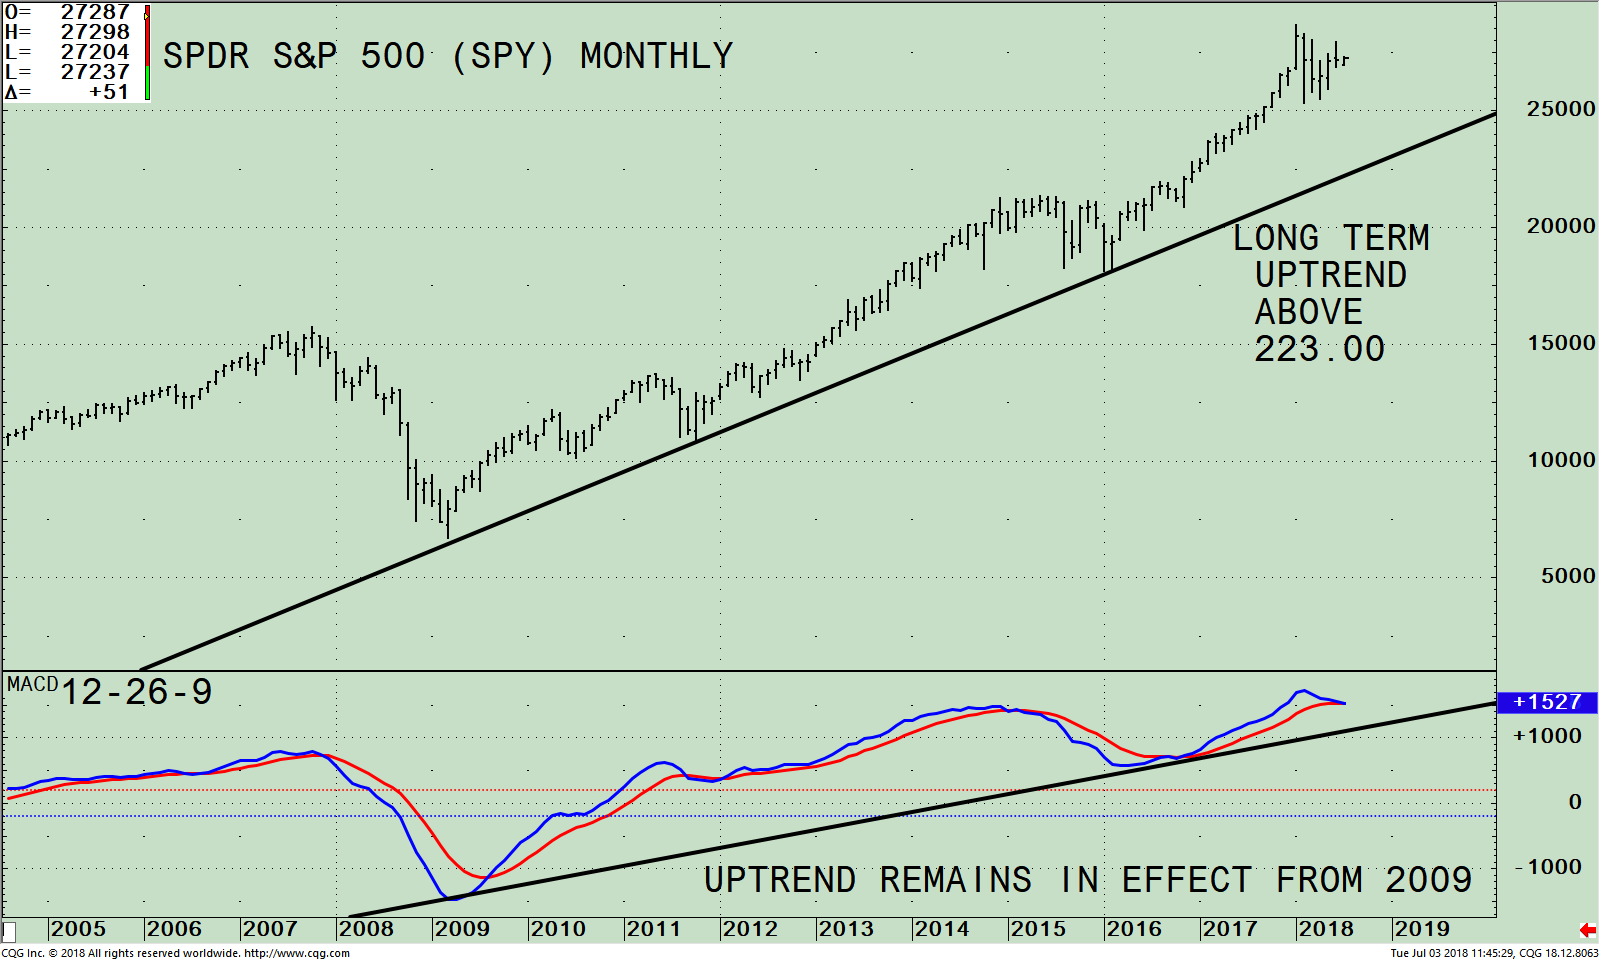
The chart above is the monthly (long-term price of the SPDR S&P 500 (SPY). It’s made up of 500 stocks of the largest companies in the U.S. As of 6/30/18, the top 5 holdings in the S&P 500 were Apple Inc. (AAPL) 3.91%, Microsoft Corporation (MSFT) 3.28%, Amazon (AMZN) 2.94%, Facebook Inc. Class A (FB) 2.06%, and Berkshire Hathaway Inc. Class B (BRK/B) 1.55%, totaling 13.74%. The top 5 sectors are: Technology 26.63% Financials 16.84%, Healthcare 13.28% Consumer Cyclicals 13.04% and Industrials 10.40%, totaling 80.25%. Source: http://www.etf.com/SPY.
When you invest in the S&P 500 (SPY), you will get a diverse representation of the large-cap U.S. stock market. If technology and or financials falter, the S&P 500 (SPY) could lag as the summer progresses. On the other hand, if technology and financials are strong the odds are likely the S&P 500 (SPY) will rise and make a new high.
The SPY remains in an uptrend that began in 2009 (black line). Until this trendline is broken, the long-term trend would be considered favorable. Any decline that occurs would present a potential buying opportunity. The long-term trend will remain positive if the SPY is above 223.00 (this number will rise each month). Once this trendline is broken, the long-term trend would turn negative, it could be harder to make money, and could signal the end of the present bull market.
An ideal buying opportunity is when the daily, intermediate (weekly) and monthly MACD gets into an oversold condition, below 0 and turns up. The odds that this condition will occur over the next few months is unlikely. However, the good news is that daily MACD is oversold and below 0. During the past year, this condition has happened three times, in February, April, and May. All three times the S&P 500(SPY) rallied. With this pattern in place, I am anticipating another rally attempt sooner than later. When MACD turns up, this will signify the downside momentum has subsided. For now, the bulls remain in control.
The bottom half of the chart shows MACD, a momentum indicator. It’s positive, the monthly MACD confirmed the high made in the S&P 500 (SPY) this year. It’s also encouraging the MACD uptrend from 2009 is intact (black line). It’s unlikely any decline now would be the final market top.
Summing Up:
The long-term major trend in the S&P 500 (SPY) remains up, and is not in jeopardy now if the SPY remains above 223.00.
Drop me a line! I’d love to hear from you. Please call me at 516-829-6444 or email at bgortler@signalert.com to share your thoughts or ask me any questions you might have.
Sign up for a FREE 3 issue trial of
SYSTEMS AND FORECASTS Click HERE
******Article published in Systems and Forecasts by Bonnie Gortler July 5, 2018
Disclaimer: Although the information is made with a sincere effort for accuracy, it is not guaranteed that the information provided is a statement of fact. Nor can we guarantee the results of following any of the recommendations made herein. Readers are encouraged to meet with their own advisors to consider the suitability of investments for their own particular situations and for determination of their own risk levels. Past performance does not guarantee any future results.


Create more wealth in your life
with these simple strategies.
As an added bonus you will also
receive BG’s Updates and Ezine

Discover how to quickly create more well-being in your life with these simple strategies.
As an added bonus you will also
receive BG’s Updates and Ezine

As an added bonus you will receive BG’s Updates and Ezine

All work listed on BonnieGortler.com is licensed under a Creative Commons Attribution - Noncommercial - No Derivative Works 3.0 Unported License.


Free Report:
Grow and Sustain Your Wealth
Discover how to grow your money with these easy, simple steps.

