

10 Simple Tips for Financial Well-Being
07/01/2026
As the summer approaches, a time when historically market declines occur, the tape action suggests there is no sign of an imminent market top. Small and mid-cap stocks have been gaining strength compared to the Dow and S&P 500, while the Nasdaq achieved a new all-time high. The bulls remain in control for now. However, trouble could be brewing in the financial sector.
Where do we go from here?
Figure: SPDR Regional Banking ETF (KRE) Weekly Price and Trend Channels (Top), and MACD 12-26-9 (Bottom)
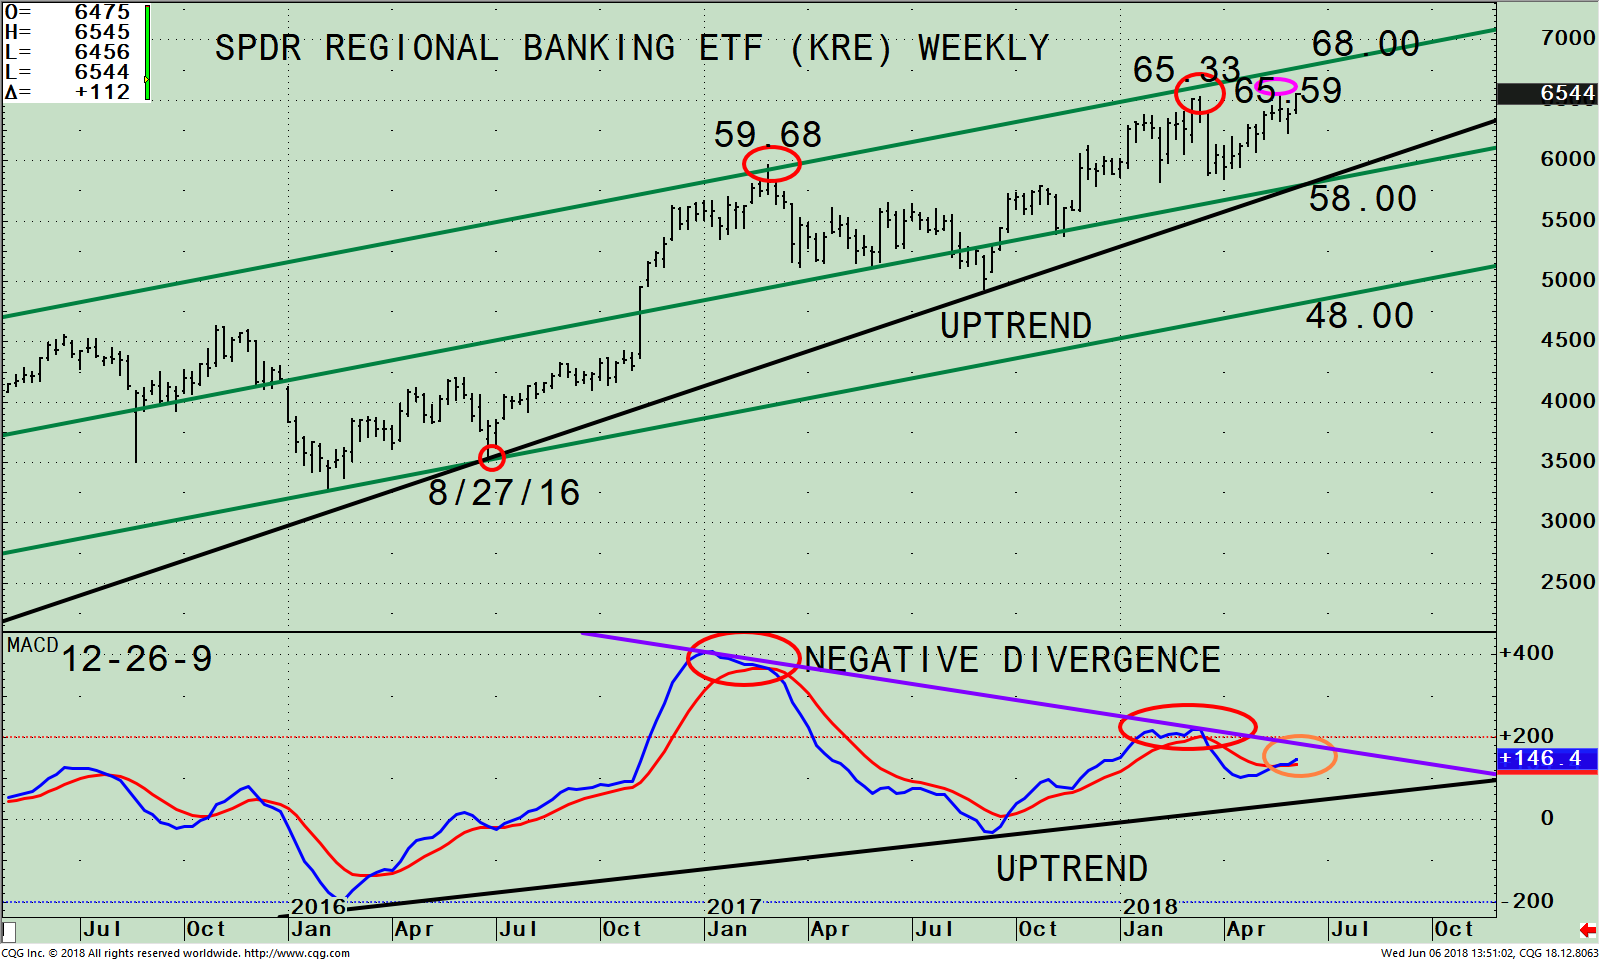
The top part of the chart shows the weekly SPDR Regional Banking (KRE), and its trading channel (green lines). KRE is an exchange-traded-fund (ETF) that began in 2006 and tracks an equally weighted index of common stocks including leading regional banks or thrifts (savings and loan associations). As of 06/5/18, the top holdings of KRE are SVB Financial Group (SIVB) 2.25%, East West Bancorp, Inc. (EWBC) 2.00%, Texas Capital Bancshares, Inc. (TCBI) 1.99%, Cullen/Frost Bankers, Inc. (CFR) 1.96%, First Republic Bank (FRC) 1.95%, PacWest Bancorp (PACW) 1.93% and Synovus Financial Corp (SNV) 1.90 totaling 13.98%.
Regional Banks (KRE) can be highly volatile at times even though it has less than 3% in its top stocks. When it is strong, this is a positive sign for the market there is more upside to follow. However, when KRE lags it tends to be a warning sign a potential short-term trend change might occur. KRE made a new high on 5/22/18. However, KRE failed to reach its channel objective at 68.00 implying KRE could struggle in the coming months as investors shift away from financials into another sector. The good news is the uptrend from 08/27/16 (black line) remains in effect. A close above the top channel at 68.00 would be bullish.
Key support is at the middle channel which coincides with the current uptrend line at 58.00. A break below 58.00 on a weekly close would change the intermediate trend from up to down and could have bearish implications for the broad market. The downside objective would be 48.00.
The lower portion of the chart is MACD (12, 26, 9), a technical indicator that measures momentum. MACD remains above 0, but momentum is waning with a series of lower highs, not a good sign. Its worrisome a negative divergence remains in place from the high in March 2018 compared to the peak in early 2017 (red circles). KRE made a new high in May, but MACD clearly has not confirmed the new high and has formed another negative divergence (orange circle), a worrisome pattern that bears watching. If KRE continues to lose momentum and MACD breaks the uptrend, (black line), this would be a warning KRE is likely to fall. If KRE gains momentum and takes out the downtrend (purple line) this would negate the bearish negative divergence and imply further gains towards the upper channel at 68.00 are likely.
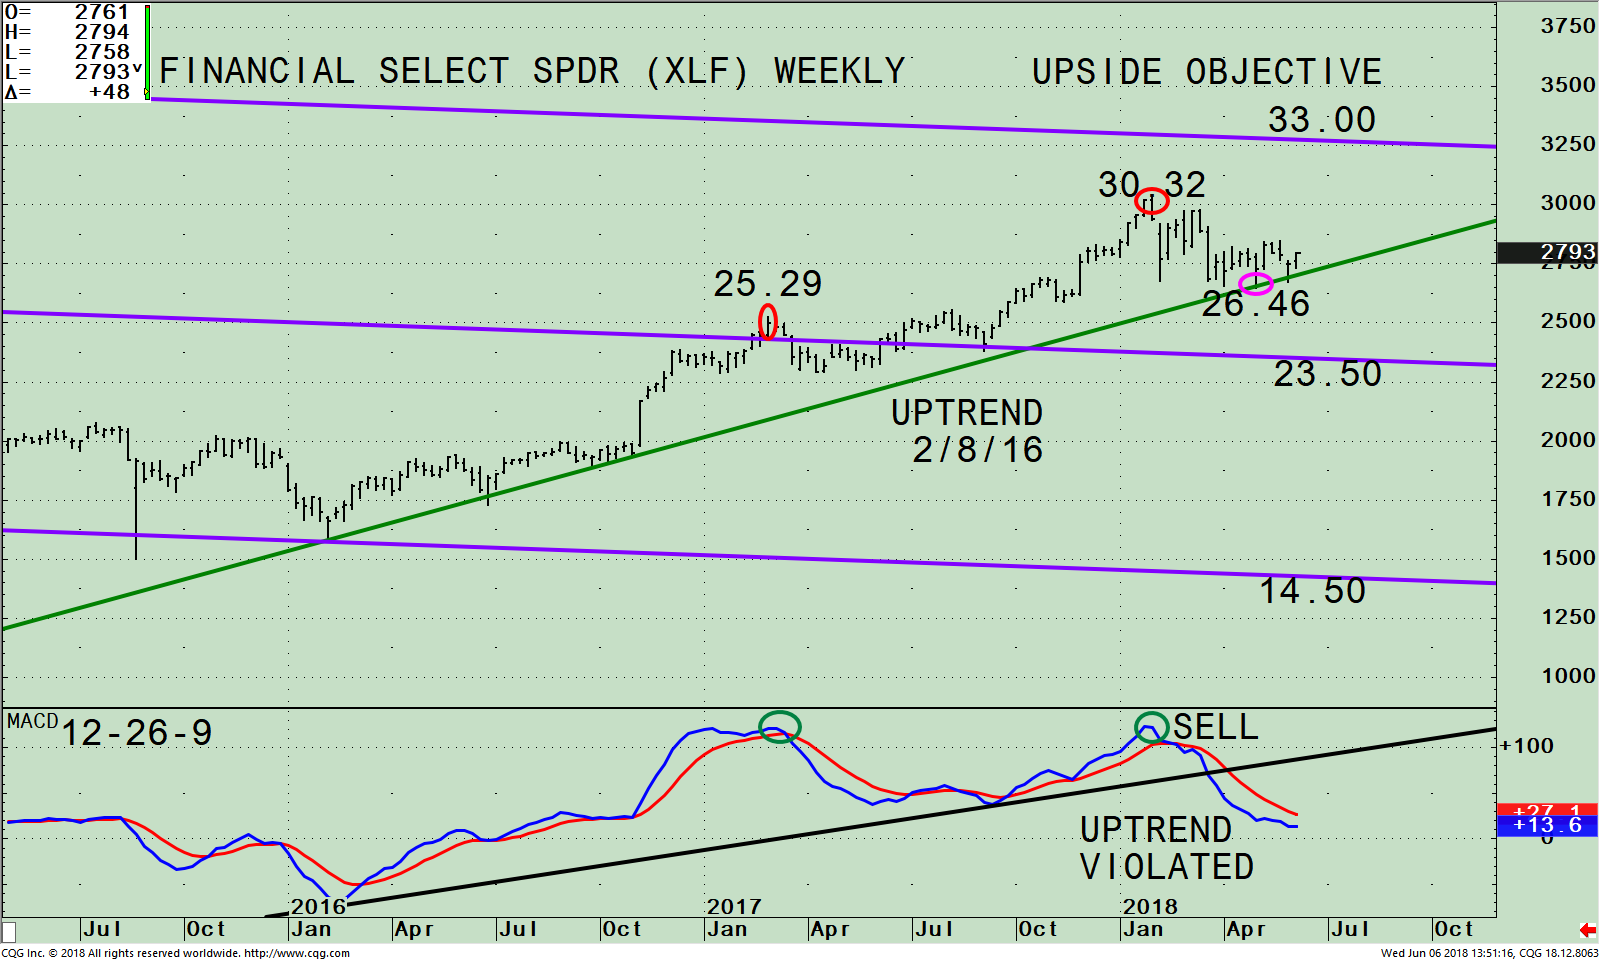
Figure: S&P Financial Select SPDR (XLF) Weekly Price (Top), and MACD 12-26-9 (Bottom)
The top part of the chart is the weekly Financial Select Sector SPDR (XLF), one of the ten SPDR ETFs. The Financial Sector SPDR (XLF) is an exchange traded-fund (ETF) that tracks a mix of diversified financial service firms, insurance, banks, capital markets, consumer finance and thrift companies. As of 06/5/18, its top 5 holdings are JP Morgan Chase & Co. (JPM), 11.19%, Berkshire Hathaway Inc. Class B (BRK/B) 11.07%, Bank of America Corporation (BAC) 8.46%, Wells Fargo & Company (WFC) 7.24% and Citigroup (C) 5.20%. The top holdings represent 43.16%. The top 2 sectors are banks and capital markets that account for 66.34% of the Financial (XLF) index.
The top portion shows the weekly SPDR S&P Financial Select SPDR ETF (XLF) active trading channel (purple) and its uptrend (green) that began in early 2016, still intact. The XLF closed at 27.45 above the 5/3 low at 26.46, an important level to hold. A weekly close in XLF below 26.46 would shift the intermediate trend in XLF from up to down. The next level of support is the mid-channel at 23.50. A break below 23.50 would imply more weakness ahead.
Historically, it’s a sign of a healthy market when financial stocks are strong, showing signs there is economic growth. The Financial Select Sector SPDR (XLF) is normally less volatile than KRE even though the portfolio is more concentrated in their top holdings. However, XLF over the next several weeks could be more volatile and weaker given the fact that JP Morgan Chase & Co. (JPM) and Berkshire Hathaway Inc. Class (BRK/B) have broken their weekly price uptrend. JPM broke its weekly price uptrend in April and BRK/B broke it weekly price uptrend in May. (charts not shown). Both stocks have weakening momentum patterns based on MACD falling, no signs of strength. The XLF is likely to lag KRE unless JPM and BRK/B start to rise.
The bottom half of the chart is MACD (12, 26, 9) a technical indicator that measures momentum. MACD remains on a sell and is pointing down. The uptrend from January 2016 is no longer in effect. More time is needed for MACD to be oversold, below 0, and a favorable buying pattern to develop.
Summing Up:
Rising interest rates are normally not healthy for the stock market, but do help profits of the stocks in the financial sector. The price uptrend in KRE and XLF remains in effect for now. However, momentum is weakening and bears watching. If the KRE breaks below 58.00 on a weekly close and the XLF closes below 26.46, I suggest you reduce your exposure as the intermediate trend would shift from up to down, making it harder to make money. If the uptrends in price are broken, a more serious decline could occur for financials, and the broad market as well.
Drop me a line! I’d love to hear from you. Please call me at 516-829-6444 or email at bgortler@signalert.com to share your thoughts or ask me any questions you might have.
Sign up for a FREE 3 issue trial of
SYSTEMS AND FORECASTS Click HERE
******Article published in Systems and Forecasts by Bonnie Gortler June 6, 2018
Disclaimer: Although the information is made with a sincere effort for accuracy, it is not guaranteed that the information provided is a statement of fact. Nor can we guarantee the results of following any of the recommendations made herein. Readers are encouraged to meet with their own advisors to consider the suitability of investments for their own particular situations and for determination of their own risk levels. Past performance does not guarantee any future results.


Create more wealth in your life
with these simple strategies.
As an added bonus you will also
receive BG’s Updates and Ezine

Discover how to quickly create more well-being in your life with these simple strategies.
As an added bonus you will also
receive BG’s Updates and Ezine

As an added bonus you will receive BG’s Updates and Ezine

All work listed on BonnieGortler.com is licensed under a Creative Commons Attribution - Noncommercial - No Derivative Works 3.0 Unported License.


Free Report:
Grow and Sustain Your Wealth
Discover how to grow your money with these easy, simple steps.

