

10 Simple Tips for Financial Well-Being
07/01/2026
The S&P 500 had its worst January-April performance since 2009. The major averages have been consolidating in a trading range for several weeks. However, after testing support several times, the Dow and S&P 500 has rallied to their best closing levels in nearly two months. In May, the Russell 2000 (IWM) made a new all-time high. All positive signs for the future. Much of the talk on the news and social media has been about small caps making a new all-time high. I believe the mid cap strength is significant too. It’s a bullish sign that mid-caps have come back to life and are now stronger in relative strength compared to the S&P 500 in the intermediate term. The Midcap 400 (MDY) has recently broken out of a consolidation pattern suggesting further gains are ahead.
The recent leadership in small and mid-caps suggests a new leg up is in progress and they could be significant.
Where do we go from here?
Figure: The SPDR S&P Mid Cap 400 (MDY) DAILY
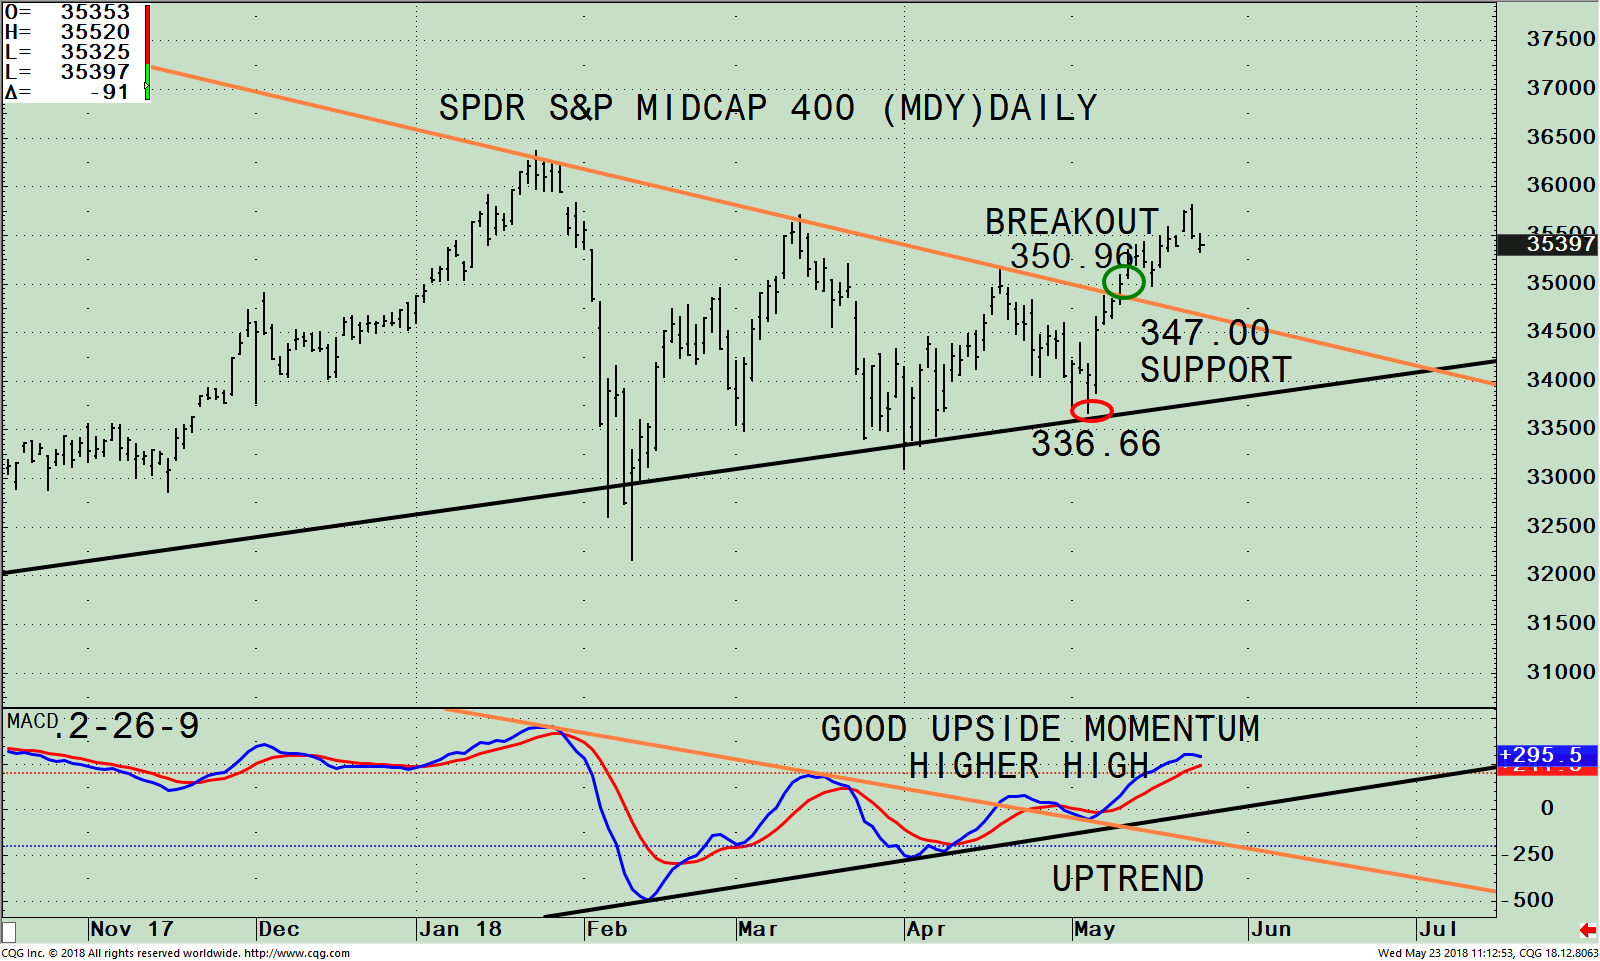
The chart above is the Daily SPDR S&P MidCap 400 Index (MDY) Trust ETF that tracks a market-cap weighted index of mid cap U.S. companies, made up of 400 stocks in a broad mix of major industry groups without either a growth or value bias. As of 5/21/18, the top 5 sectors in the S&P MidCap 400 Index are Financials 25.02%, Industrials 18.81%, Technology 13.94%, Consumer Cyclicals 12.10% and Healthcare 7.82%.
The top part of the chart shows the MDY broke its downtrend from 1/24/18 on May 19 at 350.96, where the MDY breakout occurred. Most times after a breakout, a retracement happens. Any short-term weakness is likely to be contained and would be a buying opportunity. An ideal buy area if the MDY does pull back would be at 347.00, a likely area of support.
The bottom half of the chart shows MACD, a measure of momentum. MACD has had good upside momentum and has made a new high, confirming the high in the MDY. This is bullish.
Figure:The SPDR S&P MidCap 400 (MDY) Weekly and Upside Objective
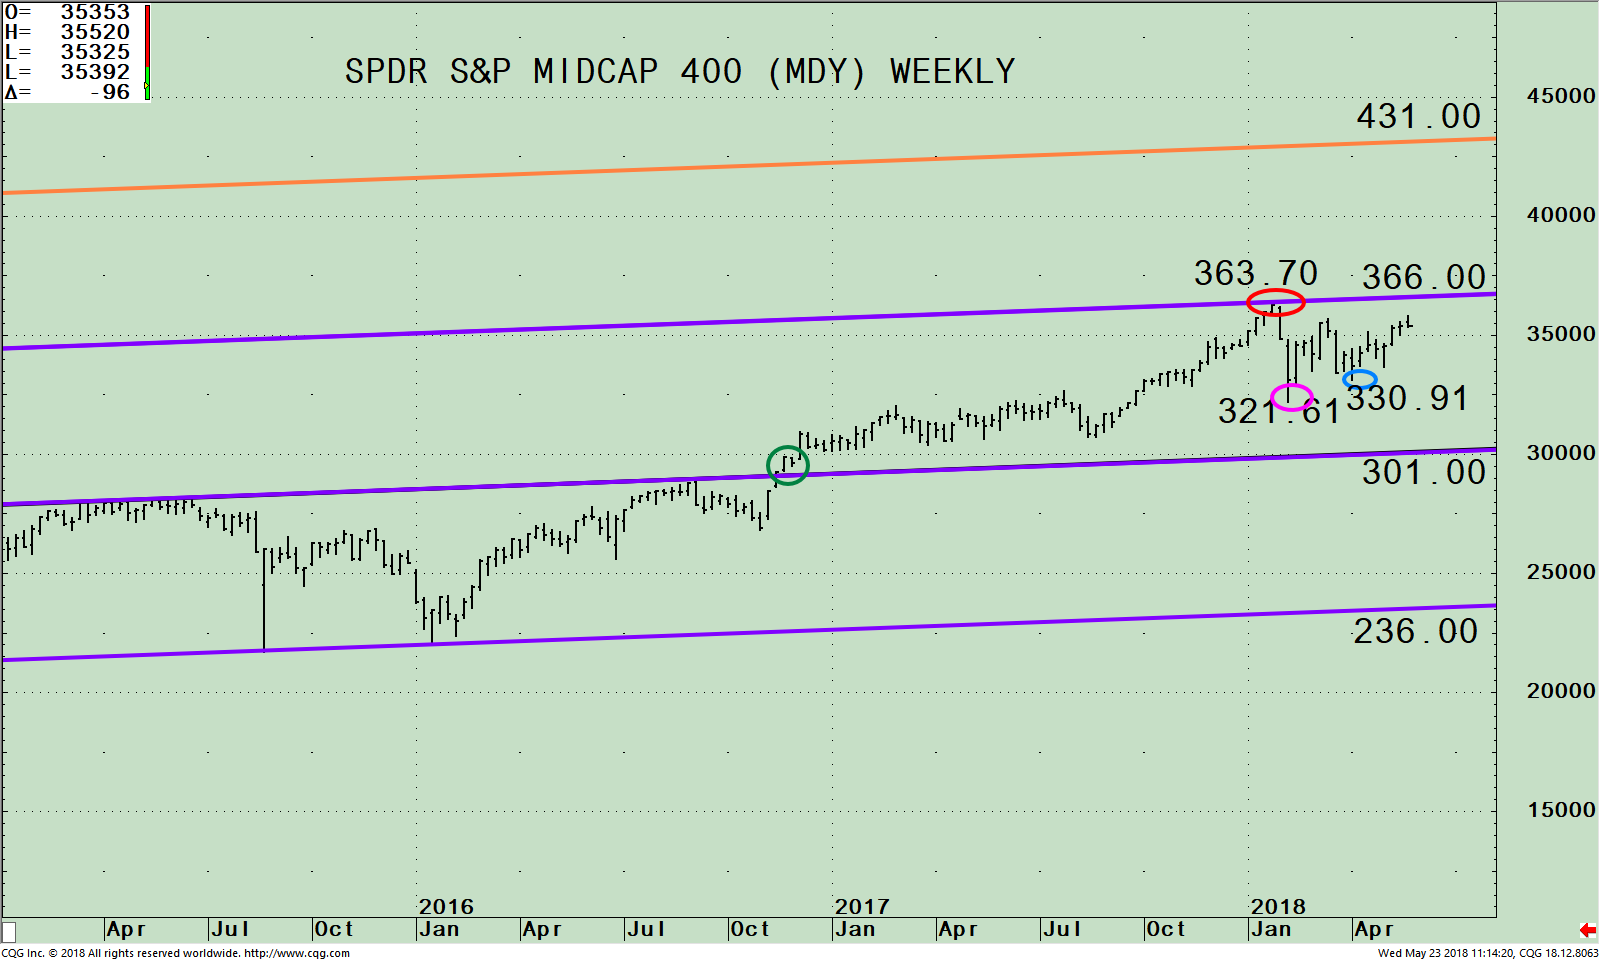
The chart above is the weekly SPDR S&P MidCap 400 Index (MDY) ETF and it’s weekly (intermediate) price channel (purple lines). The upside potential channel objective is 431.00 (orange line).
The MDY has been trading above the middle-channel since November 2016 (green circle). In late January 2018, the MDY reached its channel objective making a high at 363.70. The MDY fell 11.67%, finding a bottom at 321.61 on 2/5. The MDY stayed within a trading range making a low on April 2 at 330.91, successfully testing the February low. The MDY has been gaining strength since. The MDY is now not far from its all-time high of 363.70. If the MDY could make a new high and get through its upper channel at 366.00 an upside objective to 431.00 is possible.
Figure:Weekly SPDR S&P Mid Cap 400 (MDY)/ (SPY) S&P 500 Index Ratio (Top) 12-26-9 MACD of MDY/SPY Ratio (Bottom)
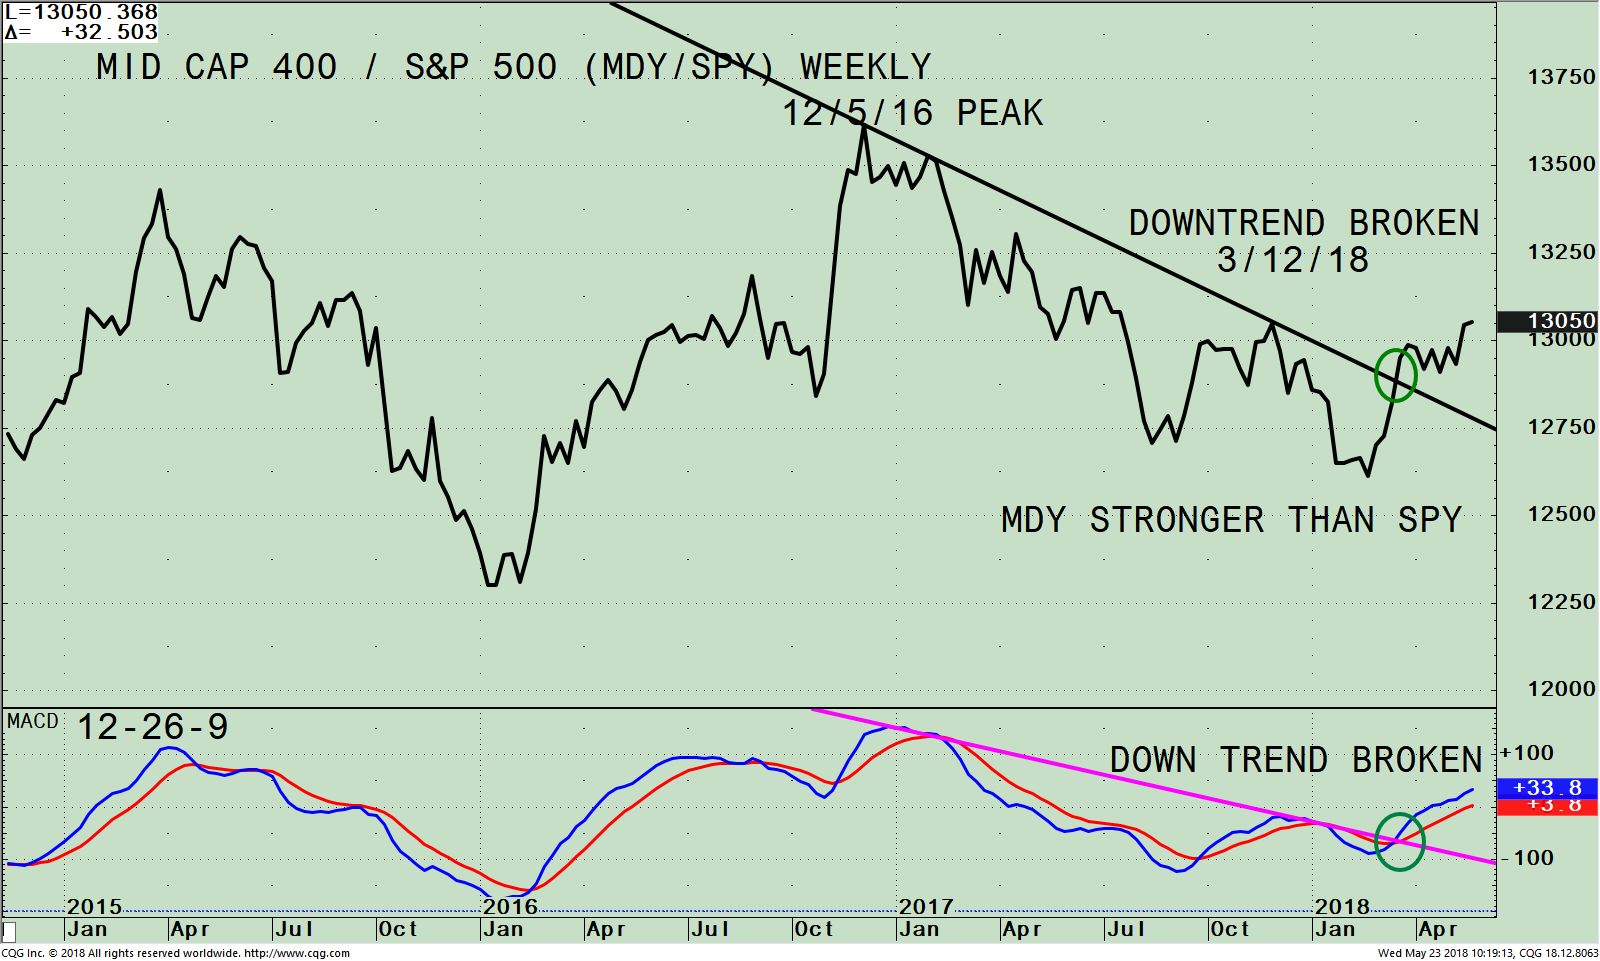
The top part of the chart is the weekly SPDR S&P Mid Cap 400 (MDY)/ (SPY) S&P 500 Index Ratio (MDY/SPY). A rising line means the MDY is stronger, and if falling, the SPY is stronger. The MDY/SPY ratio peaked on 12/5/16. MDY has clearly been gaining strength in 2018 and is at its highest level of the year. It’s bullish the MDY/SPY ratio is rising and has broken the downtrend from December 2016 (black line).
The lower portion of the chart is MACD of MDY/ SPY, now on a buy suggesting a change of leadership going forward. Not only is momentum improving, but at the same time, the MDY/SPY relative strength ratio has broken its uptrend.
Summing Up:
This bodes well for the broad market. The MDY is close to its all-time high of 363.70. If the MDY could make a new high and get through its upper channel at 366.00, an upside objective to 431.00 is possible. If you are heavily weighted in a sector in your portfolio that is lagging, now may be a good time to reduce your exposure and shift part of your assets to the MDY.
Drop me a line! I’d love to hear from you. Please call me at 516-829-6444 or email at bgortler@signalert.com to share your thoughts or ask me any questions you might have.
Sign up for a FREE 3 issue trial of
SYSTEMS AND FORECASTS Click HERE
******Article published in Systems and Forecasts by Bonnie Gortler May 23, 2018
Disclaimer: Although the information is made with a sincere effort for accuracy, it is not guaranteed that the information provided is a statement of fact. Nor can we guarantee the results of following any of the recommendations made herein. Readers are encouraged to meet with their own advisors to consider the suitability of investments for their own particular situations and for determination of their own risk levels. Past performance does not guarantee any future results.


Create more wealth in your life
with these simple strategies.
As an added bonus you will also
receive BG’s Updates and Ezine

Discover how to quickly create more well-being in your life with these simple strategies.
As an added bonus you will also
receive BG’s Updates and Ezine

As an added bonus you will receive BG’s Updates and Ezine

All work listed on BonnieGortler.com is licensed under a Creative Commons Attribution - Noncommercial - No Derivative Works 3.0 Unported License.


Free Report:
Grow and Sustain Your Wealth
Discover how to grow your money with these easy, simple steps.

