

10 Simple Tips for Financial Well-Being
07/01/2026
March is historically strong for the stock market. However, this March is off to a bumpy start with strings of consecutive up and down days although no decisive trend. It’s positive that volatility has come down instead of rising over the past couple of weeks as measured by the Volatility Index (VIX), or fear gauge. It’s also positive that chart patterns of higher highs (mid-March vs. late February) and higher lows are in-tact. On the other hand, if the pattern changes to lower highs and lower lows, or if VIX closes over the previous high from 03/02/18 at 26.22, this could be warnings of upcoming weakness going forward for the major averages.
What ETF to Watch To Signal Further Gains or Trouble Ahead?
SPDR KBW Regional Banking ETF (KRE) Weekly Price and Trend Channels (Top), and MACD 12-26-9 (Bottom)
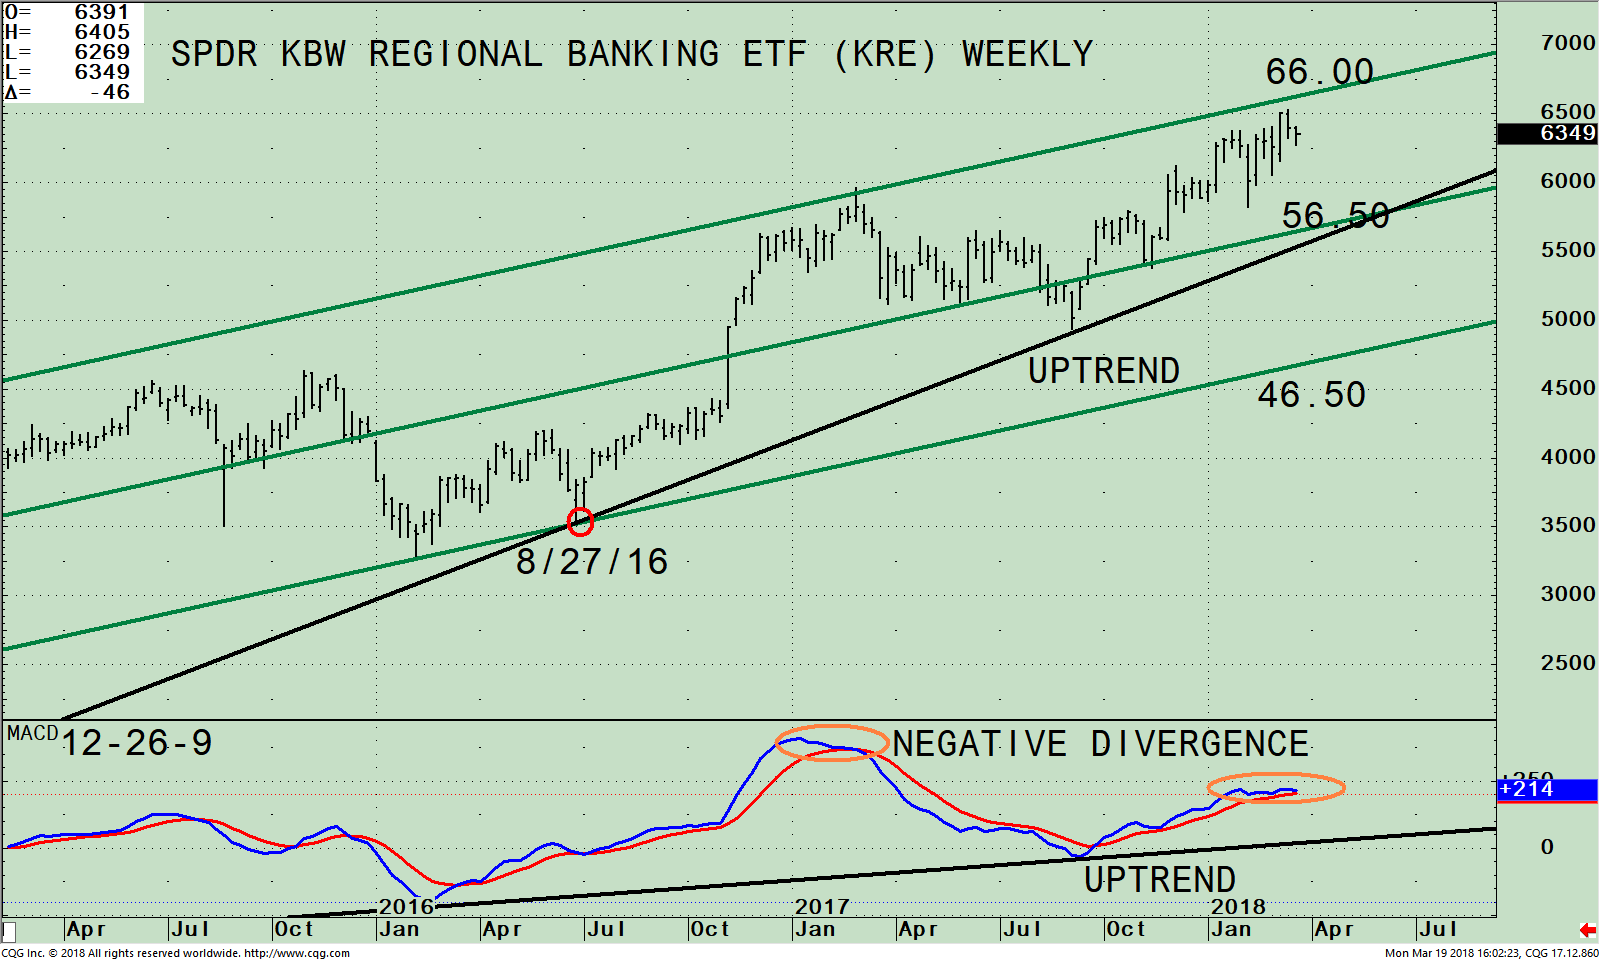
The top part of the chart shows the weekly SPDR KBW Regional Banking (KRE), an exchange-traded fund (ETF) that began in 2006. KRE tracks an equally weighted index of common stocks of leading regional banks or thrifts (savings and loan associations). As of 03/15/18, the top 10 holdings of KRE are Popular (BPOP) 2.61% Comerica (CMA) 2.55%, Regions Financial (RF) 2.53%, SVB Financial Group (SIVB) 2.50%, Signature Bank (SBNY) 2.49%, PNC Financial Services Group I (PNC) 2.5%, Fifth Third Bancorp (FITB) 2.45%, M&T Bank Corp. (MTB/WS) (2.44%), BB&T Corp. (BBT) 2.44%, and Sun Trust Banks (STI) 2.42%, totaling 24.93%.
If the decline continues and regional banks get weaker, key support is at 56.50. This area is key as it coincides with the middle channel and the uptrend from 08/27/16 (black line). A break below 56.50 would suggest even lower prices possible. A close above resistance at 66.00 for two days would suggest higher prices ahead and would have bullish implications for the overall market.
The lower portion of the chart is MACD (12, 26, 9), a technical indicator that measures momentum. Although MACD is above 0, momentum is waning which doesn’t bode well for KRE. A negative divergence has formed: The KRE has made a price high in March, 2018 compared to the last major peak in early 2017. However, this year MACD has been unable to confirm the high in January 2017 (orange circles). If KRE continues to lose momentum and break the uptrend, this would suggest financials could be in for a rocky road ahead and the next strong sector where investors target for profit taking.
S&P Financial Select SPDR ETF Weekly Price (Top), and MACD 12-26-9 (Bottom)
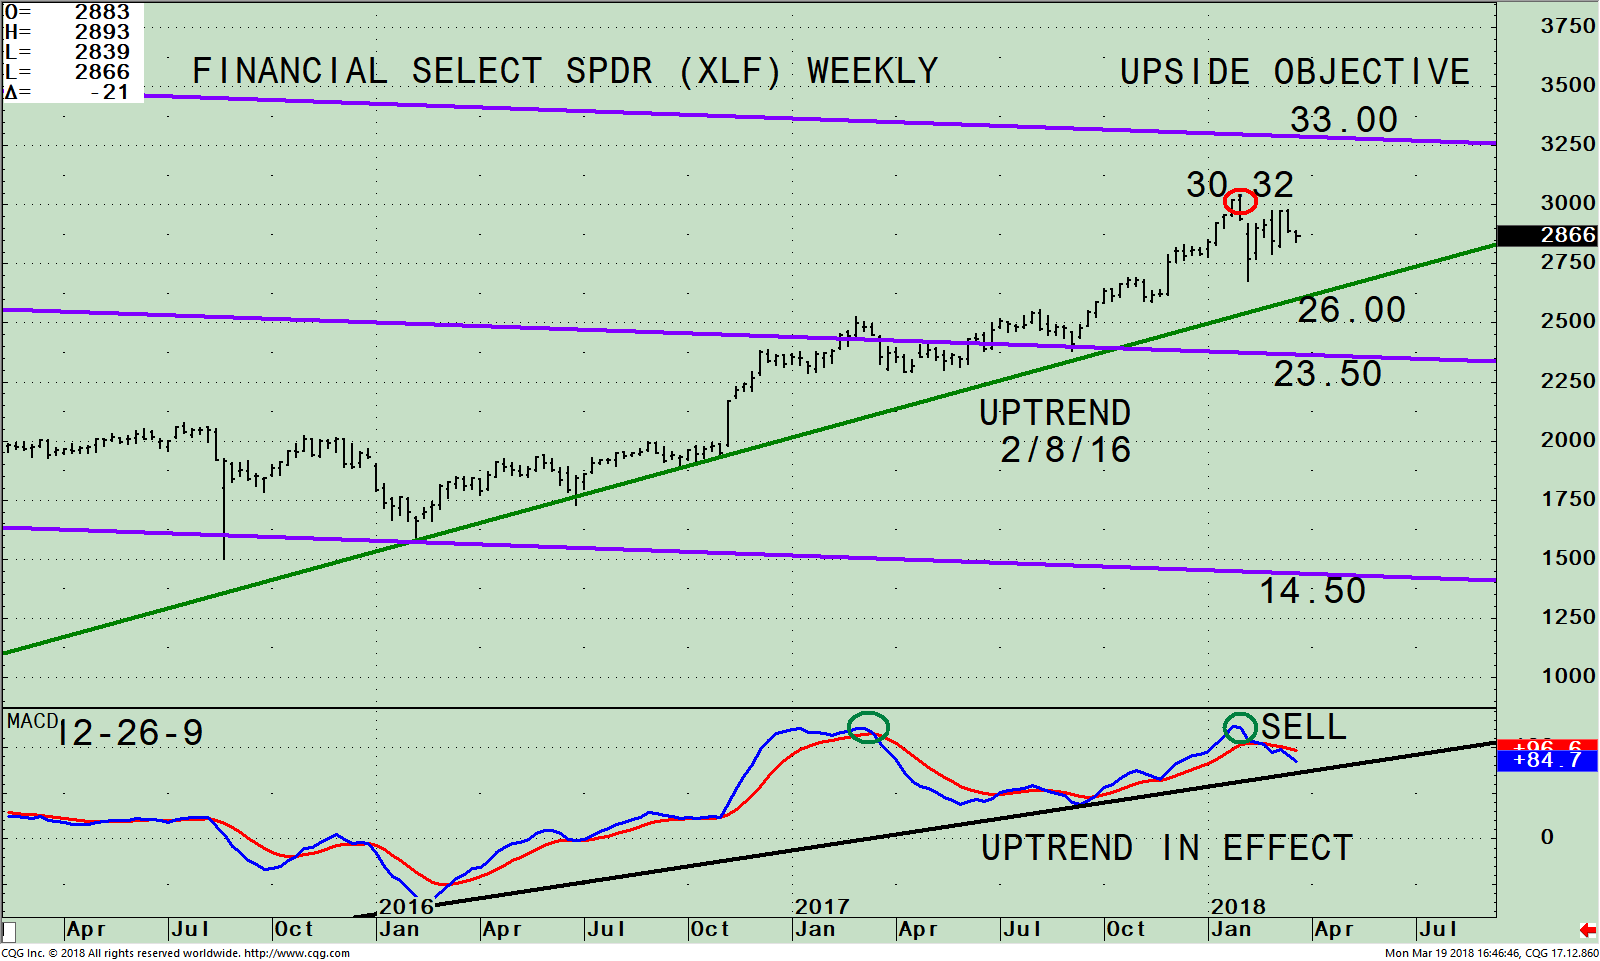
The Financial Select Sector SPDR (XLF) is one of the ten SPDR ETFs. The XLF includes companies from the following industries: diversified financial services; insurance; commercial banks; capital markets; real estate investment trusts; thrift & mortgage finance; consumer finance; and real estate management. As of 03/18/18, its top 5 holdings are JP Morgan Chase & Co. JPM, 11.44%, Berkshire Hathaway Inc. Class B (BRK/B) 11.37%, Bank of America Corporation (BAC) 8.91%, Wells Fargo & Company (WFC) 7.07% and Citigroup (C) 5.55%. The top holdings represent 44.34%. The top 2 sectors are banks and capital markets that account for 66.1% of the Financial (XLF) index. The Financial Select Sector SPDR (XLF) is less volatile than KRE even though the portfolio is more concentrated in their top holdings.
If either of the two top holdings JPM or BRK/B become out of favor by investors, this would put downside pressure on the XLF. Both stocks uptrends are in effect. However, their intermediate (weekly) MACD patterns are losing momentum like the XLF. This bears watching.
The top portion shows the weekly SPDR S&P Financial Select SPDR ETF (XLF) active trading channel (purple lines) and a trend line (green) that clearly shows the uptrend that began in early 2016 remains intact. When financials are strong, historically this is positive for the broad market. The XLF closed at 28.73 on 3/19/18, almost 15% profit potential to the upper channel objective at 33.00.
A break below the Feb 5 low at 26.76 would imply a test of the support at the middle channel at 26.00. If this area doesn’t hold, a further decline could potentially break the uptrend, shifting the intermediate trend from up to down.
The bottom half of the chart is MACD (12, 26, 9) a technical indicator that measures momentum. MACD is on sell. However, I am not as worried about this MACD sell because unlike the case with KRE, it was not accompanied by a negative divergence from the highs in January 2017. MACD did make a new peak (green circles) to confirm the price high. It’s also positive the uptrend in the MACD indicator remains intact.
Summing Up:
Rising interest rates are normally not healthy for the stock market. However, rates rising help the profits of stocks in the financial sector. The uptrend both in price and MACD for both the Regional Banks (KRE) and the Financials (XLF) remain in effect. I continue to give the benefit of the doubt to the bulls. If the uptrends are broken this would suggest a more serious decline could materialize where the bears will come out of hiding and be in control not only for financials but the broad market as well.
I would love to hear from you. Please call me at 516-829-6444 or email at bgortler@signalert.com to share your thoughts or ask me any questions you might have.
Sign up for a FREE 3 issue trial of SYSTEMS AND FORECASTS Click HERE
******Article published by Bonnie Gortler in Systems and Forecasts March 21, 2018
Disclaimer: Although the information is made with a sincere effort for accuracy, it is not guaranteed that the information provided is a statement of fact. Nor can we guarantee the results of following any of the recommendations made herein. Readers are encouraged to meet with their own advisors to consider the suitability of investments for their own particular situations and for determination of their own risk levels. Past performance does not guarantee any future results.


Create more wealth in your life
with these simple strategies.
As an added bonus you will also
receive BG’s Updates and Ezine

Discover how to quickly create more well-being in your life with these simple strategies.
As an added bonus you will also
receive BG’s Updates and Ezine

As an added bonus you will receive BG’s Updates and Ezine

All work listed on BonnieGortler.com is licensed under a Creative Commons Attribution - Noncommercial - No Derivative Works 3.0 Unported License.


Free Report:
Grow and Sustain Your Wealth
Discover how to grow your money with these easy, simple steps.


Thank you for pointing this out. It’s all very complicated to understand when you’re not an expert.
Hi Katrine,
Thank you for stopping by my blog. I appreciate your thoughts. Feel free to ask me any questions you might have.
Warmest,
Bonnie