

10 Simple Tips for Financial Well-Being
07/01/2026
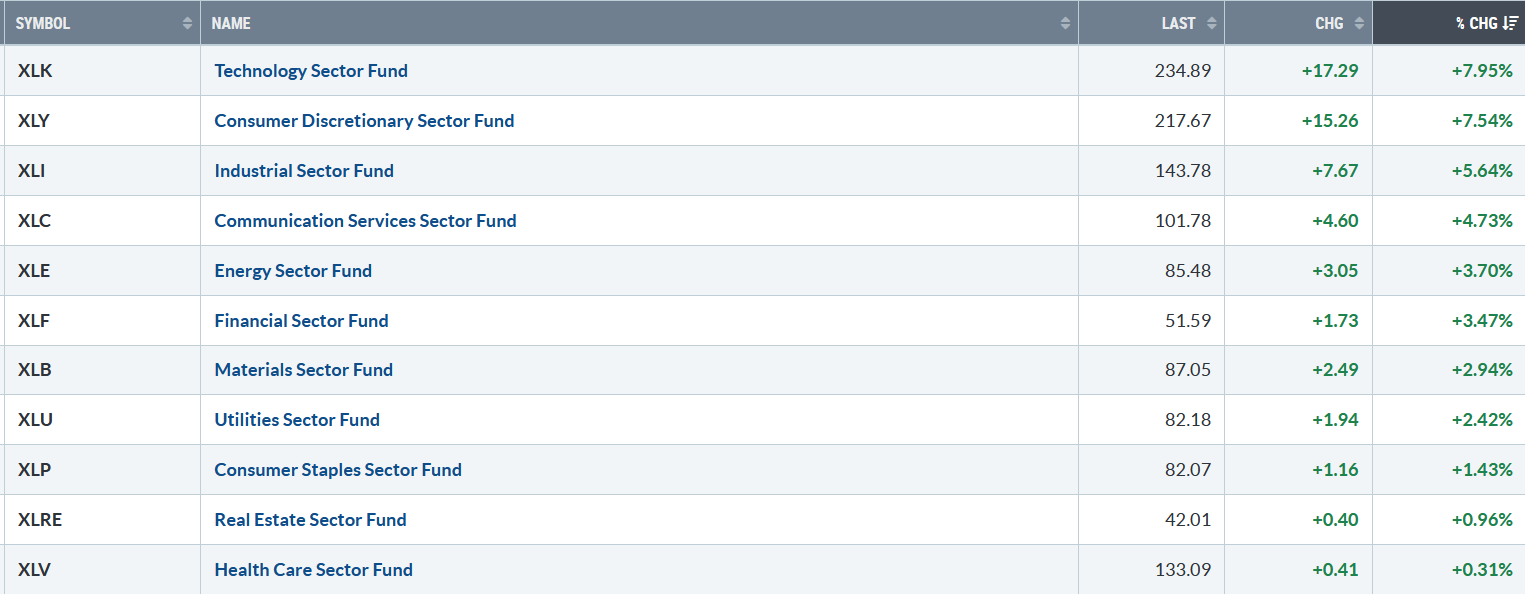
A broad explosive rally last week. All eleven S&P SPDR sectors were higher. Technology (XLK) and Consumer Discretionary (XLY) were the strongest sectors, while Real Estate (XLRE) and Healthcare (XLV) were the weakest sectors. The SPDR S&P 500 ETF Trust (SPY) rose +5.29%.
S&P SPDR Sector ETFs Performance Summary 5/9/25 – 5/16/25
051625 weekly SPDR Sectors
Source: Stockcharts.com
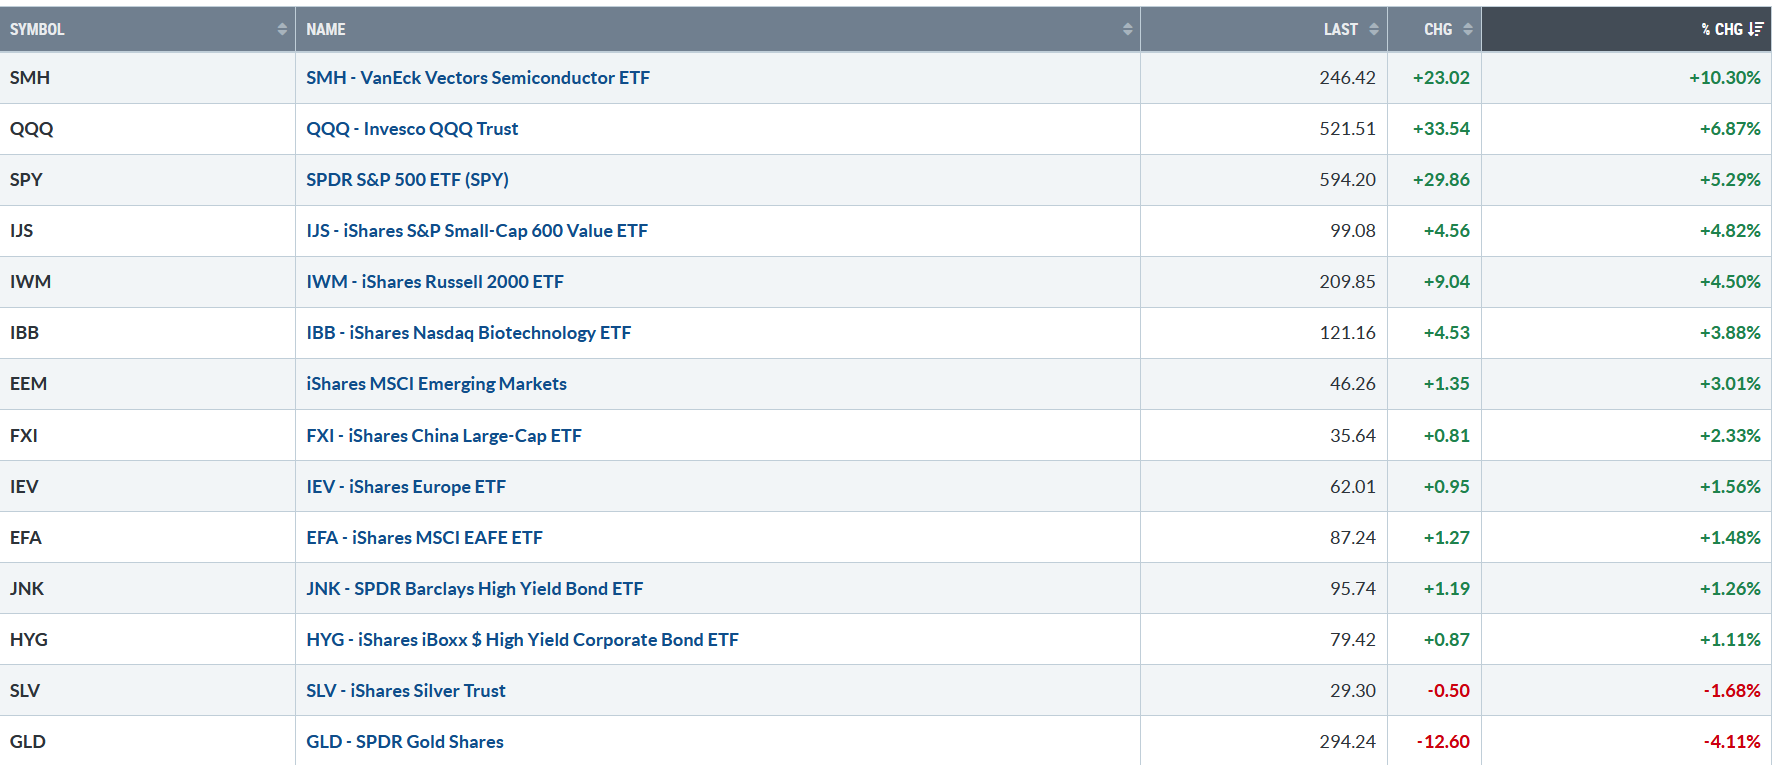
Figure 2: Bonnie’s ETFs Watch List Performance Summary 5/9/25 – 5/16/25
051625 Bonnie’s ETF Watch List
Source: Stockcharts.com
Semiconductors led, Technology outperformed the S&P 500, Small Cap Value, and Small Cap Growth had solid gains, while Gold and Silver were lower.
CHARTS CHARTS AND MORE CHARTS FOR YOU TO REVIEW. GO HERE.
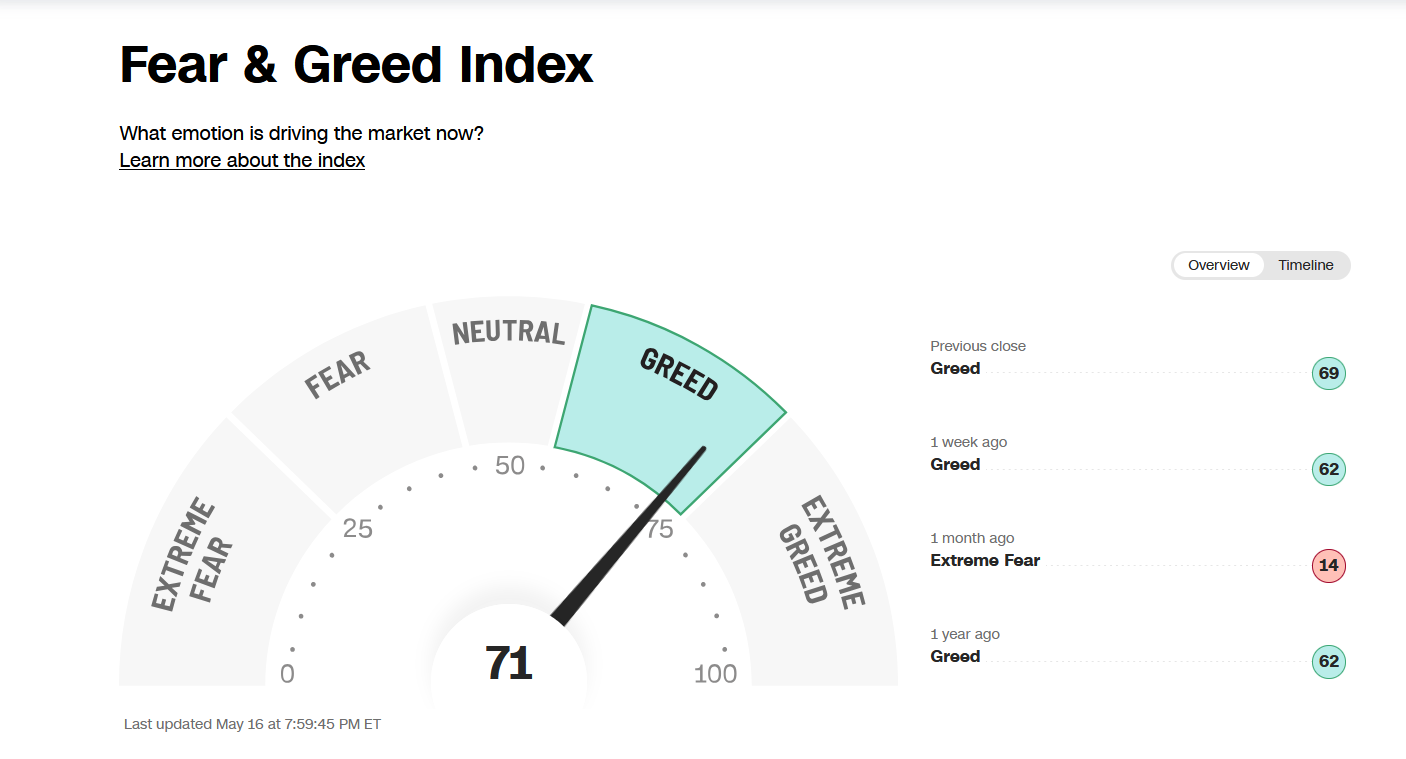
Figure 3: Fear & Greed Index
051625 CNN Fear and Greed
Source. CNN.com
Investor sentiment, measured by the Fear and Greed Index (a contrarian index), has upticked to 71 on the latest rally and is not yet showing extreme greed. Only one month ago, it showed extreme fear. Risk is increasing for a short-term pullback.
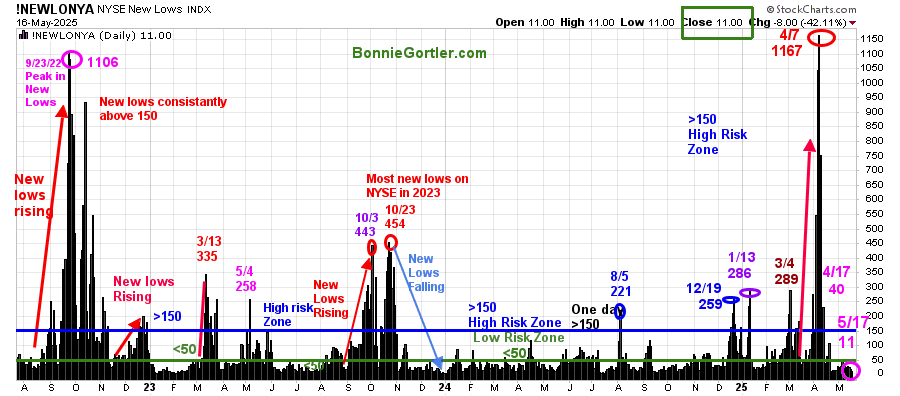
Figure 4: NYSE New Lows
051625 NYSE New Lows
Source: Stockcharts.com
New Lows peaked at 1167 on 4/7, surpassing the high made in September 2022, then contracted sharply.
New Lows closed at 11 last week, remaining in the lowest-risk zone. It would remain positive in the short term if New Lows stay below 50 and do not rise above 150. Learn more about the significance of New Lows in my book, Journey to Wealth, published on Amazon. If you would like a preview, get a free chapter here.
Figure 5: CBOE Volatility Index (VIX)
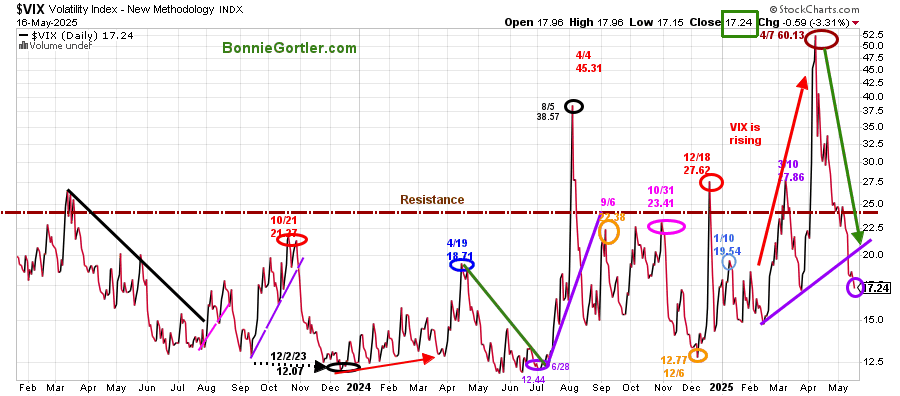
051625 VIX Daily
Source: Stockcharts.com
The CBOE Volatility Index (VIX), a measure of fear, continues to fall, closing at 17.24 (purple circle), which is positive. On the other hand, a close above 25.00 would imply that daily intraday volatility is likely to increase.
I invite you to join my Facebook Group. Learn more about it here: Wealth Through Market Charts.
Figure 6: Value Line Arithmetic Average Weekly (Top) and 12-26-9 MACD (Bottom)
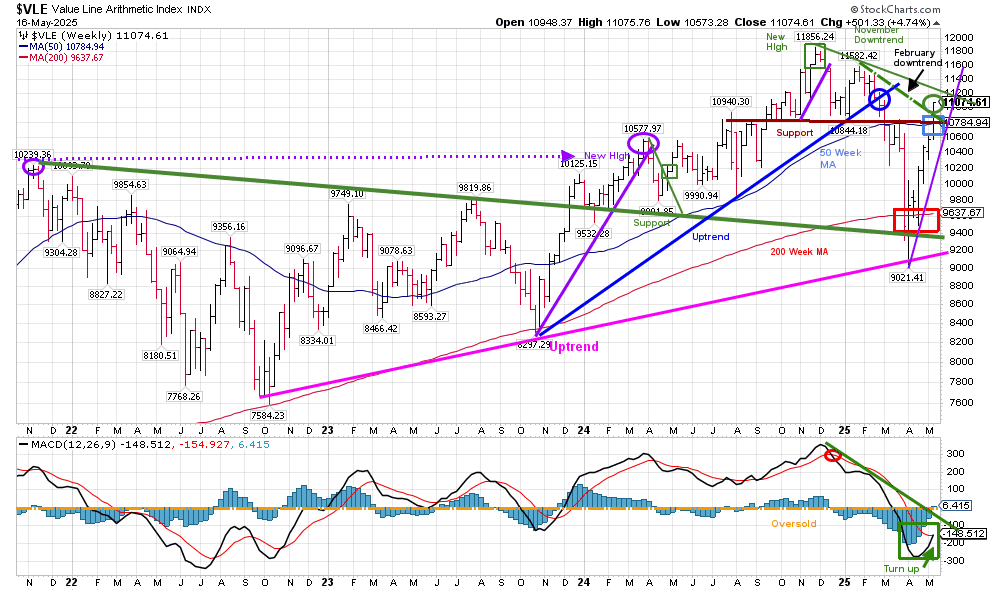
051625 VLE Weekly
Source: Stockcharts.com
The Value Line Arithmetic Index ($VLE) is a mix of approximately 1700 stocks.
The VLE uptrend from October 2023 (blue line) broke in late February and then fell to the October 2022 uptrend line (pink line), slightly penetrated before turning up sharply.
It is positive that last week, the downtrend from February broke (green circle), and is now threatening to break the November 2024 downtrend trendline. A weekly close above would imply VLE to test the old high at 11856.24. VLE closed above its 50-week MA (blue rectangle) and the 200-week MA (red rectangle), implying underlying strength.
Support is at 10800, followed by 10400. Resistance is 11300, followed by 11600.
You can explore Bonnie’s market charts from last week and more HERE.
Figure 7: S&P 500 Weekly (SPY) and 12-26-9 MACD (Bottom)
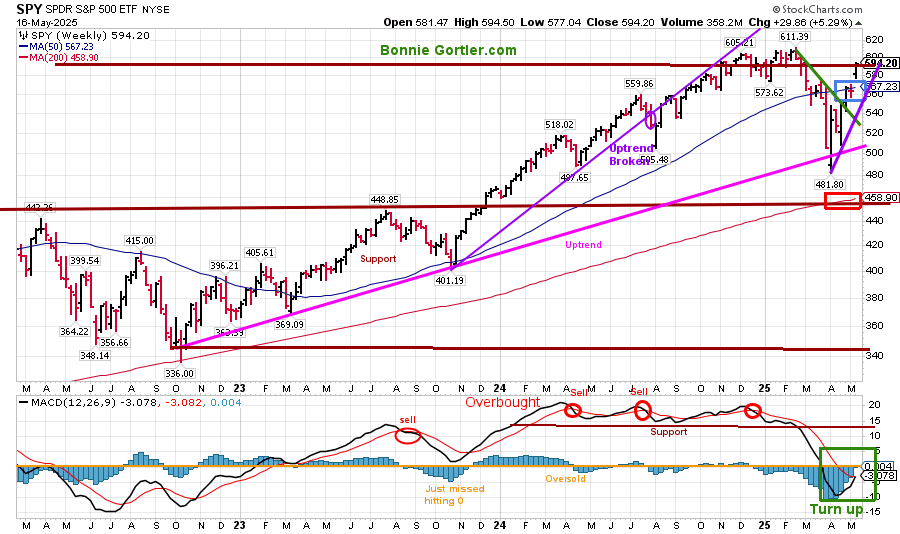
051625 SPY Weekly
Source: Stockcharts.com
The S&P 500 (SPY) intermediate trend is up.
SPY closed last week near its high, gaining 5.29% after breaking its February downtrend two weeks ago (green line).
MACD (bottom chart), a measure of momentum, has turned up from very oversold, and is close to generating a fresh buy signal.
As long as the uptrend from March remains in effect, the odds favor a new high in the S&P 500 and an upside projection to 700.00.
Learn how to implement a powerful wealth-building mindset and charting strategies to help you grow your wealth in the comfort of your home in my eCourse, Wealth Through Investing Made Simple. Learn more here.
Figure 8: S&P 500 Daily (SPY) Price (Top), 12-26-9 MACD (Middle), and Money Flow (Bottom)
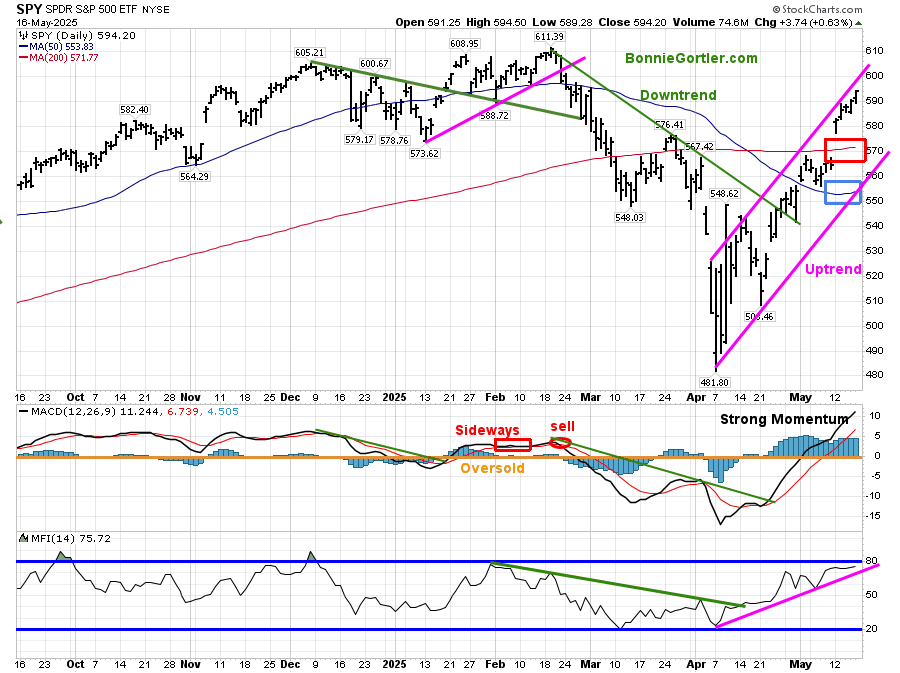
051625 SPY Daily
Source: Stockcharts.com
The S&P 500 (SPY) rose by 5.29% last week, continuing its uptrend, closing above the 50 and 200-day MA, implying underlying strength.
Resistance is 600 and 610.00. Support is 582.00, 570.00, and 550.00.
MACD (middle chart) remains on a buy, above 0, rising with strong momentum.
Any pullback in the SPY will likely stay contained, while the intermediate trend is an uptrend.
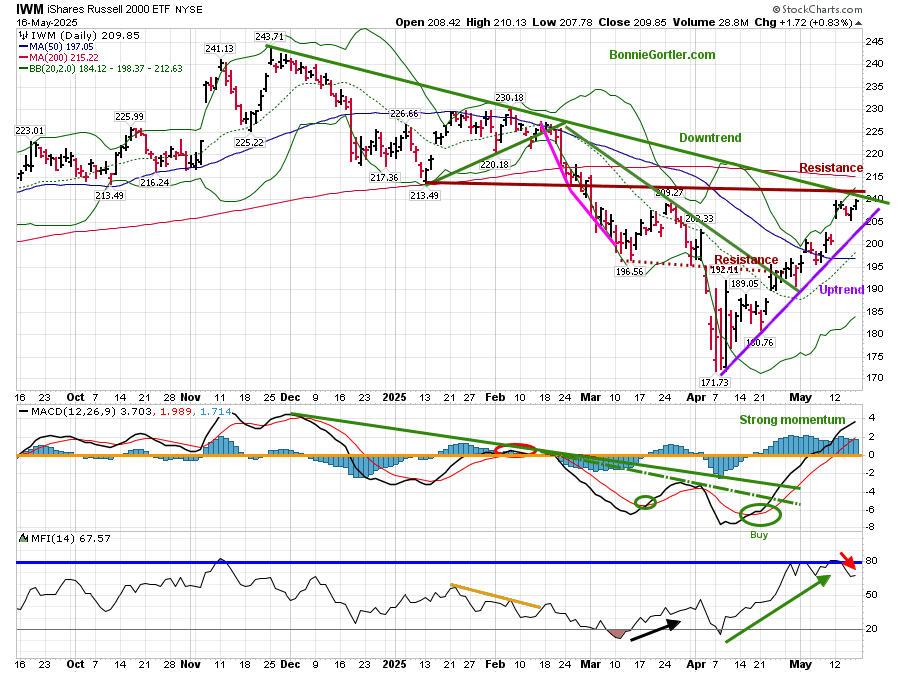
Figure 9: Daily iShares Russell 2000 (IWM) Price (Top),12-26-9 MACD (Middle), and Money Flow (Bottom)
051625 IWM Daily
Source: Stockcharts.com
The iShares Russell 2000 Index ETF (IWM) gained +4.50%. It would be bullish if IWM breaks the downtrend since November 2024 (green line). IWM closed above the 50-day (blue rectangle) but below the 200-day MA (red rectangle).
Resistance is 210.00, 215.00, and 225.00. Support is at 203.00, 200,00,197.00, and 185.00.
MACD (middle chart) remains on a buy, above 0, on strong momentum.
Money Flow (lower chart) reached 80, oversold, and turned down.
Higher prices are likely as long as the April uptrend (purple line) remains in effect.
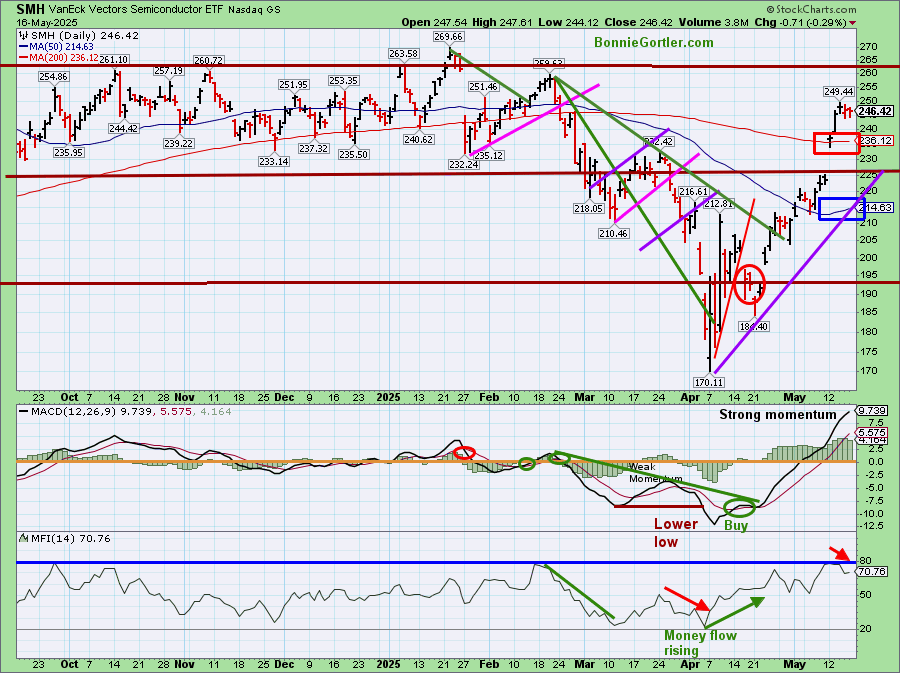
Figure 10: Daily Semiconductors (SMH) (Top), 12-26-9 MACD (Middle), and Money Flow (Bottom)
051625 SMH Daily
Source: Stockcharts.com
The top chart shows the Daily Semiconductors (SMH) ETF, concentrated mainly in US-based Mega-Cap Semiconductor companies. SMH tends to be a leading indicator for the market when investors are willing to take on increased risk, and the opposite is true when the market is falling.
SMH led the market higher, up +10.30% last week, closing above the 50 (blue rectangle) and 200-day MA (red rectangle), implying underlying strength.
Support is 236.00, 225.00, and 214.00. Resistance is at 249.00, 259.00, and 269.00.
MACD (middle chart) remains on a buy, above 0, on strong momentum.
Money Flow (lower chart) reached 80 (blue line), oversold, and turned down.
Semiconductors continuing to lead would be positive. On the other hand, if SMH begins to lag and underperform, it would be negative.
Sum Up:
The major averages and many stocks accelerated higher last week. Daily momentum patterns show strong momentum, and the intermediate-term patterns have turned up, implying more room to the upside. Some selling pressure could start the week after news of Moody’s downgrade of the U.S. sovereign credit rating. Technically, market breadth and recent strong momentum imply higher prices, and any pullback is a buying opportunity as long as the April daily uptrends remain in effect. Manage your risk, and your wealth will grow.
If you want to explore the charts further and get to know each other better, email me at Bonnie@BonnieGortler.com, or you can go directly to my calendar to schedule a time Here.
If you like this market update, you will love my free Charting Master Class. Learn more HERE.


Create more wealth in your life
with these simple strategies.
As an added bonus you will also
receive BG’s Updates and Ezine

Discover how to quickly create more well-being in your life with these simple strategies.
As an added bonus you will also
receive BG’s Updates and Ezine

As an added bonus you will receive BG’s Updates and Ezine

All work listed on BonnieGortler.com is licensed under a Creative Commons Attribution - Noncommercial - No Derivative Works 3.0 Unported License.


Free Report:
Grow and Sustain Your Wealth
Discover how to grow your money with these easy, simple steps.

