

10 Simple Tips for Financial Well-Being
07/01/2026
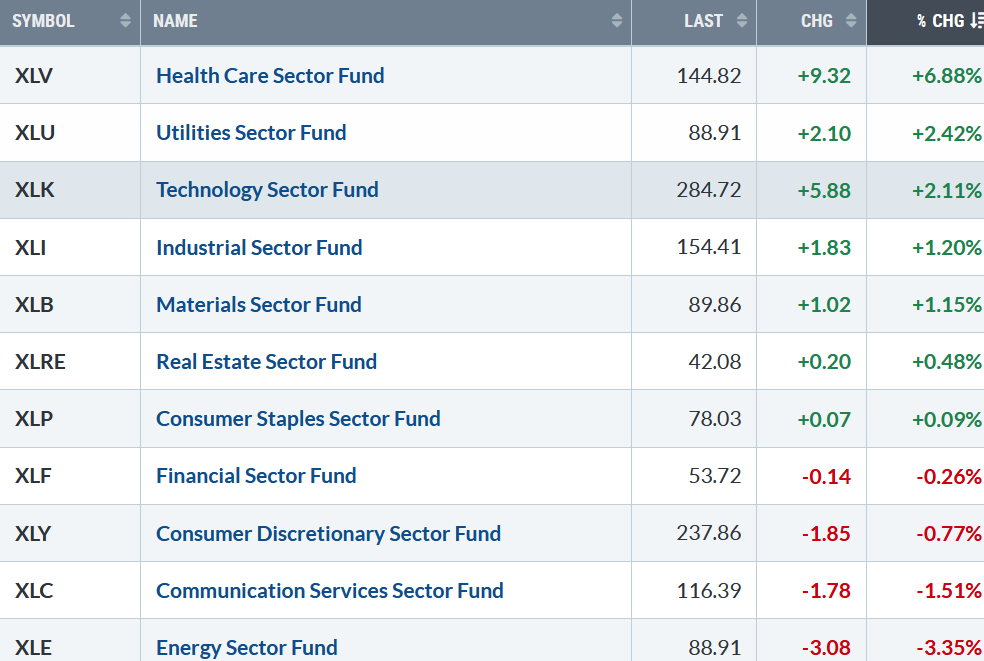
The rally continued. Dow, S&P 500, and Nasdaq were all higher last week. Seven of the eleven S&P SPDR sectors were higher. Healthcare (XLV) and Utilities (XLU) were the strongest sectors, while Communication Services (XLC) and Energy (XLE) were the weakest. The SPDR S&P 500 ETF Trust (SPY) rose +1.12%.
S&P SPDR Sector ETFs Performance Summary 9/26/25 – 10/3/25
100325 weekly SPDR Sectors
Source: Stockcharts.com
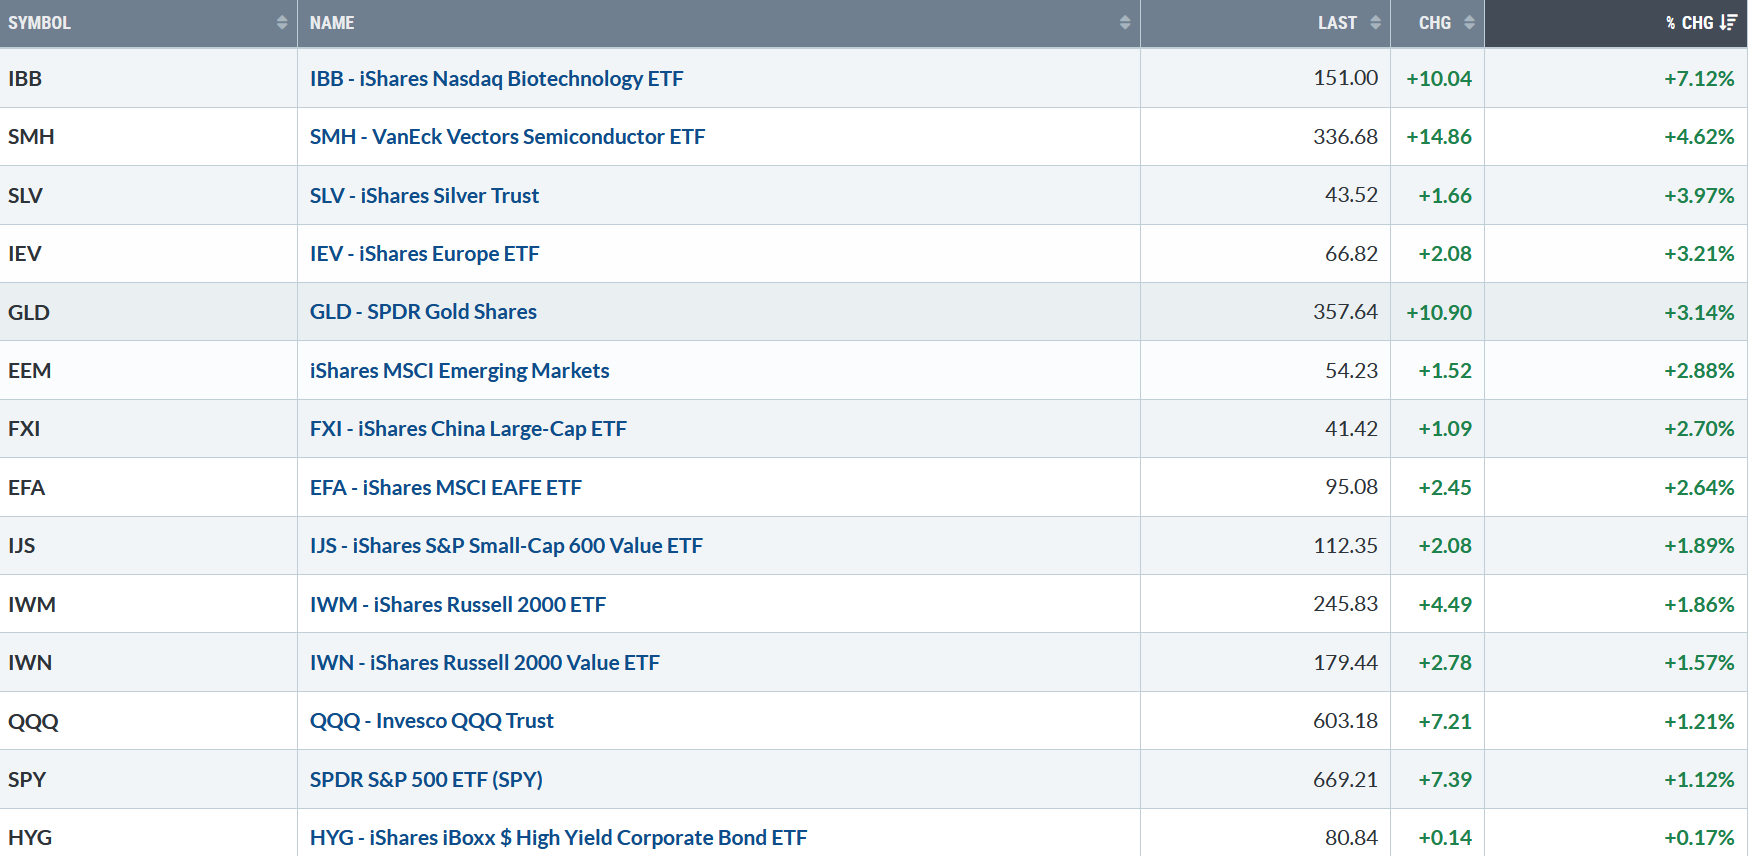
Figure 2: Bonnie’s ETFs Watch List Performance Summary 9/26/25 – 10/3/25
100325 Bonnie’s ETF Watch List
Source: Stockcharts.com
Biotechnology, Healthcare, Semiconductors, Silver, Gold, Small Cap Growth, and Small Value all led the market higher, outperforming the S&P 500 last week.
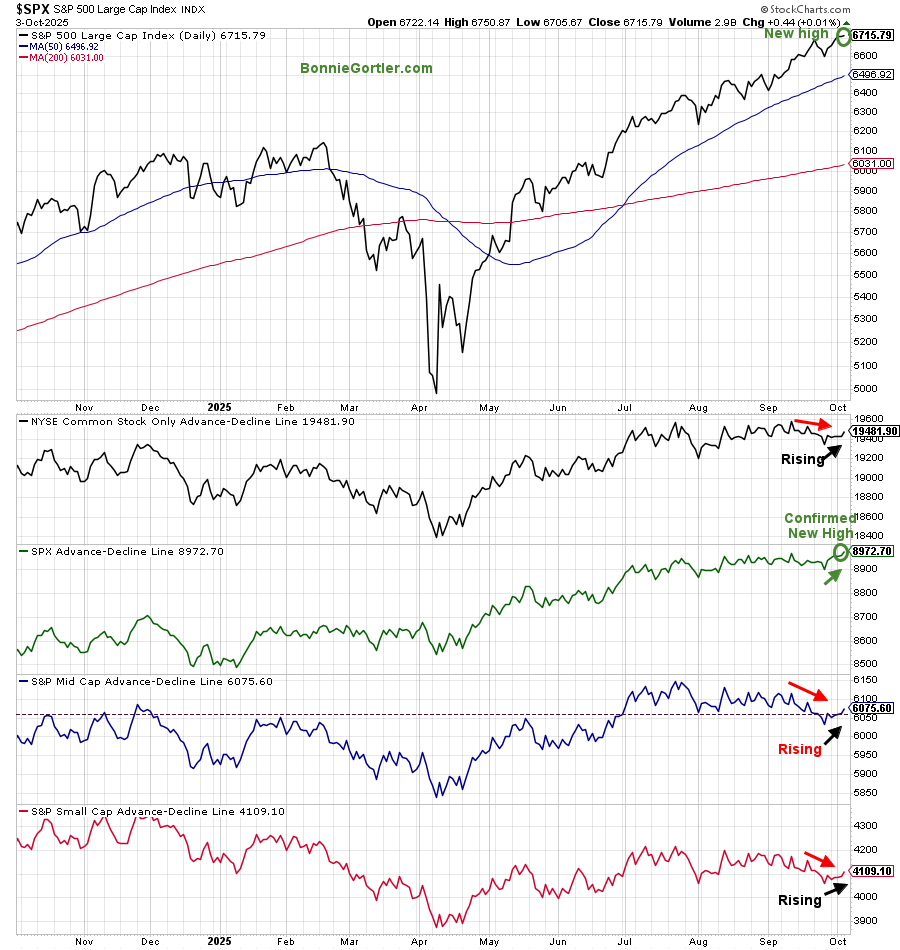
Figure 3: S&P 500 Price and NYSE, SPX, Mid and Small Cap Ad Lines
100325 S&P 500 Price and NYSE, SPX, Mid and Small Cap AD Lines
Source: Stockcharts.com
The S&P 500 reached a new high last week (top chart), confirmed by the S&P 500 advance-decline line (third chart). However, notice the minor divergence in breadth remains, with no confirmation (red arrows) in the New York Index (NYSE) Common Stock only, S&P Mid Cap, and S&P Small Cap Advance Decline Line. It’s positive that the AD lines are now rising. Time will tell if there will be confirmation. If there is no confirmation, the rally will narrow, and it will become harder to make money.
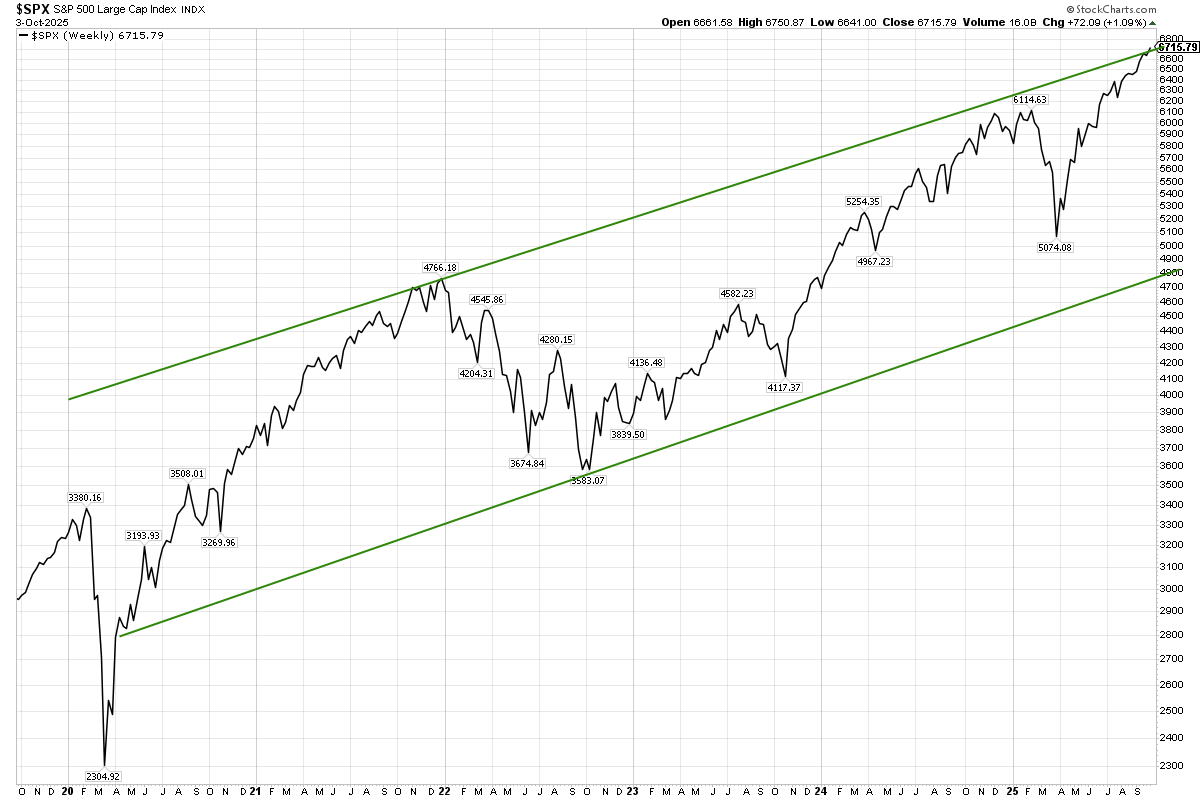
Figure 4: S&P 500 (SPX) Weekly
100325 SPX Weekly Channel
Source: Stockcharts.com
New highs in the S&P 500 continue. The pace of gain has slowed as the S&P 500 nears its 5-year weekly upper channel.
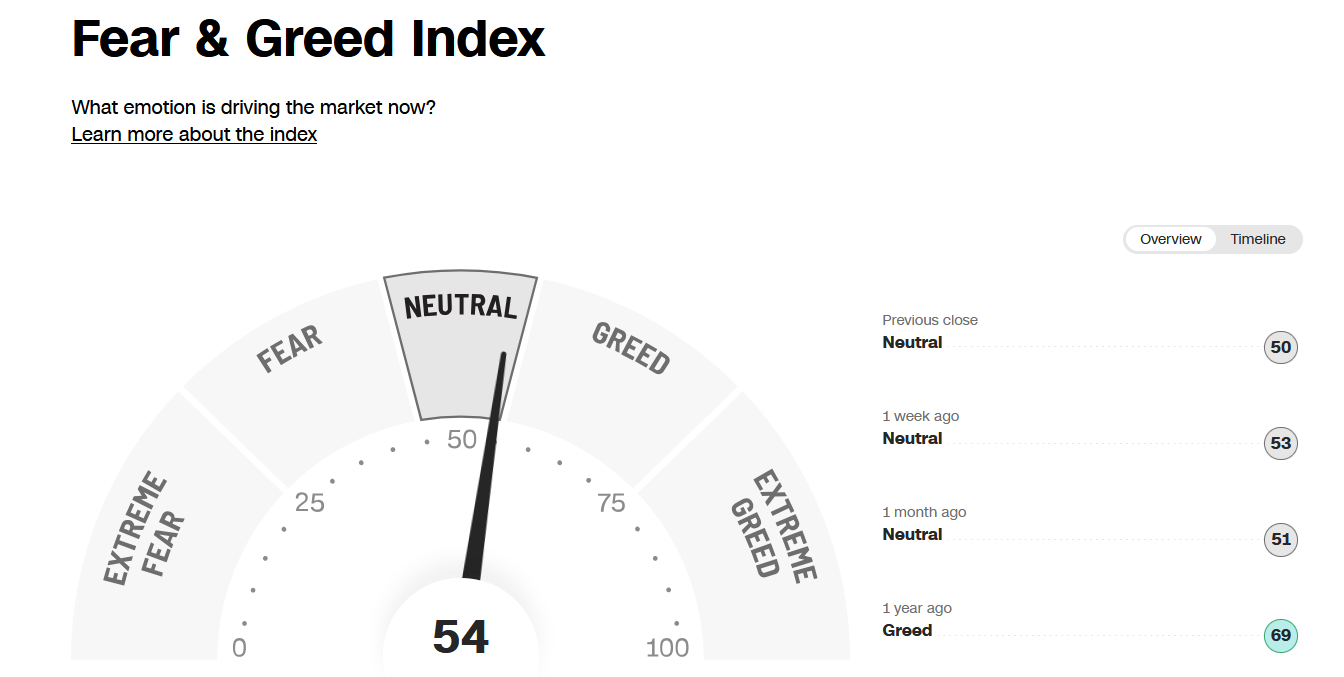
Figure 5: Fear & Greed Index
100325 CNN Fear and Greed Index
Source. CNN.com
Investor sentiment, as measured by the Fear and Greed Index (a contrarian indicator), rose slightly from 53 the previous week, closing at 54, staying at Neutral last week. If it reaches Extreme Greed, it would imply too much optimism, and the risk of a short-term pullback would increase.
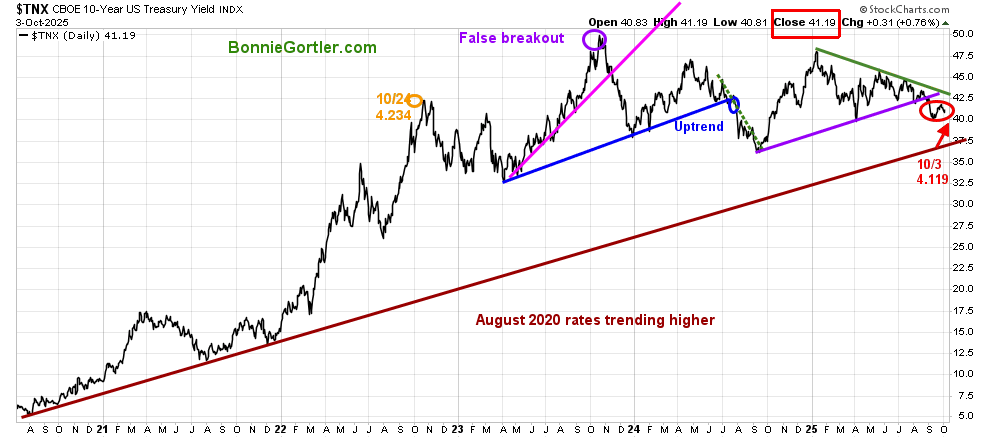
Figure 6: CBOE 10YR U.S. Treasury Yield Daily
100325 UST 10 YR Bond Yields Daily
Source: Stockcharts.com
The 10-year U.S. Treasury Yield fell, closing at 4.119%, supporting gains in U.S. equities. Lower yields breaking the long-term uptrend from August 2020 would be significant.
Learn how to implement a powerful wealth-building mindset and charting strategies to help you grow your wealth in the comfort of your home in my eCourse Wealth Through Investing Made Simple. Learn more here.
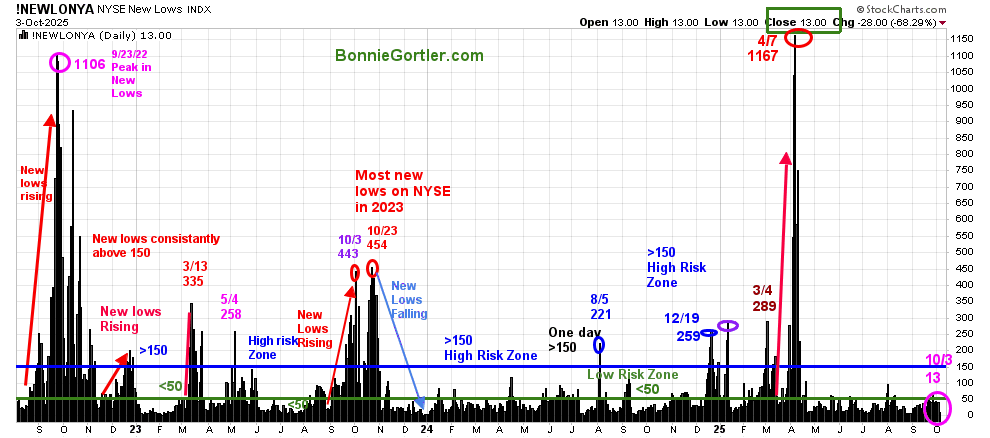
Figure 7: NYSE New Lows
100325 NYSE New Lows
Source: Stockcharts.com
New Lows On The NYSE peaked at 1167 on 4/7/25, then contracted sharply as the market bottomed in April.
New Lows declined to close Friday, 10/3, at 13, in the very low-risk zone, where prices tend to rise. It will remain positive in the short term if New Lows stay between 25 and 50. On the other hand, if new lows begin to increase and exceed 150, it would be short-term negative.
Learn more about the significance of New Lows in my book, Journey to Wealth, published on Amazon. For a chapter preview of Journey To Wealth, visit here.
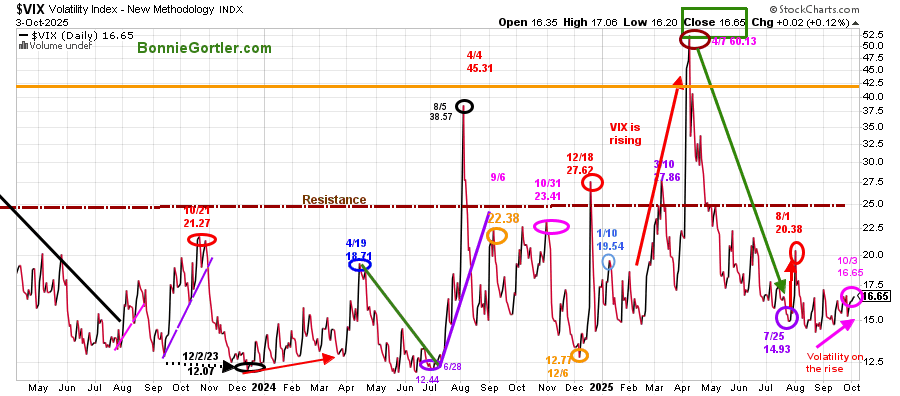
Figure 8: CBOE Volatility Index (VIX)
100325 VIX Daily
Source: Stockcharts.com
The CBOE Volatility Index (VIX), a measure of fear, peaked on April 7.
Vix rose for the sixth consecutive day, which bears watching. It’s unusual for VIX to increase as the major averages all rose, closing at 16.65. A reading above 20.38 (8/1 VIX reading) would be the first sign that intraday volatility is likely to increase and a warning signal of a potential correction. Above 25.00 would likely imply that the VIX will continue to rise and could jump between 32 and 40 quickly if there is any unexpected news.
Learn how to implement a powerful wealth-building mindset and charting strategies to help you grow your wealth in the comfort of your home in my eCourse Wealth Through Investing Made Simple. Learn more here.
The SPY Intermediate Trend Remains Up
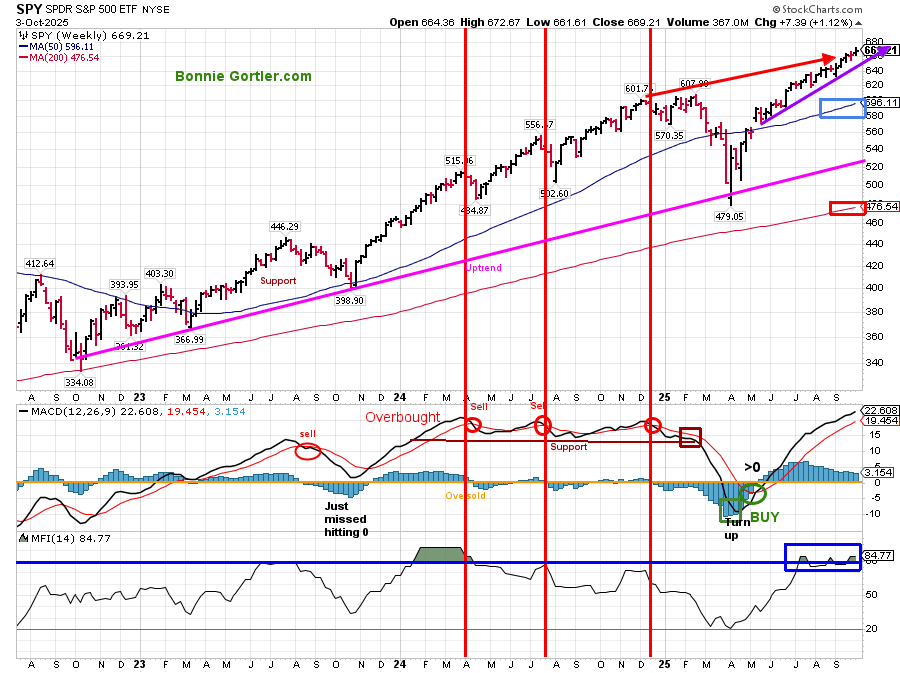
Figure 9: S&P 500 Weekly (SPY) and 12-26-9 MACD (Middle), and Money Flow (Bottom)
100325 SPY weekly
Source: Stockcharts.com
The S&P 500 (SPY) remains in an intermediate uptrend from October 2022. After hitting a low in April 2025, SPY consolidated its gains and then broke out of its channel, followed by SPY making new all-time highs.
The S&P 500 has continued to make new all-time highs since its low in April 2025. The largest Technology stocks account for more than 30% of the S&P 500. Nvidia, Apple (270 upside target), Alphabet, Microsoft, Amazon, and Meta. Due to the significant weighting, as these stocks perform over the next few weeks, the odds are that the S&P 500 will likely follow.
MACD (middle chart), a momentum indicator, is overbought above 0, and continues to rise.
The MFI Index hit 80 in July and remains overbought, indicating strength. There has not yet been any significant downturn, suggesting that money is not yet moving out of the S&P 500.
Summing Up:
After hitting the daily projection of 635.00, the SPY remains resilient, with only a minor retracement. The intermediate upside projection remains at 700.00. A weekly close below 654.00 would imply a pullback toward 633.00 and 622.00, and potentially lower levels. For now, the bulls continue to get the benefit of the doubt until proven otherwise.
I invite you to join my Charting Facebook Group. Learn more about it here: Wealth Through Market Charts.
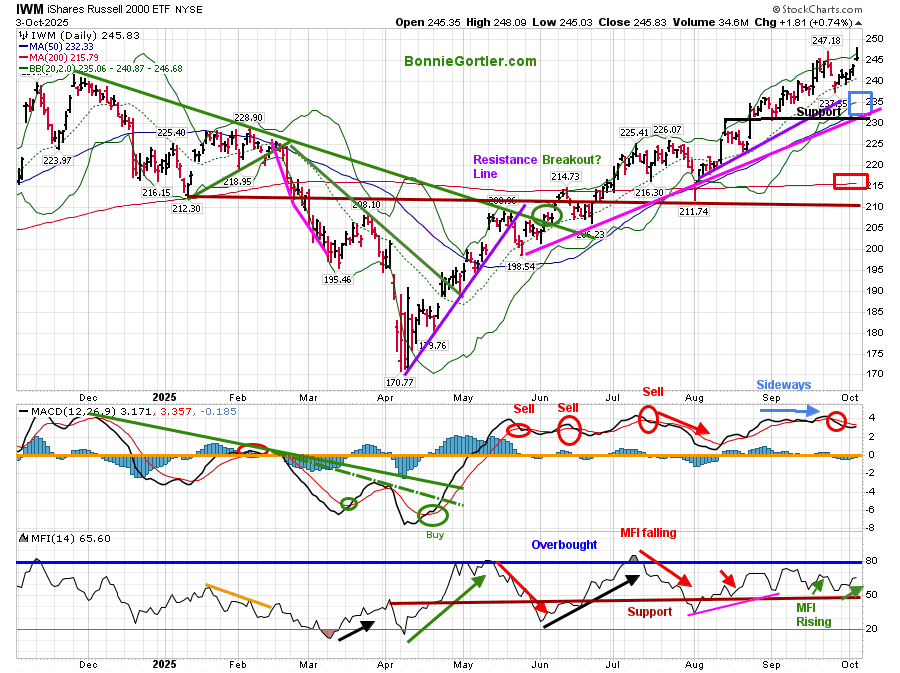
Figure 10: Daily iShares Russell 2000 (IWM) Price (Top),12-26-9 MACD (Middle), and Money Flow (Bottom)
100325 IWM Daily
Source: Stockcharts.com
The iShares Russell 2000 Index ETF (IWM), after reaching its first all-time closing high since November 2021, continues to rise, up +1.86% for the week.
IWM remains in a clear uptrend from August (purple line), and remains above both the 50-day moving average (blue rectangle) and the 200-day moving average (red rectangle).
Support is at 236.00, 232.00, 220.00, 214.00, and 210.00. Resistance is at 248.00.
The MACD (middle chart) remains on a sell signal, having just missed falling below 0 in August to generate a fresh buy signal. Momentum has weakened after moving sideways since August.
The Money Flow (lower chart) did not reach 80 in August, then turned down. MFI is rising now as small caps are back in favor, now in a seasonally strong period. Time will tell if the strength will continue.
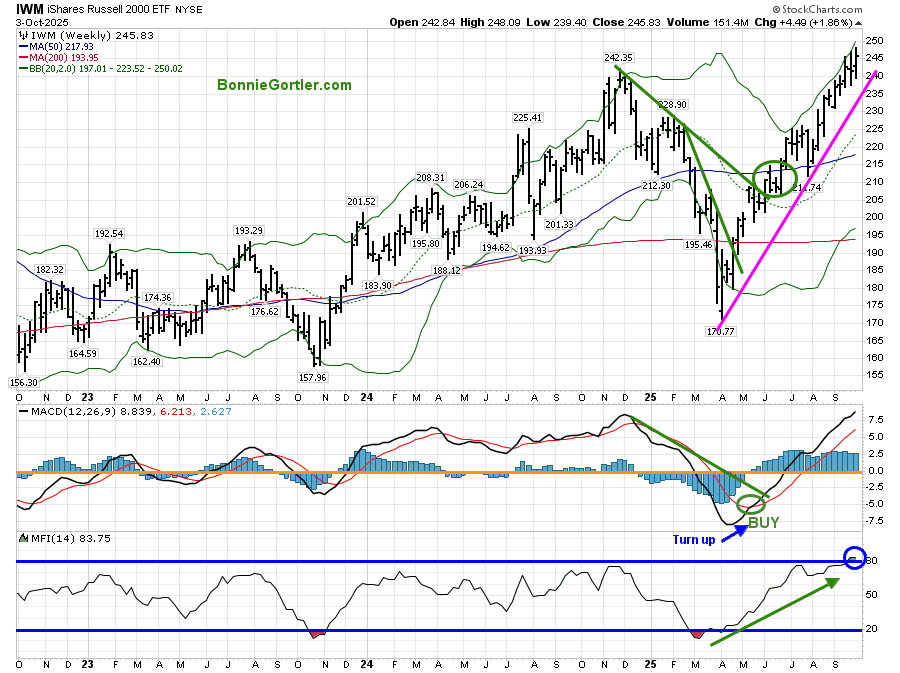
Figure 11: Weekly iShares Russell 2000 (IWM) Price (Top),12-26-9 MACD (Middle), and Money Flow (Bottom)
100325 IWM weekly
Source: Stockcharts.com
The Russell 2000 (IWM) remains in an intermediate uptrend. IWM continues to make higher lows and higher highs.
Support levels are at 236.00, 232.00, and 220.00.
In Sum:
As long as IWM closes for the week above 236.00, the bulls continue to get the benefit of the doubt.
In case you missed my interview with Ryan Redfern, brought to you by the National Association of Active Investment Managers (NAAIM), you can view it here.
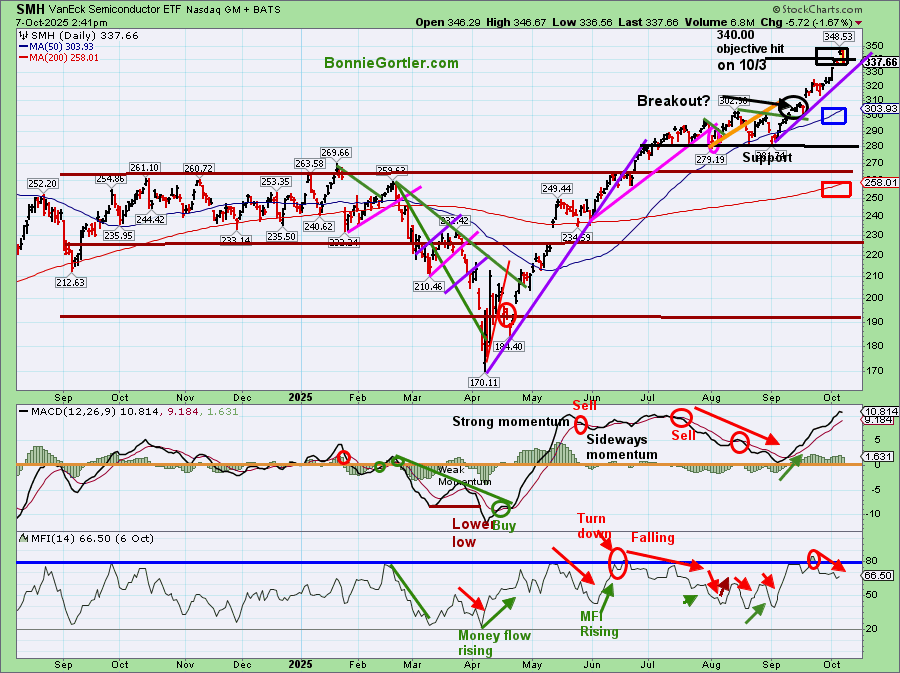
Figure 12: Daily Semiconductors (SMH) (Top), 12-26-9 MACD (Middle), and Money Flow (Bottom)
SMH 100725 Daily corrected
Source: Stockcharts.com
The top chart shows the Daily Semiconductor (SMH) ETF, which is concentrated mainly in US-based Mega-Cap Semiconductor companies. SMH can be highly volatile. SMH tends to be a leading indicator for the market when investors are willing to take on increased risk, and the opposite is true when the market is falling.
After a tight consolidation for several weeks, the SMH breakout occurred. On Friday, October 3, the upside objective of 340.00 mentioned in the 9/19 Market Update was achieved.
SMH remains above both the rising 50-day MA (blue rectangle) and the 200-day MA (red rectangle).
Support is at 330.00, 309.00, 300.00, 292.00, 282.00, and 265.00.
The MACD (middle chart) remains on a sell signal, narrowly missing a fresh buy signal resetting at 0. During strong moves, MACD sometimes will not fall below 0, and turn up before.
The Money Flow (lower chart) closed at 64.61, falling after hitting 80 in late September.
If Semiconductors (SMH) continue to hold onto their recent gains and accelerate higher, it would have a short-term positive impact on the broad market. On the other hand, if SMH weakens, closing two days below 330.00, a pullback is likely to occur.
Summing Up:
All major averages showed gains last week and have made record highs, continuing the rally from the April 2025 low with only minor retracements. Bad news, or economic data so far, has not triggered much selling pressure. The intermediate trend remains up on the major averages. As long as Technology, Small-Cap stocks, and market breadth remain firm and support levels hold on the major averages, the bulls remain in control, the rally is likely to continue into the fourth quarter. Manage your risk, and your wealth will grow.
If you would like to get to know each other better, schedule your Free 30-minute Wealth Building Strategy Session today. Register Here.


Create more wealth in your life
with these simple strategies.
As an added bonus you will also
receive BG’s Updates and Ezine

Discover how to quickly create more well-being in your life with these simple strategies.
As an added bonus you will also
receive BG’s Updates and Ezine

As an added bonus you will receive BG’s Updates and Ezine

All work listed on BonnieGortler.com is licensed under a Creative Commons Attribution - Noncommercial - No Derivative Works 3.0 Unported License.


Free Report:
Grow and Sustain Your Wealth
Discover how to grow your money with these easy, simple steps.

