

10 Simple Tips for Financial Well-Being
07/01/2026
MACD patterns flashed a number of warnings during the last few months, to no avail, as the major averages continued to rise. What a difference a week makes. Interest rates rose with the 10-year Treasury yields rising to their highest levels since 2011. Investors’ fear increased quickly. Buying quickly turned into selling. Previous support levels that held for the major averages were broken, causing a wave of selling to take place on October 10, one of the largest down days of the year. On the other hand, earlier this month our stock market U.S. models moved into the most bullish condition possible, consistent historical with relatively low risk. This suggests the present decline most likely will be contained and a turn out to be a buying opportunity. In the short-term stocks are oversold, favorable seasonality is upon us, and the long-term trend remains up. Even though volatility has increased, I continue to give the bulls the benefit of the doubt.
Where do we go from here?
Figure: Weekly iShares Russell 2000 Index (IWM) (top) and 12-26-9 MACD (bottom)
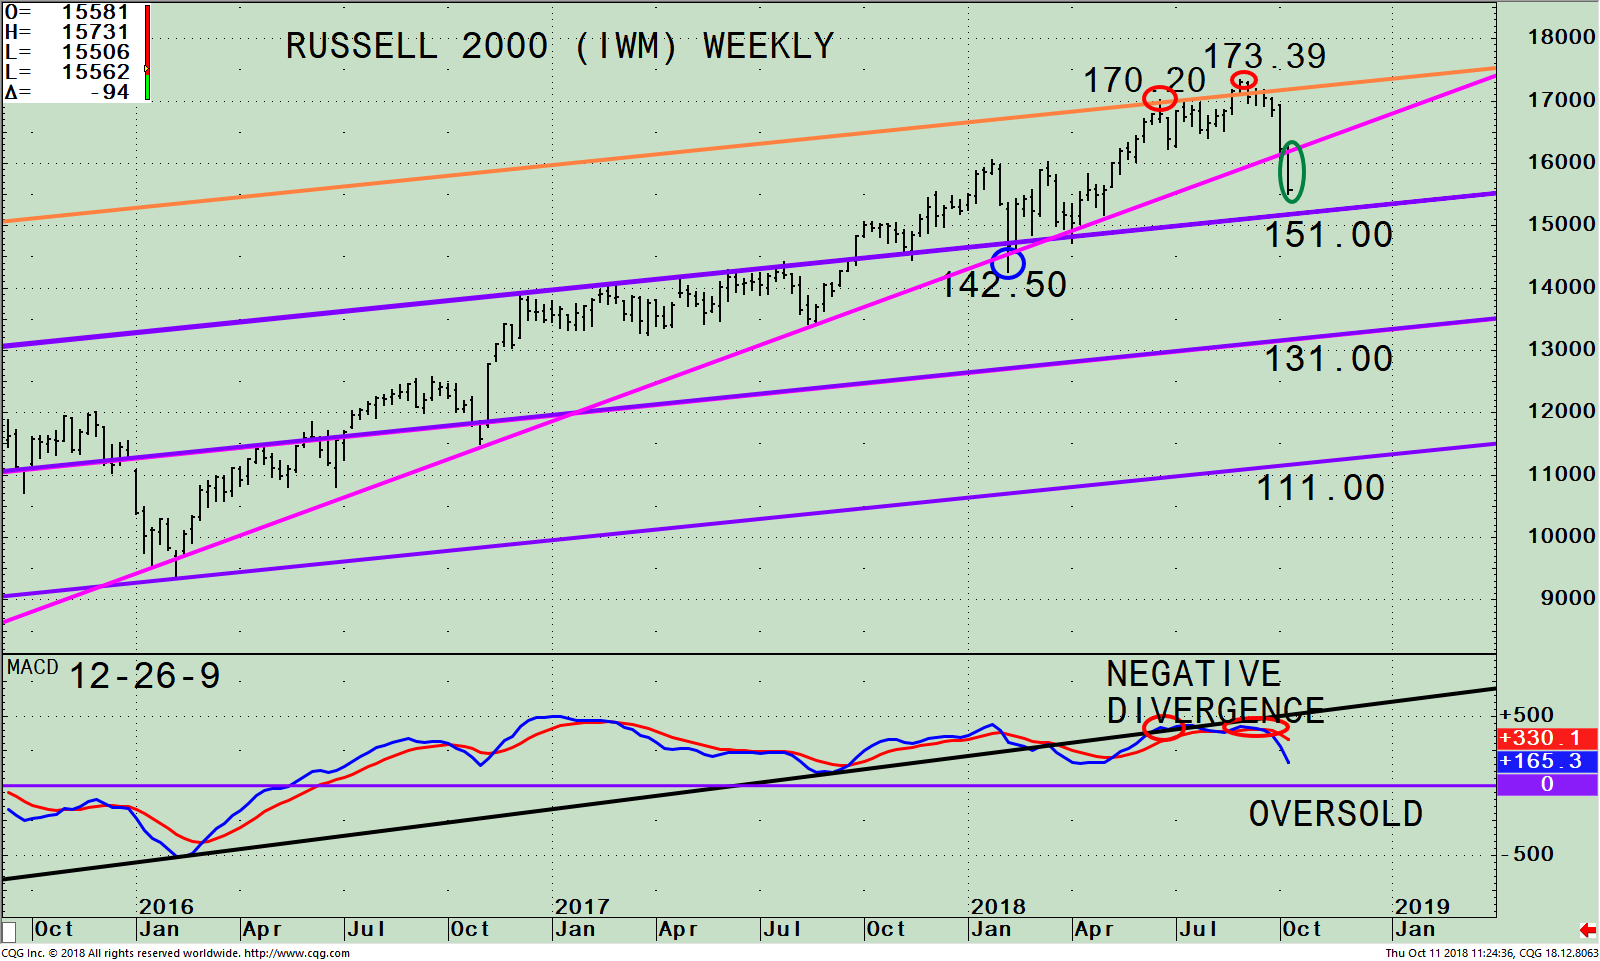
The top portion of the chart shows the weekly (intermediate-term) Russell 2000 (IWM) and its price channels (purple and orange lines). The iShares Russell 2000 Index ETF (IWM) is made up of companies with a market capitalization of between $300 million and $2 billion. The portfolio top sector holdings as of 10/19/18 are Financials 24.28%, Health Care 14.96%, Industrials 14.46%, Consumer Cyclicals 14.14%, and Technology 13.06%. (Source: http://www.etf.com/IWM)
The IWM hit the upper channel (orange line) on June 18 at 170.20 (red circle), followed by a small pullback before the peak at 173.39 on 8/31/18 (second red circle). The IWM has been in an uptrend (pink line) since February 2016 except for one small penetration (on 2/9/18). Eight months later, on 10/10/18, this uptrend has been violated (green circle). Small caps have been lagging the S&P 500 (SPY) since July after outperforming early in the year. However, the Russell 2000 (IWM) remains profitable for the year. Support is at 151.00. Although the IWM has fallen faster than the S&P 500 since its peak, I am anticipating the decline to hold at 151.00. In November favorable seasonality begins, the most bullish time of the year historically for small caps. However, I would be more concerned if the IWM has a weekly close below 151.00. This would not be a good sign, suggesting the decline could accelerate further possibly to 131.00 if the decline turns out to be more serious than I expect.
The lower portion of the chart is MACD, a technical indicator that measures momentum. MACD gave an initial sell signal in June 2018 (red circle on left) that was not confirmed by any falling double tops or negative divergences. Since IWM was in an uptrend at the time of this initial sell, it is recommended to ignore an initial sell signal and wait for a second sell to occur. This second sell did take place in August with MACD making a lower high than at the initial sell (red circle on right), not confirming the 8/31/18 price high in IWM at 173.39. This formed a negative divergence. MACD also warned momentum was weakening when MACD failed to get above the uptrend (black line) that was broken when IWM made a new high and then turned lower.
Now, MACD is falling as the Russell 2000 (IWM) price has declined from its peak. MACD is not yet in an oversold condition below 0 (purple line) for the intermediate term. No positive divergence has formed yet. It’s possible that the IWM may not get fully oversold before the IWM goes higher. It would not surprise me over the next several days if the IWM stabilizes after testing support at 151.00 and then starts to rise. It’s a good sign MACD is oversold for the short term (daily chart not shown) where rallies develop. A turn up in MACD along with the IWM outperforming the S&P 500 (SPY) would be a sign the present decline is over.
See chart below.
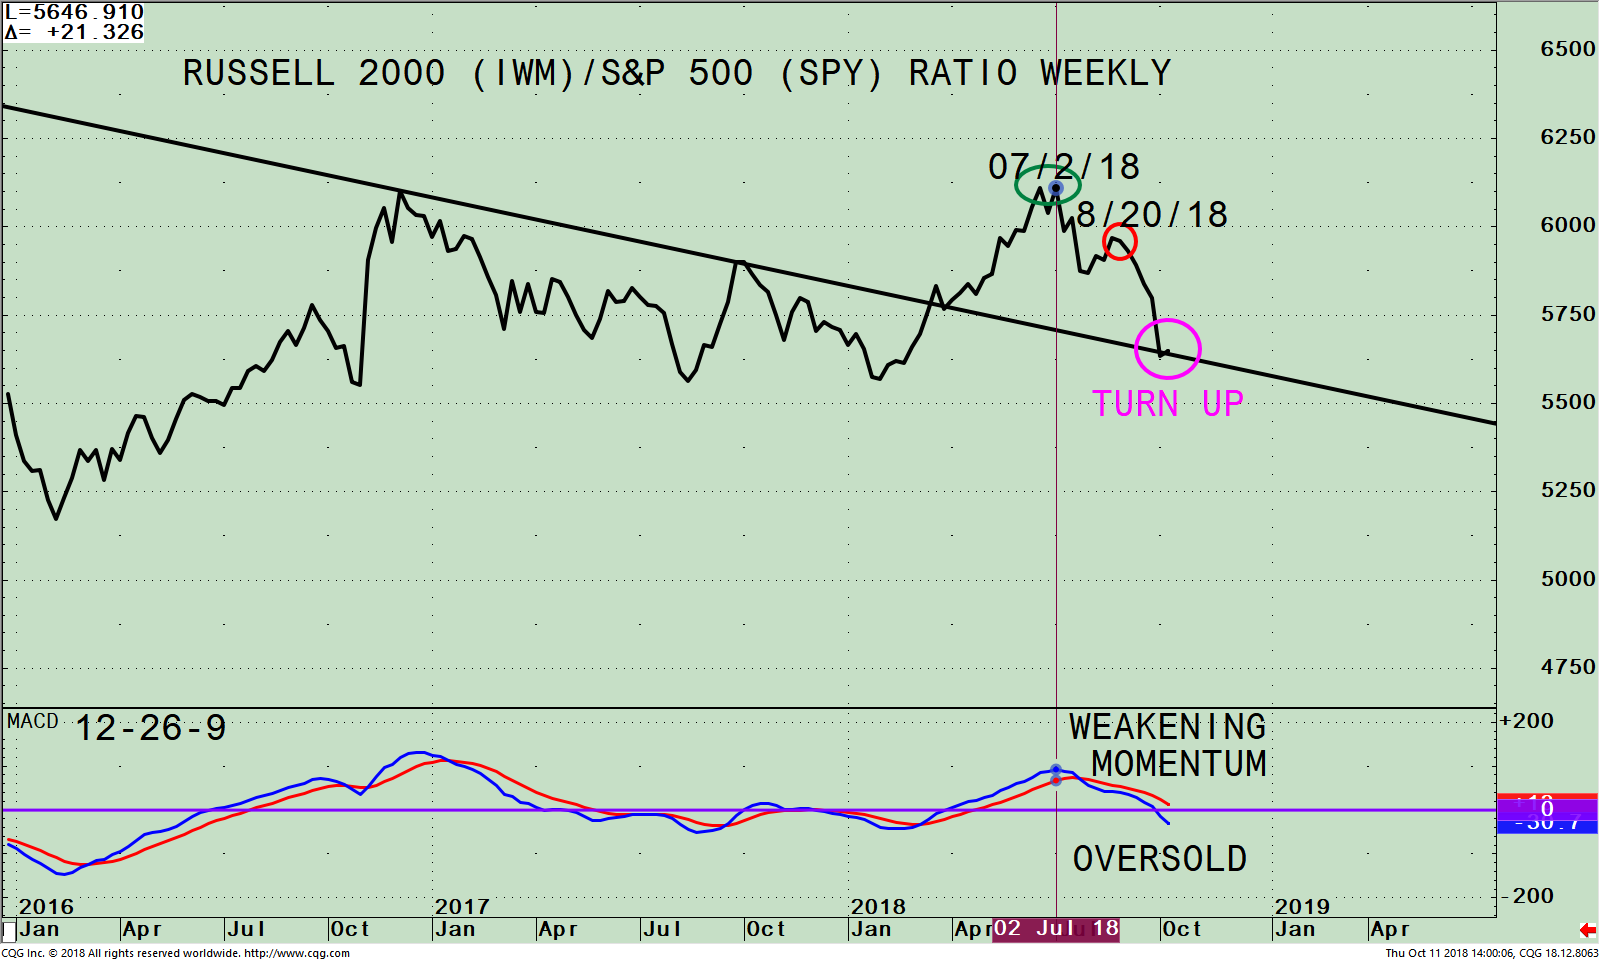
Figure: Weekly iShares Russell 2000 Index (IWM)/S&P 500 Index (SPY) Ratio (top) and 12-26-9 MACD of this Ratio (bottom)
The top part of the chart is the weekly Russell 2000 Index / S&P 500 Index Ratio (IWM/SPY). A rising line means the IWM is stronger, and if falling, the SPY is stronger. The IWM/SPY ratio peaked on 7/2/18, confirming the June 18 high in the IWM. However, the ratio quickly turned down forming a double top on 8/20/18 as the Russell 2000 (IWM) moved higher, peaking on 8/31 at 173.39.
The IWM ratio (IWM/SPY) indicates that IWM has been weaker than the S&P 500 since 7/2/18. However, the ratio has stopped accelerating lower and has slightly turned up (pink circle) as IWM held up better than SPY during this week’s decline.
The lower portion of the chart is the MACD of the IWM/SPY ratio. MACD of the ratio is now oversold and in a favorable position for a rally. A turn up at this time would be considered bullish and it would coincide with favorable seasonality that starts in November for small caps.
Summing Up:
Small caps have been lagging in relative strength compared to the S&P 500 (SPY) since the summer after sharp gains were made in the Russell 2000 during the first half of the year. However, a buying opportunity in small caps may be close at hand. Momentum oscillators that had negative divergences are now moving into favorable buying areas where a meaningful rally could begin. With our U.S. trading model in the most bullish area, I remain optimistic the IWM will stop falling, hold above 151.00, and start to rise to lead the overall market higher. On the other hand, if the Russell 2000 (IWM) falters and breaks below 151.00, this would imply more volatility, a bumpy road ahead and a more meaningful decline to possibly 131.00 is ahead.
Drop me a line! I’d love to hear from you. Please call me at 516-829-6444 or email at bgortler@signalert.com to share your thoughts or ask me any questions you might have.
Sign up for a FREE 3 issue trial of
SYSTEMS AND FORECASTS Click HERE
******Article published in Systems and Forecasts by Bonnie Gortler October 11, 2018

If you like this article you would love the free
excerpt chapter of my book Journey to Wealth.
Get instant access here
Disclaimer: Although the information is made with a sincere effort for accuracy, it is not guaranteed that the information provided is a statement of fact. Nor can we guarantee the results of following any of the recommendations made herein. Readers are encouraged to meet with their own advisors to consider the suitability of investments for their own particular situations and for determination of their own risk levels. Past performance does not guarantee any future results.


Create more wealth in your life
with these simple strategies.
As an added bonus you will also
receive BG’s Updates and Ezine

Discover how to quickly create more well-being in your life with these simple strategies.
As an added bonus you will also
receive BG’s Updates and Ezine

As an added bonus you will receive BG’s Updates and Ezine

All work listed on BonnieGortler.com is licensed under a Creative Commons Attribution - Noncommercial - No Derivative Works 3.0 Unported License.


Free Report:
Grow and Sustain Your Wealth
Discover how to grow your money with these easy, simple steps.

