

10 Simple Tips for Financial Well-Being
07/01/2026
The major averages reversed sharply to the upside in January after an ugly December. The rally was explosive. There was strong breadth data and momentum thrusts that have not been seen for a few years. In the past, this type of technical strength suggests potential gains are likely. However, this doesn’t rule out a short-term decline. Many major averages are at or near overhead resistance that coincides with key intermediate and long-term moving averages. Even with the rise, no major average has traded higher than the early December high. There remains a risk of a retest of the December low that I am expecting to be successful. I believe the low will be higher, therefore creating a buying opportunity that could ultimately lead to new price highs in the months ahead.
Where do we go from here?
Watch the tape for strength or weakness in Technology
Figure 1: PowerShares QQQ (Nasdaq 100 Index) Weekly Price, 50 Week MA, and Trend Channels (top), and the 12-26-9week MACD (bottom)
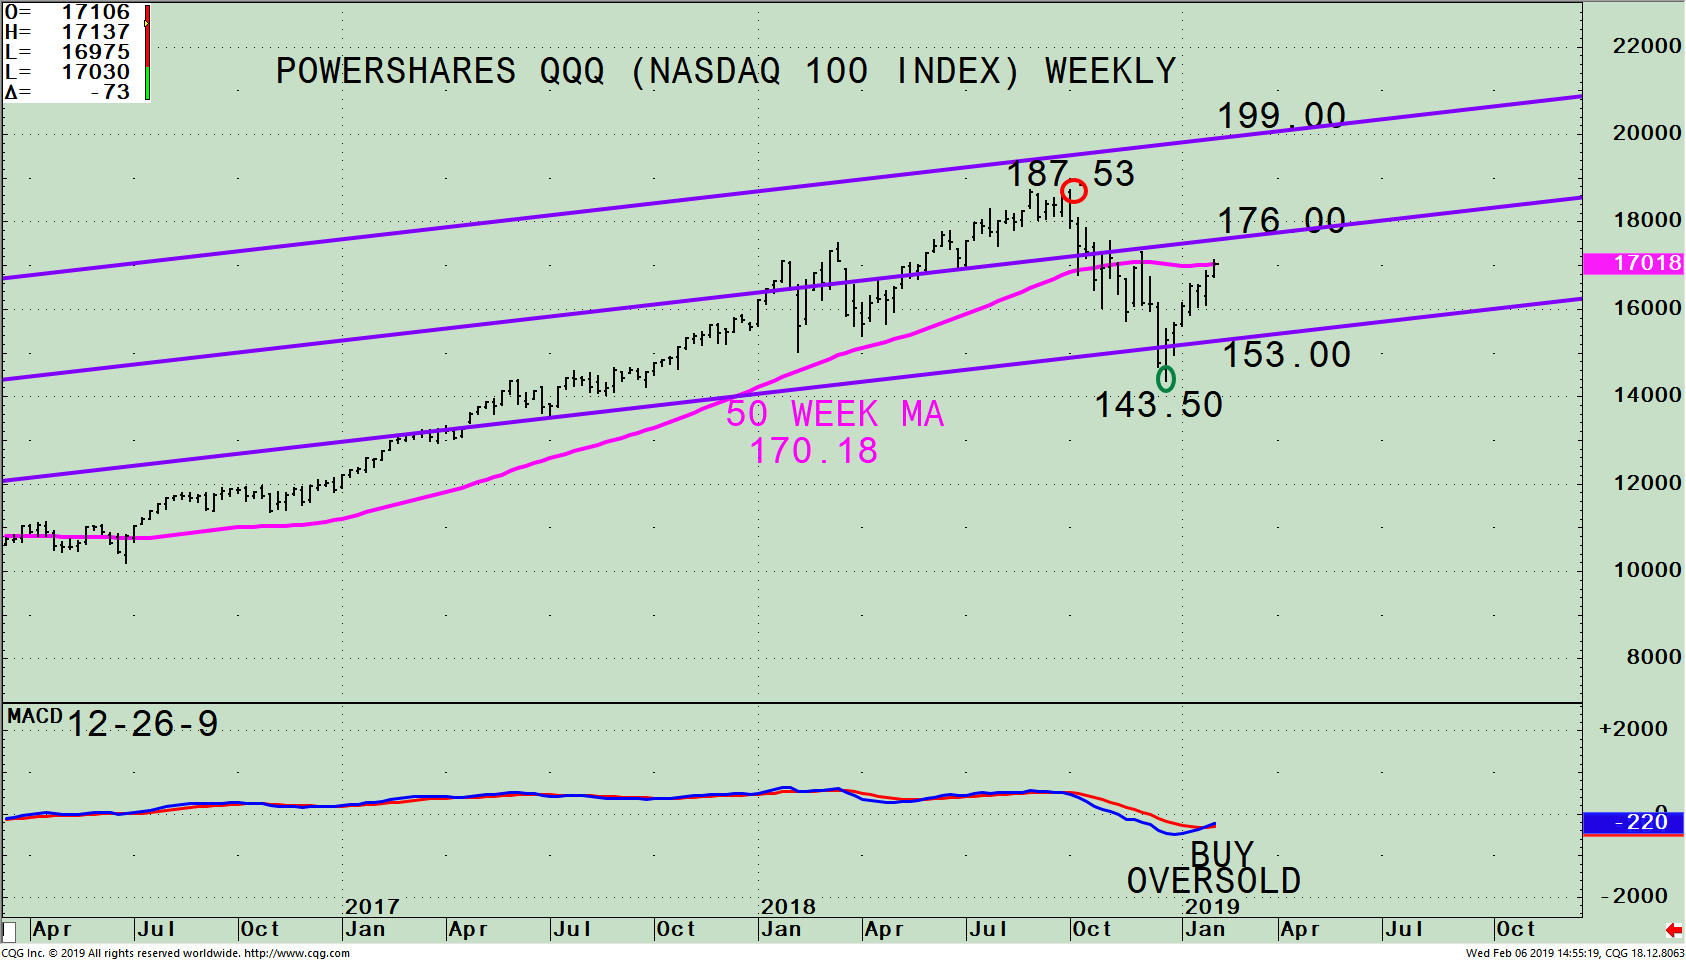
The top part chart shows the weekly PowerShares (QQQ), an exchange-traded fund based on the Nasdaq 100 Index, its active trend channel (purple line) and 50-week moving average. (***See below for top holdings.)
The QQQ made a new all-time high on 10/1 at 187.53 (red circle) and declined -23.5% to a low of 143.50 on December 24. The QQQ has gained over 18% during the recent 5 weeks reclaiming its leadership in relative strength compared to the S&P 500 (SPY) after 13 weeks when the S&P 500 (SPY) was stronger. If this relationship continues, this would be a positive sign the rally will continue. On the flip side, it would be a sign of more weakness to follow if the QQQ starts to decline now, and loses relative strength falling more than the S&P 500 (SPY).
On February 5, the QQQ closed at 171.03, above the 50-week moving average (170.18 pink line), a key resistance area that many institutional traders watch. However, on 2/6 there was no follow through to the upside. It appears a pause in the advance has started and some short-term weakness could begin. If the QQQ can close above the 50-week moving average (170.18) on 2/8, this would be bullish and attract more buyers. Resistance is at 176.00 (the middle channel). A break above 176.00 would be bullish and increase the likelihood of new all-time highs, potentially reaching the upper channel objective at 199.00.
On the other hand, on a short-term basis, there remains the risk of a retest of the December low. However, due to the upside thrust in momentum, improved tape action, and market breadth, I am not looking for the lows to be violated. First support is 162.50, (a key support level on the hourly chart), followed by the lower channel at 153.00. Unless the QQQ can get through the 50-week moving average and through 176.00, the middle channel, look for some short-term weakness.
The bottom half of the chart is MACD (12, 26, 9), a measure of momentum. MACD is rising from a very oversold condition where sustainable market rallies occur. If there is a decline in the QQQ over the next several weeks a favorable double bottom formation is likely to form.
Figure: PowerShares QQQ (Nasdaq 100 Index) Daily Price, and Trend Channels (top), and the 12-26-9-week MACD (bottom)
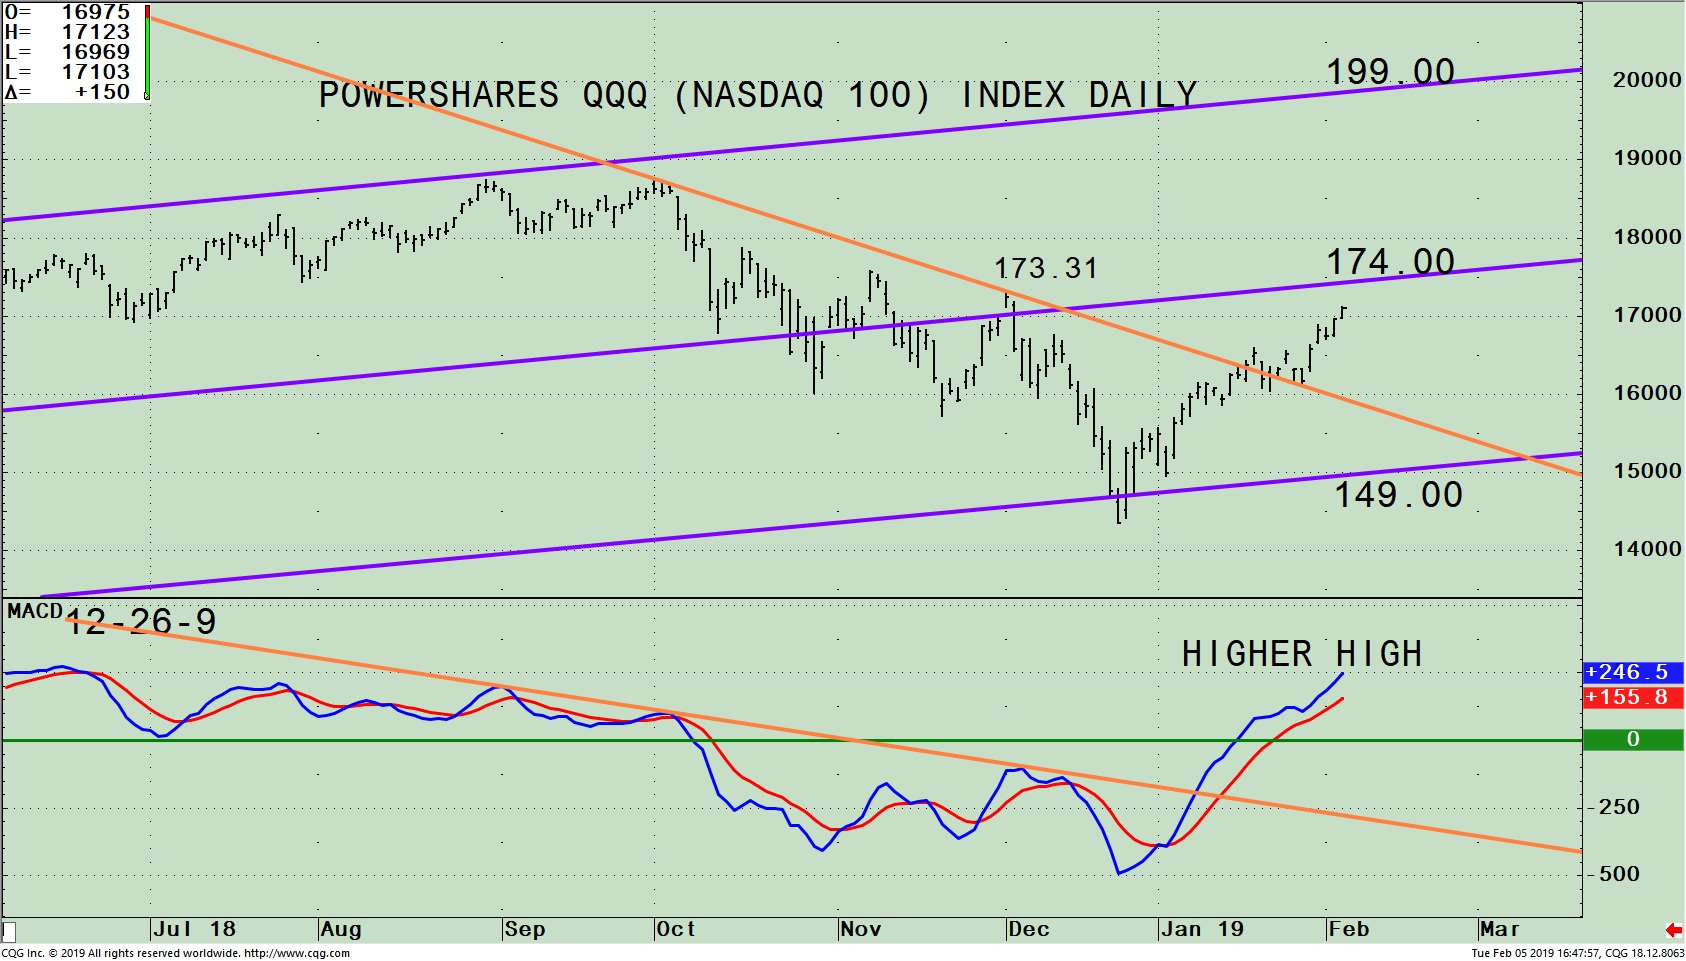
The top chart shows the Daily PowerShares (QQQ), an exchange-traded fund based on the Nasdaq 100 Index, and its active trend channel (purple line).
The QQQ lost 23.5% from its peak on 10/1. The QQQ has recovered over 18% from its low on 12/24. Normally after a large decline of this magnitude a retest of low occurs 3-6 weeks later. There has been no pullback of any significance. Resistance is just above the high made on December 3 at 173.31 at 174.00 (the middle channel). If the QQQ closes above the middle channel at 174.00 the rally is likely to continue. The upside objective is 199.00 coinciding with the weekly upside objective.
The bottom half of the chart is MACD (12, 26, 9), a measure of momentum. MACD rose sharply from a very oversold condition breaking the downtrend in January (orange line), then rising to an overbought condition confirming the high made in the QQQ. Near term weakness in the QQQ could begin at any time. However, with MACD making a higher high confirming the QQQ rise, the first decline is likely to be contained and a buying opportunity before another rally begins.
In Sum
A bit of a mixed picture technically. Sharp gains in January and the first week in February have made daily momentum indicators including MACD extended in an overbought condition. However, for the intermediate term, MACD is the opposite, oversold and on a buy. Long-term MACD (monthly chart not shown) is still pointing down, not yet in an ideal buying condition. Because of the magnitude of the thrust to the upside in price and a big improvement in market breadth, the odds favor any decline will be contained and a buying opportunity.
The tape action in the Nasdaq has been favorable. It’s a positive sign Nasdaq is leading in weekly relative strength compared to the S&P 500 (SPY) for the short and the intermediate term. I recommend keeping an eye on the top holdings in the QQQ as a clue if the strength will continue or a pullback will begin. (see below***). If the top holdings continue to rise this will help the QQQ close above both the daily and the weekly middle channel between 174.00 – 176.00 and potentially take out the old highs. Amazon (AMZN) and Microsoft (MSFT) look most vulnerable for a pullback. For now, the bulls are in control but be alert if the present rally stalls and the QQQ falls below support at 162.50.
I would love to hear from you. Please call me at 516-829-6444 or email at bgortler@signalert.com to share your thoughts or ask me any questions you might have.
*** The QQQ includes 104 of the largest domestic and international nonfinancial companies listed on the Nasdaq. As of 2/5/18, the top holdings are Apple, (AAPL) 9.6%, Microsoft Corp (MSFT) 9.59%, Amazon.com, Inc. (AMZN) 9.43%, Facebook, Inc. (FB) 4.85%, Alphabet Inc. Class C (GOOG) 4.71%, and Alphabet Inc. Class A (GOOGL), 4.14% totaling 42.32%. Source: https://www.etf.com/QQQ#overview
******Article published in Systems and Forecasts by Bonnie Gortler February 7, 2019
Disclaimer: Although the information is made with a sincere effort for accuracy, it is not guaranteed that the information provided is a statement of fact. Nor can we guarantee the results of following any of the recommendations made herein. Readers are encouraged to meet with their own advisors to consider the suitability of investments for their own particular situations and for determination of their own risk levels. Past performance does not guarantee any future results.
If you like this article you would love the free
excerpt chapter of my book Journey to Wealth.
Get instant access here


Create more wealth in your life
with these simple strategies.
As an added bonus you will also
receive BG’s Updates and Ezine

Discover how to quickly create more well-being in your life with these simple strategies.
As an added bonus you will also
receive BG’s Updates and Ezine

As an added bonus you will receive BG’s Updates and Ezine

All work listed on BonnieGortler.com is licensed under a Creative Commons Attribution - Noncommercial - No Derivative Works 3.0 Unported License.


Free Report:
Grow and Sustain Your Wealth
Discover how to grow your money with these easy, simple steps.

