

10 Simple Tips for Financial Well-Being
07/01/2026
After one of the worst December’s historically that created a very oversold short-term market condition, stocks have rallied for the past four weeks to begin 2019. The threat of rising interest rates appears to be on hold. U.S. trade talks are promising, and the recession talk has quieted. Although the fears of the global economy slowing down remain, the massive selling and 2-3% intraday swings seem to have passed. The stock market climate has changed dramatically for the better. There has been a significant improvement in technical indicators based on stock market breadth and momentum in January which bodes well for 2019. With the sharp rise in equities our stock market U.S. model has shifted to “buy”, the most bullish condition, suggesting risk is most likely to be contained. Although a retest of the December low is possible, I am expecting any retest to be successful. The worst of the decline should be behind us and a profitable 2019 lies ahead.
Figure: Weekly Russell 2000 (IWM), S&P 500 (SPY), Midcap 400 (MDY), and Nasdaq 100 (QQQ) Price (Top) and 12-26-9 MACD (Bottom)
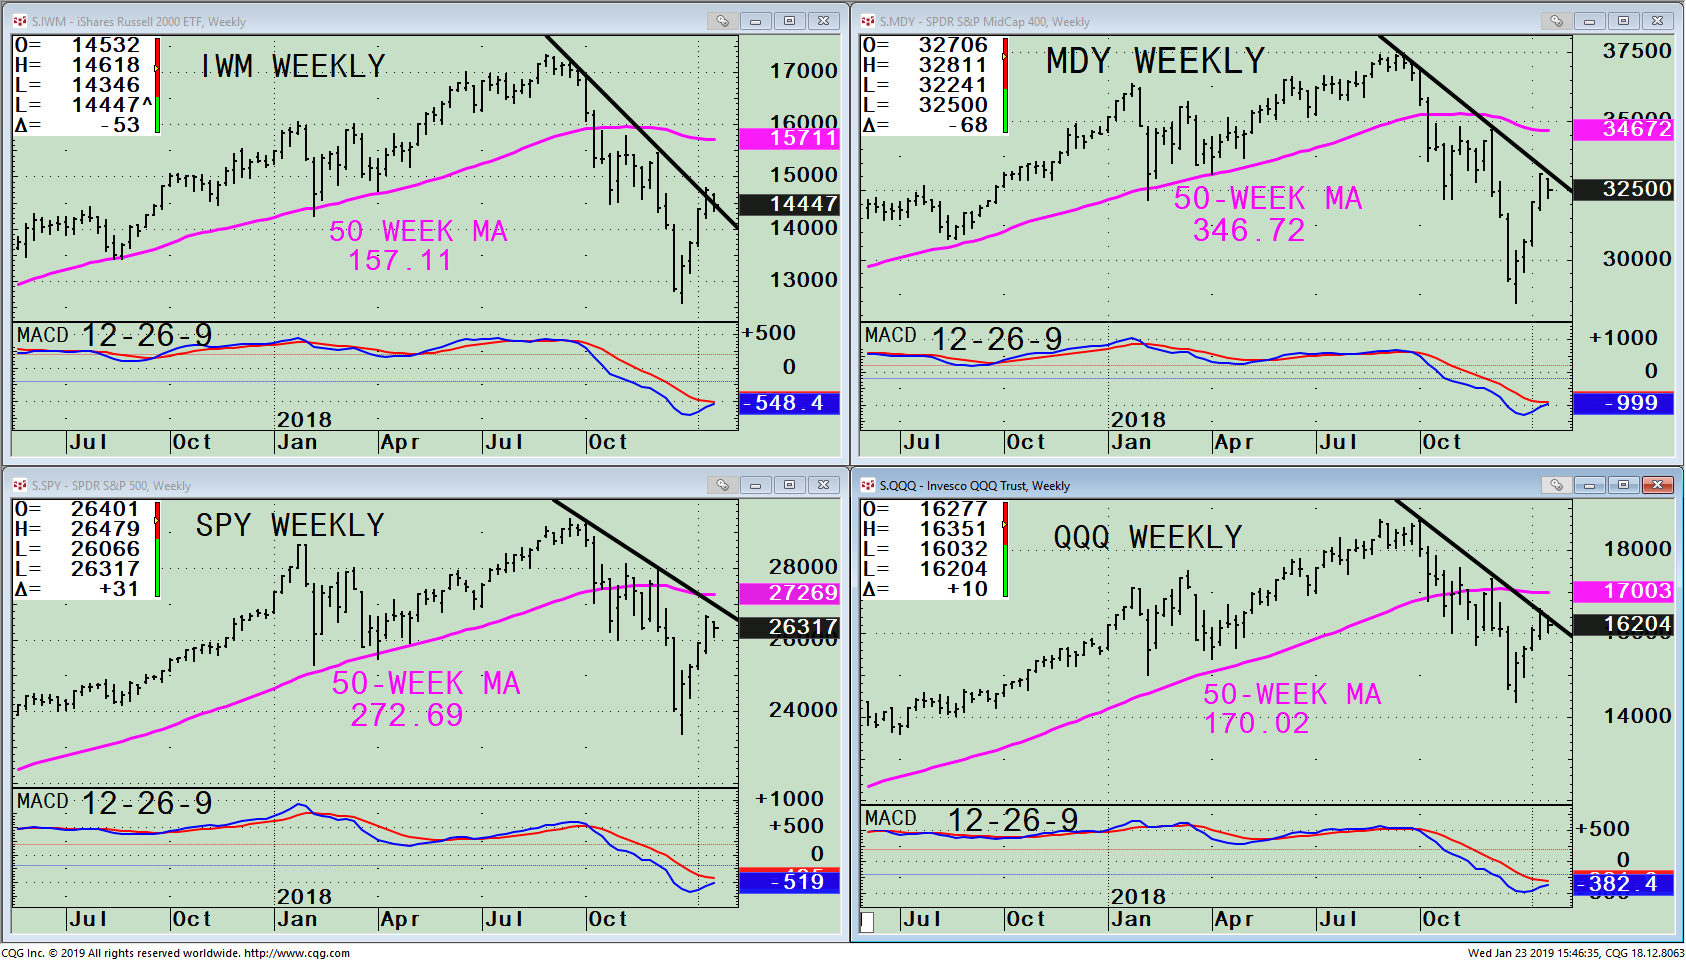
The weekly charts (intermediate-term) position suggests a promising outlook over the next several weeks to months. Below are some observations on all four market indices: Russell 2000 (IWM), S&P 500 (SPY), Midcap 400 (MDY), and Nasdaq 100 (QQQ).
Because of the severity of the decline in December, all four indices remain below their 50-week moving average (1/23/19). There is room to the upside. A likely area of resistance for this rally is:
Summing Up:
The Russell 2000 (IWM), S&P 500 (SPY), Midcap Growth (MDY), and Nasdaq 100 (QQQ) have risen sharply, more than 10% from their December low. Market breadth and momentum indicators are improving for the intermediate term. The upside thrust that has occurred in all four of the market indices is bullish. The indices continue higher without any pullback, a sign of underlying strength. This is a reason to be optimistic that more upside will likely occur. However, because there was a significant thrust to the downside only a few weeks ago, a retest of the low cannot be ruled out. In the past, retests happen approximately three to 6 weeks after a low. Since the December low, four weeks have passed, therefore if the market does stall the retest could start at any time. If company earnings are constructive, the U.S. and China trade deal is made, and interest rates remain low, then the present rally could continue without a retest to the 50-week moving averages on the Russell 2000 (IWM), S&P 500 (SPY), Midcap 400 (MDY), and Nasdaq 100 (QQQ).
******Article published in Systems and Forecasts by Bonnie Gortler January 24, 2019
Disclaimer: Although the information is made with a sincere effort for accuracy, it is not guaranteed that the information provided is a statement of fact. Nor can we guarantee the results of following any of the recommendations made herein. Readers are encouraged to meet with their own advisors to consider the suitability of investments for their own particular situations and for determination of their own risk levels. Past performance does not guarantee any future results.
If you like this article you would love the free
excerpt chapter of my book Journey to Wealth.
Get instant access here


Create more wealth in your life
with these simple strategies.
As an added bonus you will also
receive BG’s Updates and Ezine

Discover how to quickly create more well-being in your life with these simple strategies.
As an added bonus you will also
receive BG’s Updates and Ezine

As an added bonus you will receive BG’s Updates and Ezine

All work listed on BonnieGortler.com is licensed under a Creative Commons Attribution - Noncommercial - No Derivative Works 3.0 Unported License.


Free Report:
Grow and Sustain Your Wealth
Discover how to grow your money with these easy, simple steps.

