

10 Simple Tips for Financial Well-Being
07/01/2026
The Dow, S&P 500, and Nasdaq have attempted several times to make new highs in September and October. However, when each attempt was made, the rally stalled, resulting in a short-term decline as the averages stayed within a range below their new all-time highs. If October lows are not violated, I am looking for a breakout to occur in the U.S. major averages finishing the year with a strong fourth quarter, historically a favorable seasonal period. A key will be the support of the international markets.
Global markets have been out of favor lagging the U.S. market for many years. However, there appears to be a shift underway as investor interest in foreign assets has increased. It is bullish that the International averages are outperforming the S&P 500 this month. It’s possible for this to be the fuel that lifts the U.S. market to new highs and new upside objectives. As of 10/23, Emerging Markets (EEM) is up 3.7%, Europe (IEV) is up 2.7%, and the S&P 500 (SPY) is up 0.8%. There is a lot of room to the upside as both EEM and IEV are more than 12% below their January 2018 highs.
What ETFs to watch?
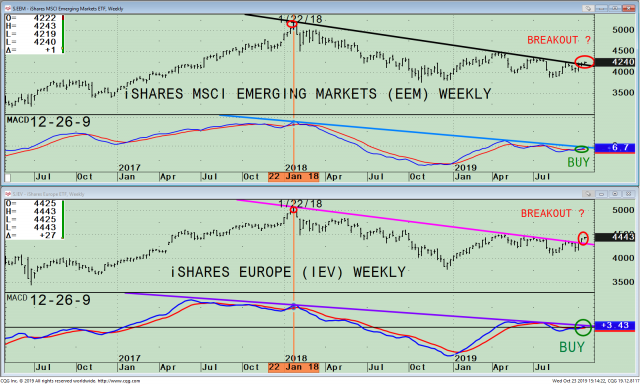 Figure (top to bottom): iShares (EEM) weekly, 12-26-9 week MACD of EEM, iShares Europe (IEV), 12-26-9 week MACD of IEV
The top portion of the chart is the iShare MSCI Emerging Markets (EEM)1 Weekly ETF. EEM is widely held, very liquid, and one of the oldest products on the market giving exposure to stock markets of emerging economies.
The top part of the chart shows the EEM has broken its weekly downtrend (black line) that began from its peak on 1/22/18 (red circle/orange vertical line on top chart). This breakout is bullish for the intermediate-term and is a buying opportunity. It’s also bullish the EEM broke its downtrend from 5/17/on the daily chart on 10/17 (not shown) with a favorable momentum pattern. Resistance is at 44.00. Any short-term weakness will likely be contained and staying above support at 40.00.
Below EEM is the 12-26-9 week, MACD of EEM. MACD is a measure of momentum. Last week a new buy signal was generated. If EEM continues to rise, it will break the almost two-year downtrend (blue line), increasing the odds that downside momentum is complete. The next several weeks can make a difference if emerging markets can sustain a rally supporting the U.S. market.
Another international ETF that is showing a breakout to the upside is iShares Europe (IEV). This ETF is focused on the economies of developed Europe, including 350 stocks in more than a dozen different economies.
The third section from the top of the chart show the iShares Europe (IEV)2 Weekly breaking its weekly downtrend (pink line top chart) from 1/22/18 (vertical orange line), corresponding to the same time the EEM peaked. This breakout is bullish for the intermediate-term and is also a buying opportunity. The IEV broke its downtrend on the daily chart on 10/11 (not shown) a few days before EEM. Resistance is just above at 45.00. Any short-term weakness is likely to be contained near 44.00. A close below 41.00 would negate my positive outlook on IEV.
The bottom half of the chart is the 12-26-9 week, MACD of IEV. MACD gave a new buy and is very close to breaking its downtrend (purple line). An upside penetration would imply downside momentum is complete. I am expecting the downtrend to be broken, confirming the breakout in price over the next few weeks.
Recommendation:
For those of you who are overweight in U.S. equities, or are heavily weighted in a sector, or have extra cash, now would be a suitable time to add a 5% position in Emerging Markets (EEM) and Europe (IEV). Use 40.00 as a stop for EEM and 41.00 as a stop for IEV. This is not an official portfolio recommendation, just a speculative buy.
Summing Up:
It’s a bullish sign that international markets are acting well in October, and intermediate-term momentum is improving. Emerging Markets (EEM) and Europe (IEV) have broken their price downtrend and have been gaining relative strength as compared to the S&P 500. From a charting perspective, the intermediate trend is now favorable. This would imply additional gains in the coming weeks. There is a good upside potential in Emerging Markets (EEM) and Europe. Strength in EEM and IEV, is likely to support the U.S market to make new all-time highs sooner rather than later.
I would love to hear from you. Please call me at 516-829-6444 or email at bgortler@signalert.com to share your thoughts or ask me any questions you might have.
1As of 10/22/19, the top five countries of EEM are China 29%, South Korea 12%, Taiwan 11%, India 8%, and Brazil 7%, totaling 67.%. The top 5 sectors are Financials 21%, Technology 14%, Communications 12%, Consumer Cyclical 11%, and Energy (7%) totaling 65.0%. Source: https://etfdb.com/etf/EEM/
2As of 10/23/19, the top five countries of IEV are United Kingdom 23%, France 16%, Switzerland 15%, Germany 13%, and the Netherlands 9% totaling 76.0%. The top 5 sectors are Financials 17%, Consumer Non-Cyclical 14%, Healthcare 14%, Industrials 13%, and Consumer Cyclical 9% totaling 67.0%. Source: https://etfdb.com/etf/IEV/
Sign up for a FREE 3 issue trial of
SYSTEMS AND FORECASTS Click here

If you like this article you will love my
Free EBook Grow Your Wealth and Well-Being Ebook
.
******Article first published in Systems and Forecasts on October 23, 2019
Disclaimer: Although the information is made with a sincere effort for accuracy, it is not guaranteed that the information provided is a statement of fact. Nor can we guarantee the results of following any of the recommendations made herein. Readers are encouraged to meet with their own advisors to consider the suitability of investments for their own particular situations and for determination of their own risk levels. Past performance does not guarantee any future results.


Create more wealth in your life
with these simple strategies.
As an added bonus you will also
receive BG’s Updates and Ezine

Discover how to quickly create more well-being in your life with these simple strategies.
As an added bonus you will also
receive BG’s Updates and Ezine

As an added bonus you will receive BG’s Updates and Ezine

All work listed on BonnieGortler.com is licensed under a Creative Commons Attribution - Noncommercial - No Derivative Works 3.0 Unported License.


Free Report:
Grow and Sustain Your Wealth
Discover how to grow your money with these easy, simple steps.

