

10 Simple Tips for Financial Well-Being
07/01/2026
Small-cap, mid-cap, transports, financials, and bank sectors have been weaker than the S&P 500 in 2019, implying caution by investors not willing to invest in riskier assets. These sectors continue to lack leadership, not favored by investors and remain far from their new all-time highs. The major averages, Dow, S&P 500, and Nasdaq are all less than 4% from their all-time highs. I believe on October 3 the averages had an upside reversal when they rose by approximately 2%. However, the major averages stalled at resistance, raising concern the reversal was false.
Many times, a few days after a reversal occurs, they have another test of the lows. This I believe occurred on 10/8 and again on 10/9. All tests are not successful, as sometimes the lows get violated and a decline follows. Time will tell if the trading range that the major averages are in will be violated to the downside, or if the last several months have been a base for a new leg to the upside. If the lagging sectors begin to show strength this would be a bullish sign that higher prices are ahead.
Keep an eye on Regional Banks
Figure: SPDR Regional Banking ETF (KRE) Weekly Price (Top), and MACD 12-26-9
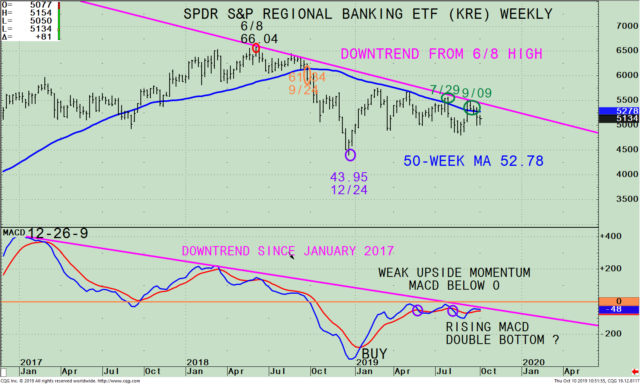
The top part of the chart shows the weekly (intermediate-term) SPDR Regional Banking (KRE)1 price with a 50-week moving average (blue line) that traders watch and use to define trends. KRE is an exchange-traded-fund (ETF) that began in 2006. KRE tracks an equally weighted index of common stocks including leading regional banks or thrifts (savings and loan associations). KRE is a volatile ETF at times, even though it holds 125 stocks and its top ten holdings are each less than 3%.
I like to watch the strength of Regional Banks (KRE) for a clue when there is a potential trend change. When the KRE is strong, it tends to be a positive sign for the broad market. However, when KRE lags, it tends to be a warning sign that underlying weakness may persist.
KRE has been weaker in terms of relative strength compared to the S&P 500 and is approximately 22% below its all-time high made on 6/8/18 (red circle). KRE fell below the 50-week Moving Average (MA) on 9/24/18 at 61.84 (orange circle), selling accelerated before finally making a low at 43.95 on 12/24/18. KRE reversed sharply along with the major averages to the upside in January but stalled at its 50-week MA which acted as resistance. KRE then declined, testing the December lows. Another rally followed which again stopped at the 50-week MA. This pattern continued until KRE was finally able to penetrate the 50-week MA in July 2019 (green circle). However, notice how KRE didn’t have enough strength to break its weekly downtrend (pink line) and fell.
KRE at the time of this writing is at 51.35. In my opinion, for the broad market to sustain a meaningful advance the KRE and the sectors that have been lagging begin to show a sign of strength. It would be bullish if KRE can first close above the weekly 50-week MA at 52.78 (2.75% above) and then gain enough strength to break the weekly downtrend, approximately at 55.00. Support is at 47.98, the 8/26 low. A close below 47.98 would negate my positive outlook and imply a move lower to potentially test the 12/24 low at 43.95.
The lower portion of the chart is MACD (12, 26, 9 week), a technical indicator that measures momentum. MACD gave a buy in January but has shown weak momentum (orange horizontal line) where it’s been unable to get above 0 on each rally this year. MACD since January had numerous crossings above and below its signal line (purple eclipses).
Near-term momentum is improving. A possible double bottom has formed. It would be bullish if MACD would continue to rise and break the downtrend (pink line) from January. This would imply more gains in the coming weeks. It’s also positive that MACD is oversold and has potential favorable patterns forming on the daily, and monthly charts as well as weekly. When the trend shifts to favorable, this is when trading on the long side is usually more forgiving and a great buying opportunity. On the other hand, (I am not expecting this to occur), I would be very concerned if weekly MACD makes a lower low. This would give a warning sign of a potentially serious decline ahead.
In Sum:
Watch the near-term movement of Regional Banks. If KRE closes above the weekly 50-week MA at 52.78 (2.75% above) this would be positive for the broad market. When the Regional Banks (KRE) is a leading sector, it tends to be positive for the overall market. If KRE rises in the near term and starts to outperform the S&P 500 (SPY) this would be a bullish sign for more gains in the fourth quarter.
I would love to hear from you. Please call me at 516-829-6444 or email at bgortler@signalert.com to share your thoughts or ask me any questions you might have.
1 As of 10/8/19, the top five holdings of KRE are PNC Financial Services Group Inc. (PNC) 2.89%, First Republic Bank (FRC) 2.84%, Comerica Inc (CMA) 2.80%, BB&T Corp (BBT) 2.79%, and M&T Bank Corp (MTB) 2.79% totaling 14.11%. Source: https://etfdb.com/etf/KRE/
Sign up for a FREE 3 issue trial of
SYSTEMS AND FORECASTS Click here

If you like this article you will love my
Free EBook Grow Your Wealth and Well-Being Ebook
.
******Article first published in Systems and Forecasts on October 10, 2019
Disclaimer: Although the information is made with a sincere effort for accuracy, it is not guaranteed that the information provided is a statement of fact. Nor can we guarantee the results of following any of the recommendations made herein. Readers are encouraged to meet with their own advisors to consider the suitability of investments for their own particular situations and for determination of their own risk levels. Past performance does not guarantee any future results.


Create more wealth in your life
with these simple strategies.
As an added bonus you will also
receive BG’s Updates and Ezine

Discover how to quickly create more well-being in your life with these simple strategies.
As an added bonus you will also
receive BG’s Updates and Ezine

As an added bonus you will receive BG’s Updates and Ezine

All work listed on BonnieGortler.com is licensed under a Creative Commons Attribution - Noncommercial - No Derivative Works 3.0 Unported License.


Free Report:
Grow and Sustain Your Wealth
Discover how to grow your money with these easy, simple steps.

